Miguel Alexandre Dias Almeida
Dissertação para obtenção do grau de Mestre em Engenharia Física
Planning, Operations and Data Handling of
Planetary Science Missions
Dissertação para obtenção do Grau de Mestre em Engenharia Física
Supervisor: Orlando M.N.D. Teodoro, Professor Associado,
Faculdade de Ciências e Tecnologia
Júri:
LO
M
B
A
D
A
Planning, Operations and Data Handling of Planetary Science Missions Miguel Almeida
I
Miguel Alexandre Dias Almeida
Dissertação para obtenção do grau de Mestre em Engenharia Física
Planning, Operations and Data Handling of
Planetary Science Missions
Dissertação para obtenção do Grau de Mestre em Engenharia Física
Orientador: Orlando M.N.D. Teodoro, Professor Associado,
Faculdade de Ciências e Tecnologia
Júri:
Presidente: Orlando Teodoro Arguentes: Fernando Parente
II
Planning, Operations and Data Handling of Planetary Science Missions – Copyright Miguel Almeida, FCT/UNL e UNL.
III
Resumo
Desde o ínicio da humanidade que a esfera celeste tem um lugar especial na nossa imaginação. Sempre possuí essa paixão pelo espaço. Em particular, alimentado pelas descobertas efectuadas no Sistema Solar, sempre sonhei em dedicar-me à exploração planetária.
Para perseguir essa ideia estudei Física e em 1999 tive finalmente a oportunidade de trabalhar em ciências planetárias.
Tudo começou no Observatório de Lisboa onde pude analisar dados do espectrometro de infra-vermelho (NIMS), a bordo da Sonda Galileo em órbita de Júpiter. Esta experiência deu-me a oportunidade de conhecer alguns dos métodos usados na análise de dados.
Prossegui depois a minha carreira na Agência Espacial Europeia, no planeamento das operações cientificas da sonda lunar SMART-1. Acabei por trabalhar nesta missão durante sete anos e de ver as minhas responsabilidades crescerem, tendo começado por dar apoio técnico ao Cientista Principal do Projecto. No final tinha sido um dos principais responsáveis pelo desenvolvimento do sistema de planeamento, e desempenhado inumeras funções ligadas ao Centro de Operações Cientificas da SMART-1 (STOC) e da Micro Camara Lunar (AMIE).
Finalmente em 2006 comecei a trabalhar como Cientista de Ligação, na Câmara de Monitorização de Vénus (VMC), que está a bordo da sonda Venus Express (VEX). Neste período tive a oportunidade de conjuntamente com o Investigador Principal melhorar o sistema de planeamento da VMC e com isso permitir obter dados cientificos de melhor qualidade. Durante este trabalho de optimização, e dado que a sonda já se encontrava a orbitar Venus, as minhas responsabilidades incluiam e ainda incluem todas as áreas de planeamento da VMC.
V
Abstract
Since the dawn of human kind the celestial sphere has had a special place in our imagination. I always felt the same passion for the cosmos. In particular, fuelled by the journeys of discovery of the Solar System, I always dreamed of dedicating myself to planetary exploration.
To follow that idea I studied physics and, in 1999, I finally got the opportunity to work in Planetary Science research.
It all started in the Lisbon Observatory, where I was able to analyse infrared data from the Jupiter orbiter, Galileo, collected by its Near-Infrared Mapping Spectrometer (NIMS). At this stage I learned some methods used in data analysis.
I continued my career in the European Space Agency in the Science Planning of the SMART-1 lunar spacecraft. I remained in this mission for the following seven years, and saw my responsibilities grow. I started by giving technical support to the Project Scientist. By the end of the mission I had been a major player in the setup of the planning system, and worked in all capacities within the SMART-1 Science and Technology Operations Centre, and the Advanced Moon Micro-Imager Experiment (AMIE).
VII
Table of Contents
Resumo ... III Abstract ... V Table of figures ... IX Glossary and Abbreviations ... XI
1. Introduction ... 1
2. Galileo/NIMS ... 3
2.1 Introduction ... 3
2.2 The Mission ... 3
2.3 Near Infrared Spectra Analysis ... 4
3. SMART-1 ... 9
3.1 Introduction ... 9
3.2 The Mission ... 9
3.3 Science Planning ... 12
3.4 Science Operations ... 18
3.5 Data Handling ... 19
3.6 Student Projects ... 25
4. Venus Express/VMC ... 27
4.1 Introduction ... 27
4.2 The Mission ... 28
4.3 Liaison Scientist ... 31
4.4 Long Term Planning ... 34
4.5 Student Projects ... 36
5. References ... 39
IX
Table of figures
Figure 1 - Artistic view of the Galileo Spacecraft in front of Jupiter (credit NASA) ... 3
Figure 2 - NIMS data. On top the imaging capabilities, in this case at 5 µm. And on the bottom the spectrometer capabilities (credit NASA) ... 5
Figure 3 - Model fitting of NIMS data for different water contents (Roos-Serote, et al., 2000) ... 6
Figure 4 - NIMS spectrum (solid line) from 4 µm to 5.2 µm (Roos-Serote, Pimentão, & Vicente, 2005) ... 7
Figure 5 - SMART-1 cruise phase (credit ESA) ... 10
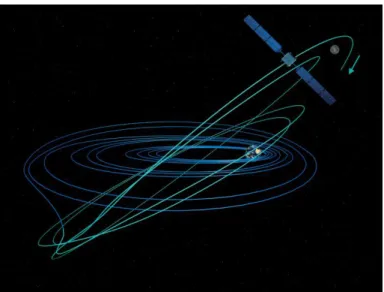
Figure 6 - SMART-1 orbit insertion and spiral down (credit ESA) ... 10
Figure 7 - General concept of Planetary Missions Science Operations Planning and its different components (Koschny, et al., 2004) ... 12
Figure 8 - The PTB 3D simulation environment with the spacecraft in Moon orbit, and the Earth and the Moon in background (not to scale) (Almeida M. , Foing, Heather, Marini, Lumb, & Racca, 2002) ... 14
Figure 9 - Simple schematics of the Experiment Planning System (Almeida, Foing, & Heather, Science Operations for ESA's SMART-1 Mission to the Moon, 2002) ... 14
Figure 10 - Prediction of AMIE continuous coverage capabilities at perilune (Almeida M. , Foing, Heather, Marini, Lumb, & Racca, 2002) ... 15
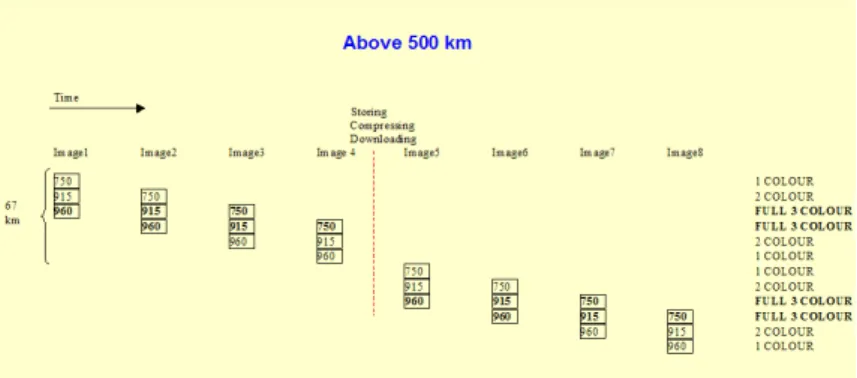
Figure 11 - Prediction of AMIE continuous coverage capabilities above 500 km (Almeida M. , Foing, Heather, Marini, Lumb, & Racca, 2002) ... 15
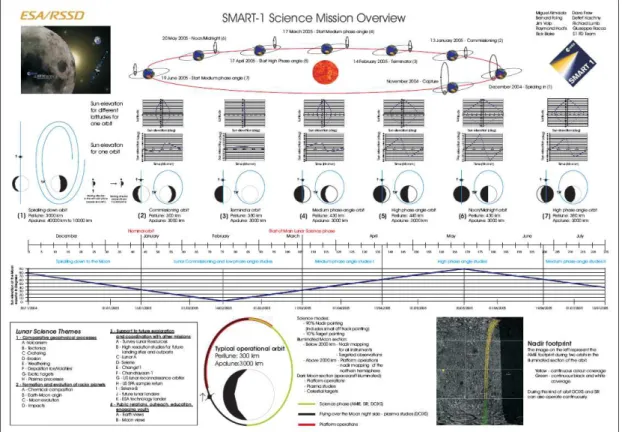
Figure 12 - SMART- 1 Science Mission overview poster (Almeida, et al., 2002) ... 16
Figure 13 - List of science opportunities of SMART-1 in orbit 2246 (Almeida, et al., 2006) ... 17
Figure 14 - SMART- 1 planning cycle (Almeida, et al., 2006) ... 18
Figure 15 - AMIE glass substract with different filters (Almeida, Koschny, & Grieger, AMIE to Planetary Science Archive Interface Control Document, 2008) ... 20
Figure 16 - AMIE dark current behaviour measured in the lab (Koschny, Almeida, & Beauvivre, Calibration Report of the AMIE PFM, 2003) ... 21
Figure 17 - AMIE pipeline schematics (Almeida, AMIE Pipeline Software Specification Document, 2003) ... 22
Figure 18 - The same region captured with different filters during push broom (Almeida, et al., 2006) ... 23
Figure 19 - Example of AMIE spectrum ... 23
Figure 20 - Rock identification parameters (Pieters, Head, Gaddis, Jolliff, & Duke, 2001) ... 24
Figure 21 - Comparison of a Clementine and AMIE cube for data validation (Cerroni, et al., 2008) .. 24
X
XI
Glossary and Abbreviations
Akatsuki spacecraft Japanese Venus Probe
AMIE Advanced Moon Micro-Imager Experiment
BIIC Bolsa de Iniciação à Investigação Cientifica
CCD Charged Coupled Device
EAICD Experiment to Archive Interface Control Document electric propulsion Spacecraft propulsion provided by the release of ions
EPS Experiment Planning System
ESA European Space Agency
Galileo spacecraft NASA Jupiter probe
IDL Interactive Data Language
ITL Input Timeline
Liaison Scientist
Scientist/Engineer that facilitates the connection between the Science Operations Centre and the Experiment team
LTP Long Term Plan
Magellan spacecraft NASA Venus Probe
MAPPS Mapping, Analysis and Planning Planetary Software
MOC Mission Operations Centre
MTP Medium Term Planning
NASA National Administration Space Agency
NIMS Near Infrared Mapping Spectrometer
PDS Planetary Data System
PI Principal Investigator
Project Scientist Lead Scientist in ESA Projects
PTB Project Test Bed
PTR Pointing Request File
SAP Science Activity Plan
SMART-1 Small Missions for Advanced Research in Technology 1
SOPS Science Operations Planning System
SPICE Planetary data information system
STOC SMART-1 Science and Technology Operations Centre
STP Short Term Plan
Venus Express ESA Venus Probe
VisualOps Visualisation Tool for Planning Science Operations
VMC Venus Monitoring Camera
1
1. Introduction
From a very young age I had an interest in Astrophysics, more specifically in Planetary Sciences. Of course at the time it was more about the beauty and less about the science. I had my small telescope, and I still remember that my priority was always to look at Jupiter and its moons; to Saturn, trying to see its illusive ring; to the Earth’s Moon; or to the odd comet. I also remember to be always astonished by the amazing NASA planetary science program.
So it was not a big surprise that I chose to follow physics at the university and, later on, managed to work on the planetary sciences field.
My first job on Planetary Sciences was at the Lisbon Observatory, under the supervision of Dr. Maarten Roos-Serote. I was awarded an Initiation to the Investigation Grant (BIIC), to work on Jupiter data from the NASA Galileo mission. This was only for a short period, but was a stepping stone to become more familiar with the field and to start to know what it was all about in practical terms. It also gave me the opportunity to move to the European Space Agency’s Science Directorate, where I have worked since.
I started by working at the lunar mission SMART-1. Growing from being an intern to be involved in almost everything related to planning and executing science operations as well as data calibration and analysis. As an intern I started to work on the definition of the science goals of the mission, with the SMART-1 Project Scientist, Dr. Bernard Foing. Afterwards I moved into the definition of the SMART-1 Science Activity Plan and Science Operations Planning Concept, while actively planning the less intense cruise phase. Finally, after the spacecraft arrived to the Moon, I was responsible for the planning of the daily operations of science pointing and commanding of the spacecraft. During this period I also worked in the requirements to improve the planning system. Regarding SMART-1, I was also deeply involved with its camera, AMIE. Here I started by working on the data calibration under AMIE Co-I, Dr. Detlef Koschny and later became myself a Co-I for the instrument, being the planning specialist while continuing the data calibration and doing some data analysis.
2
3
2. Galileo/NIMS
2.1 Introduction
My first contact with planetary sciences happened in the Lisbon Observatory. I chase this option after being in a very successful summer school on Planetary Sciences organized in Coimbra by Dr. Maarten Roos-Serote and Dr. João Fernandes. Even if my love for this field was already there since a very young age, to be in contact with the real thing was a life changer.
So, not long after that, I applied and was awarded a grant for research initiation (BIIC), to work with Dr. Maarten Roos-Serote on data analysis of the Near Infrared Mapping Spectrometer (NIMS) on board of the NASA Jupiter spacecraft Galileo. The BIIC was only for six months, but it showed me that this was the field where I would like to make a career and gave me an insight to what kind of research was being done.
2.2 The Mission
The Galileo mission was a NASA spacecraft sent to Jupiter. It was launched on the 18th of October 1989, and arrived at Jupiter on the 7th of December 1995.
Figure 1 - Artistic view of the Galileo Spacecraft in front of Jupiter (credit NASA)
Galileo was the first mission to visit Jupiter after the early planetary missions of the 70’s, when Pioneer 10 and 11 and Voyager 1 and 2 did flybys of Jupiter and collected a very limited data set on the planet. Galileo is also the only spacecraft that orbited Jupiter and studied it for an ample amount of time.
The Science objectives of the Galileo Orbiter were:
4
2. investigate the upper Jovian atmosphere and ionosphere;
3. characterize the morphology, geology, and physical state of the Galilean satellites; 4. investigate the composition and distribution of surface minerals on the Galilean satellites; 5. determine the gravitational and magnetic fields and dynamic properties of the Galilean
satellites;
6. study the atmospheres, ionospheres, and extended gas clouds of the Galilean satellites; 7. study the interaction of the Jovian magnetosphere with the Galilean satellites;
8. characterize the vector magnetic field and the energy spectra, composition, and angular distribution of energetic particles and plasma to a distance of 150 Rj.
(NASA, 2008)
To do this the spacecraft had a suit of state of the art instruments. Namely:
Solid State Imager (SSI) – CCD camera, sensitive to wavelengths ranging from 0.4 to 1.1 micrometres.
Near-Infrared Mapping spectrometer (NIMS) – imaging spectrometer sensitive to wavelengths ranging from 0.7 to 5.2 µm.
Photopolarimeter-Radiometer (PPR) – Photo polarimeter and radiometer. The radiometer covered from 17 to 100 µm.
Dust Detector Subsytem (DDS) – Dust detector that could measure the mass, electric charge and velocity of incoming particles.
Energetic Particles Detector (EPD) – ions and electrons detector. Heavy Ion Counter (HIC) – heavy ions detector
Magnetometer (MAG) –to measure Jupiter’s magnetic field. Plasma Subsystem (PLS) – Charged particle detector
Plasma Wave Subsystem (PWS) – to measure the plasma electric field
2.3 Near Infrared Spectra Analysis
5
different wavelengths, hence different altitudes. But also each pixel contained a spectrum that could be analysed for extraction of elemental composition of the clouds.
My work was focused in spectral analysis. As an introductory work it was in a large part being acquainted to the planetary science subject, tools and methodologies.
I first started by getting to know the data, how it was stored, that is to say my first contact with the Planetary Data System. I learned that the IDL software was being used as the language to read and analyse the data, together with FORTRAN. This gave me the first experience of using computer science in data analysis.
The NIMS data that I was using can be seen in Figure 2. In the data we could see clearly the cloud context where the spectral data points were coming from.
Figure 2 - NIMS data. On top the imaging capabilities, in this case at 5 µm. And on the bottom the
spectrometer capabilities (credit NASA)
6
Radiative transfer equation (Chandrasekhar, 1960) - Iν is the intensity, Iνis the source function, kν is
the mass absorption coefficient and ρ is the density of the material
The radiative transfer equation had already been modelled in FORTRAN and IDL previous to my arrival. The objective of my study was to apply small changes to the composition of the clouds either by modifying the percentages of certain components or finding new ones to better fit the model to the acquired spectra.
The original work was related to the water content in the clouds. Figure 3 shows that the model works quite well.
Figure 3 - Model fitting of NIMS data for different water contents (Roos-Serote, et al., 2000)
However, a particular difficult region was the one before 4.4 µm. In most cases as it can be seen in Figure 4, the spectra from NIMS are flat before 4.5 µm. Nevertheless, in some cases,
7
as it can be seen in the “JAILBAR” spectrum of Figure 2, there’s a distinct signature around 4.3 µm. My analysis corresponded to this particular area.
I played with the model changing parameters in order to try to reproduce this feature. I did it using IDL routines created for this purpose as well as FORTRAN routines used in the radiative transfer modelling.
Figure 4 - NIMS spectrum (solid line) from 4 µm to 5.2 µm (Roos-Serote, Pimentão, & Vicente, 2005)
9
3. SMART-1
3.1 Introduction
After being introduced and captivated by the planetary sciences with the Galileo Project, my next job was in the SMART-1 (Small Missions for Advance in Research and Technology), in a less scientific position, with a mix of science and engineering in my tasks. I spent more than 6 years working on this project, from before the spacecraft was even in space to its very end, with a final crash on the Moon.
I started in the mission working with the Project Scientist, Dr. Bernard Foing. My initial task was to do the analysis for the future mission, and to try to find out what science could be achieved with the spacecraft limitations. Afterwards I joined the SMART-1 Science and Technology Operations Centre (STOC), where I helped defining the Science Ground Segment. Here I learned a lot of System Engineering.
Finally, once the system was in place (it was, nevertheless, in continuous development throughout the mission) I worked in all aspects of putting the science operations in place, from deciding where to point the spacecraft, to consolidate the instrument commanding and making it ready to be sent to the spacecraft.
Since this was such a rich and long experience, in this chapter I will describe the aspects where I was involved together with what was my involvement to make it easier to read.
3.2 The Mission
SMART-1 (Small Missions for Advance in Research and Technology) was the first mission of its type. Its main objective was to test new technologies for usage in future, more ambitious missions.
The primary goal of the mission was to test an electric propulsion engine, never used before in
10
Figure 5 - SMART-1 cruise phase (credit ESA)
Once the spacecraft arrived to the Moon, the engine was used to insert the spacecraft into orbit (Figure 6), and to arrive at the final science orbit of 300 km x 3000 km.
Figure 6 - SMART-1 orbit insertion and spiral down (credit ESA)
SMART-1 was very modest in the amount of payload it carried, mainly because of the weight budget. The scientific experiments on board were:
11
KaTE and RSIS. Small changes in SMART-1's motion will reveal the precise drive delivered by the ion engine. Similarly to police radars used to catch speeding motorists, RSIS will employ the Doppler Effect to see how the speed alters the wavelength of radio pulses. It will use the very short radio waves of KaTE. The primary purpose of KaTE is to demonstrate the next generation of radio links between the Earth and far-flung spacecraft. Microwaves of the Ka band, around 9 millimetres in wavelength, can be focused into relatively narrow beams by the small dish antennas available on spacecraft.
Laser Link is another communications experiment. ESA already has laser links with telecom satellites from an optical ground station on Tenerife in Spain's Canary Islands. Aiming the beam becomes much more difficult if, like SMART-1, the spacecraft is far away and moving rapidly. The hope is that the on-board camera AMIE will see Tenerife illuminated with laser light.
OBAN. Future spacecraft will be more self-reliant in guiding themselves along predefined paths towards distant destinations. OBAN will evaluate a computer technique for on-board autonomous navigation. It will use the bearings of stars seen by SMART-1's star trackers, and the Earth, Moon and possibly asteroids seen by the AMIE camera.
Observing the Moon and the Sun
AMIE, SIR and D-CIXS. Different kinds of visible and invisible light coming from the lunar surface will provide clues about its chemical composition and geological history. The ultra-compact electronic camera, AMIE, will survey the terrain using visible and near-infrared light. An infrared spectrometer, SIR, will chart the Moon's minerals. An X-ray spectrometer, D-CIXS, will identify key chemical elements in the lunar surface.
XSM. The D-CIXS measurements can be confusing because of variations in solar X-ray emissions, which depend on how stormy the Sun is on that day. For this reason, SMART-1 monitors the solar X-rays with its XSM instrument. XSM will also make its own independent study of solar variability.
12
RSIS. Using the KaTE microwave system and the AMIE camera, the RSIS radio experiment will demonstrate a new way of measuring the rotations of planets and their moons. It should be able to detect a well-known nodding of the Moon, which slightly tilts first its north pole and then its south pole, towards the Earth.” (ESA, SMART-1, 2006)
3.3 Science Planning
Planetary missions, given their nature of usually being done in a distant location, when compared to Earth bound probes, have their planning or at least a major part of it done a long time in advance.
In particular, in ESA’s planetary missions they are usually divided in three stages: the first stage is done a very long time in advance and establishes the general goals for what is usually called mission phases, or seasons; the second stage more details are put for one of this phases; finally, on the third stage all details are given, shortly before the actual operations.
Figure 7 - General concept of Planetary Missions Science Operations Planning and its different
components (Koschny, et al., 2004)
These stages are named, Long Term Planning, Medium Term Planning and Short Term Planning.
In SMART-1, I was involved in all parts of the process. In this section I will be describing my work done in the Long Term Planning, as this is the part where science planning is really
Observation Measurement Detailed Science Objective “Scenarios” Orbit types Operational constraints Trajectory Science Operations
Top-level science goals
quantifiable
Physical parameters
Environment Science
13
done. In the Science operations section I will describe the work done in the Medium Term Planning and the Short Term Planning as it is more technical. An overview of the components involved can be found later in Figure 14 where it’s explained in more detail.
When I first joined SMART-1 as an intern I was working with Dr. Bernanrd Foing, the Project Scientist of the SMART-1 mission. After getting acquainted with the spacecraft, the mission objectives and how the planetary missions were working at the time, my task was to help him set up scenarios for the SMART-1 operations.
This was my first contact with the engineering part of a planetary mission. I had to learn how the spacecraft worked in general, and all its constraints. I also had to recall and make use of what I learned about orbital mechanics and expand that knowledge to more practical terms. On the payload side I had to learn how each instrument was operated.
After having all this information the objective was to create realistic scenarios for the mission. In the case of SMART-1 at this point in time it was thought that the main constraint was the data bus in the spacecraft, as it was of only capable of transmitting at 50 Kbits/second (with margins) and the main payloads had very little local storage, so they would need to send all data directly to the spacecraft mass memory device.
14
Figure 8 - The Project Test Bed (PTB) 3D simulation environment with the spacecraft in Moon orbit,
and the Earth and the Moon in background (not to scale) (Almeida, Foing, Heather, Marini, Lumb, &
Racca, 2002)
The Experiment Planning System (EPS) is an attitude and telecommand aggregator that is used to put together spacecraft timelines of both pointing and commanding (Figure 9). With the Experiment Planning System it is also possible to check the command syntax and timeline consistency. It can also use events generated by the Project Test Bed (PTB) like periapsis passages or different altitudes.
Figure 9 - Simple schematics of the Experiment Planning System (Almeida, Foing, & Heather, 2002)
15
One of the studies I did during this period as an example was the ability of SMART-1 to produce global maps of the Moon with the AMIE camera given the spacecraft constraints (Almeida, Foing, Heather, Marini, Lumb, & Racca, SMART-1 Science Experiments Co-Ordination and Expected Outputs, 2002). With the Project Test Bed (PTB) I was able to plot the quantities interesting for my study, like spacecraft altitude or spacecraft velocity. Using the Experiment Planning System (EPS) for simulating the constraints I was able to produce plots like the one in Figure 10 and Figure 11.
Figure 10 - Prediction of AMIE continuous coverage capabilities at perilune (Almeida, Foing, Heather,
Marini, Lumb, & Racca, 2002)
Figure 11 - Prediction of AMIE continuous coverage capabilities above 500 km (Almeida, Foing,
Heather, Marini, Lumb, & Racca, 2002)
This type of analysis was very preliminary, and in the meantime a lot of the conditions changed before the Moon arrival. A valuable lesson can be learned from this: no matter how many plans one does, in this line of business where we cannot fix or replace parts of the instrument and the object of discovery can be very different from what was predicted, there must always be scope for adaptation.
16
With the knowledge gained in these first years at work, I was ready for the next step. This was the development of a science planning system for SMART-1, and a science plan.
On the science planning side I was deeply involved in the Long Term Planning of the mission. Together with the Project Scientist, the Science Operations team developed what is called the Science Activity Plan (SAP). This document describes all the mission phases, the environment conditions at each of them and what are the science goals to be achieved. My involvement here was related to the performance of all the geometrical condition analysis, where a deep knowledge of planetary geometry was needed. This was achieved using yet another tool, named SPICE. SPICE is a planetary data information system developed by the Navigation and Ancillary Information Facility division of the NASA´s Jet Propulsion Laboratory. In my case I used it inside IDL, where it provides a number of functions that can calculate any solar system quantity at a given time, as all types of vectors from any solar system body to any other solar system body, or even stars, illumination conditions or any other thing that one can imagine in the solar system.
I was also identifying in the real world conditions the desires expressed by the Principal Investigators of the instruments and the Project Scientist, in a sort of translation between science objectives and measurement conditions. The Science Activity Plan was summarised in a poster, inspired in a similar poster produced for the Venus Express Mission (Figure 12).
17
One thing that was very interesting in this mission, but at the same time posed a lot of stress was that, given the small development time, most of the planning system was being developed throughout the mission. So, despite the fact that the complete process was already in place when SMART-1 arrived at the Moon, many of its components were developed while the spacecraft was already orbiting the Moon. During the mission we moved from very manual processes to much automatized ones.
One of the most important projects developed in the automation process was called Science Operations Planning System (SOPS). This tool that was born from the requirements set from planetary missions, namely planning operations around events. This was the tool that could link the science planning activities to the science operations activities. Being one of the main players in the setting up of the requirements of this tool, as part of the SMART-1 Science Ground Segment System, this was one of my main contributions to the SMART-1 mission. The SOPS tool was the congregator of all the tools that were described so far. It was using the Project Test Bed (PTB) capabilities in identifying events, and a database of the measurements and operational types requested by the Principal Investigators, to come up with a humane readable list of opportunities that could be selected to be executed (Figure 13).
18
3.4 Science Operations
In this section I will describe both what were the processes regarding the engineering part of the science planning as well my involvement in them. As previously stated, the planning process is divided in Long Term Plan (LTP), Medium Term Plan (MTP) and Short Term Plan (STP). The aspects regarding the Long Term Plan were described in the preceding section, as once the Science Activity Plan (SAP) is laid; the Long Term Plan is finished.
In fact, the Science Activity Plan is the foundation of the Medium Term Planning, and where the actual operational activities start.
In the SMART-1 Medium Term Planning a week of operations was planned, of activities that would be executed one month after. This is not the usual cycle, as it will be seen in Venus Express chapter but given the high level of uncertainty of the SMART-1 orbit, the orbital products from the Flight Dynamics group was only available on that time frame (Almeida, et al., 2006).
The SMART-1 planning process can be seen in Figure 14.
Figure 14 - SMART- 1 planning cycle (Almeida, et al., 2006)
19
Long Term Plan. This would freeze the spacecraft attitude for a given period of time. In this process I was heavily involved in the beginning of the lunar mission, but as the complexity of the operations increased my focus started to go to the camera where the work done was more focused on the science objectives. Nevertheless all the pointings done by the camera were decided and done by me.
After that the SMART-1 Science and Technology Operations Centre would consolidate the pointing inputs from all the experiment teams and send it to the Mission Operations Centre (MOC) to check that it would work on the spacecraft. Once the go ahead was given, the work on the command timelines (ITLs) would start. This led the planning cycle into its Short Term Plan, where all the details of the instrument operations were given, and sent to the spacecraft.
Again in this stage of the process I worked in all of its aspects at some point during the mission, but once again as for the spacecraft pointing, I became more specialised in the AMIE camera.
In the AMIE camera, regarding the Pointing Requests I was responsible for the attitude information necessary to conduct the science experiments. This involved a high level of knowledge of the geometries, as well as the science objectives. Regarding the commanding, I was producing the experiment timelines. For this, also the conditions of imaging are necessary to be known. As the camera was a frame grabber, the illumination conditions at the Moon were of fundamental importance, but also the speed and altitude at which image would be taken. To be able to better conduct this part of the work I created software to calculate the illumination conditions at a scene and decided what would be the better exposure times to acquire the data.
I was also using a piece of software called MAPPS to be able to calculate image overlapping factors. I will dwell more on MAPPS in the next chapter as this is the main tool used in Venus Express.
Finally in both science operations and science planning in the role of system engineer I had to define the processes and flows previously described. And many interface documents and infrastructure documents of the SMART-1 Science Ground Segment were done by me.
3.5 Data Handling
20
data handling. He proposed we could work together in the calibration of the camera, proposal that I accepted swiftly.
The AMIE camera had a 1024 x 1024 CCD array, with a very innovative filter mount in order to avoid moving parts and save on the weight as the mission budget on that respect was very limited.
(8)
Figure 15 - AMIE glass substract with different filters (Almeida, Koschny, & Grieger, 2008)
21
linearity of the dark current of the AMIE CCD at 293 K. There was a lack of linearity at low exposure times due to the CCD bias that was also described in the report.
Figure 16 - AMIE dark current behaviour measured in the lab (Koschny, Almeida, & Beauvivre, 2003)
My second task, after knowing the camera in detail, was to produce a calibration pipeline that would transform the raw data in science ready calibrated data. This calibration pipeline was an automatic processor that based on metadata contained in the image would select the best dark current data and flat fields to correct the data. It would also discard the bad pixels identified in the characterization process.
R² = 0,9999
0 20 40 60 80 100 120 140 160
0 1000 2000 3000 4000 5000 6000 7000 8000 9000
DN
Integration time in ms
22
Figure 17 - AMIE pipeline schematics (Almeida, 2003)
Finally, regarding my work in the more technical aspects of the AMIE camera, I was in charge of the Experiment to Archive Interface Control Document (EAICD). This document is the most important document for the data archival as it describes all the data set, how is it accessed and how is it used. Without this document the community using a dataset has very few possibilities to be able to analyse the data. The ESA archive complies with the Planetary Data System (PDS) standard, so to make this document I had to be familiarised with the standard. As part of the document also the metadata of the images is defined, so one of the important tasks to make the data accessible was to define the metadata and populate it during the calibration process.
23
Figure 18 - The same region captured with different filters during push broom (Almeida, et al., 2006)
The data acquired this way is what is called a data cube, as it has the usual two spatial dimensions and a third dimension that give us a spectrum for each pixel of the overlapping region. One example of such spectrum can be seen in Figure 19. The selected wavelengths
give access to the elemental composition of the region as it been demonstrated by previous works on lunar data (Figure 20).
0.95 0.96 0.97 0.98 0.99 1
700 750 800 850 900 950 1000
Wavelenght (nm) W a v e le ng ht ( nm )/ 7 5 0 nm
24
Figure 20 - Rock identification parameters (Pieters, Head, Gaddis, Jolliff, & Duke, 2001)
This is on-going work, but preliminary results were already presented for the South Pole Aitken basin in COSPAR 2008 (Cerroni, et al., 2008) .
Figure 21 and Figure 22 show the results presented at this occasion.
25
Figure 22 - New data from the mysterious South Pole Aitken basin. The deepest impact crater known in
the Solar System (Cerroni, et al., 2008)
The final goal is to produce data cubes of all the regions imaged in such way. Figure 23 shows the regions selected.
Figure 23 - Locations selected for color imaging
3.6 Student Projects
26
Angel Vilar – This student worked with me before the launch of SMART-1, the goal of his work was to produce simulated data for the AMIE camera so that we could start having an idea of what kind of exposures and geometrical parameters for the observations would be needed. Having this, it was possible to have a very good idea of the behaviour of the camera when we arrived at the Moon, and the onsite calibration activities could be greatly reduced. His work was then presented at the 36th ESLAB symposium (Vilar, Almeida, Koschny, & Foing, 2002).
Sophie Couturier-Doux – She worked with me in the testing of the calibration pipeline described before. She produced test data to test the software and the test report.
27
4. Venus Express/VMC
4.1 Introduction
The SMART-1 mission finished once the spacecraft run out of fuel, and its orbit, made unstable by the various forces at play, eventually intersected with the lunar surface. So without spacecraft I had to move on to new projects.
Available at the time was a very attractive position in the Venus Express Project, as Liaison Scientist for one of its instruments, the Venus Monitoring Camera (VMC). This position was to make the interface between the experiment team and the Science Operations Centre work better. It was, in many aspects, similar to my tasks already carried in SMART-1 for the AMIE camera.
My extensive experience in Planetary Sciences at that moment, more than six years, and my acquaintance of the tasks that would be before me, helped me to get it.
As the project had already been running for more than a year when I joined it, the way it started was different from SMART-1, which I joined before launch. In Venus Express there was already a system in place that I was expected to be able to improve in a very specific area.
The most challenging aspect of it was to be able to keep happy the Science Operations Team, that although formally I was a part of, in practice, especially at the beginning I was as well seen as an external entity. And at the same time keep the VMC team happy, as my job was with them. Being two different teams in a project, it should be obvious, that even though the goal should be the same, the way it was done and the priorities are not always aligned for the different parts of the project. So, in a way, my job was like one of a technical diplomat. I had to come up with engineering and science solutions that satisfied all parties involved.
After getting that smoothed out (that took around one year) I went on to try to improve the processes being used within the VMC team. Although I had started with it from day one, it was only at this point that I could devote more time to it.
28
area was the study of how a possible aero-braking campaign done by Venus Express would affect Science Operations.
4.2 The Mission
Venus Express as the name denounces it is an unmanned science probe orbiting around Venus. This was a mission of opportunity, as ESA, noticing they could do a much cheaper mission using the Rosetta and Mars Express legacy, including payload. The development time was extremely short in space terms and even otherwise and from the proposal to the launch there were only 4 years, as the spacecraft had to be ready for launch in 2005.
Venus was a planet long neglected in space exploration, and since 1989 there had not been a probe orbiting Venus. More so, the Magellan spacecraft only acquired radar data, making the Pioneer Venus Mission of 1978 the last Venus orbiter with an extended suit of instruments.
29
Figure 24 - Venus Express 24 hour orbit
Venus Express is mainly focused in the very thick Venus atmosphere with some surface science objectives. And its main scientific questions are:
“
What is the mechanism and what is the driving force of the super-rotation of the
atmosphere?
What are the basic processes in the general circulation of the atmosphere?
What is the composition and chemistry of the lower atmosphere and the clouds?
What is the past and present water balance in the atmosphere?
What is the role of the radiative balance and greenhouse effect in the past present and
future evolution of the planet?
Is there currently volcanic and/or tectonic activity on the planet?
”
Adapted from (ESA,Venus Express, 2010)
30 MAG: Magnetic Field Measurement
PFS: Atmospheric vertical sounding by infrared Fourier spectroscopy SPICAV: Atmospheric spectrometry by star or Sun occultation VeRA: Radio Sounding of Atmosphere
VIRTIS: Spectrographic mapping of atmosphere and surface VMC: Ultraviolet, infrared and visible imaging
In particular, the experiment I work on the VMC camera is a frame grabber, coincidently this instrument also captures different wavelengths in different parts of the CCD, but in a different way from SMART-1. There are four different optical elements focusing in a different part of the CCD (Figure 25).
Figure 25 - VMC camera and optics (credit MPS)
The filters are for Ultraviolet, that allows to follow the clouds easily as the Venus atmosphere as a UV absorber, Visible that allows VMC to see the O2 airglow on the Venus night side, and
31
Figure 26 - VMC data in UV on the top left, Visible in the top right, and infra red composite in fake
colour on the bottom (Credit ESA/MPS)
4.3 Liaison Scientist
My Venus Express involvement started in a different way from SMART-1, as my first six months in the project were in the Principal Investigator institute. This was done so that I could win their trust as fast as possible since the mission had already been running for six months in Venus. It was an interesting period as I had to prove my skills to the team, so being just part of the Venus Express project I had to demonstrate in a very short period of time that there was value added with my inclusion.
When I joined the team, they gave me the more basic tasks in the camera timeline development. During this stage I studied their processes in detail, and after about one month with the team I presented what could be improvements to the operations.
As the time passed and the trust increased I was given more responsibilities, and one of my assets was to be able to re-use tools that I’ve used before in AMIE in VMC. One of those tools was the exposure correction software that once it was implemented a lot of time was saved in the timeline development that I could use for improving the system.
32
Figure 27 - Venus Express Science Operations Planning Process (ESA internal document)
As liaison scientist for VMC, at current I’m working in all phases of the VMC operations. But
my responsibilities fall more into the Medium Term Planning (MTP) and Short Term Planning (STP). And the Medium Term Planning is what takes the bulk of my time.
The Venus Express Medium Term Planning contrary to SMART-1 takes one month (and one day).
“
- Week 1: MTP step#1 – MTP Science Preparation Meeting
- Evaluate the Baseline Plan against the latest information on observation conditions and requests of the experiment teams
- Week 2: MTP step#2 – MTP Kick-Off (Draft Pointing Request) meeting - Receive and merge draft pointing inputs from the Instrument teams - Week 3: MTP step#3 – MTP Final Pointing Request meeting
- Receive and merge final pointing inputs from the Instrument teams - Week 4: MTP step#4 – MTP Draft Timeline meeting
- Receive and merge draft Operations Inputs from Instrument teams
- (Week 5 or 1 for next MTP): Receive/merge final Operations Inputs from Intrument teams
33
The Science preparation meeting is the most important one, as the different payloads have different pointing requirements to conduct their experiments, in this meeting all orbits, for a period of a month are discussed. After this meeting all spacecraft attitude is defined for the planning period.
My role in this part of the planning is to: first discuss the scientific merits of the VMC proposed observations. The VMC Principal Investigator has of course the final say, but a lot of the responsibility has been passed to me. After that, it is decided that I go on to prepare the actual observations. This is done by actual defining the spacecraft attitude taking into consideration Venus, the Sun, and of course the VMC objectives. One example of such pointing definition can be found in Figure 28.
Figure 28 - VMC spot pointing
Because of the complexity of defining all the attitudes that will have to fit perfectly and respect all the spacecraft constraints, only at step 3 of the planning cycle the pointing is frozen, as it requires multiple iterations to get everything correct. Once this is finished, the commands are defined, and in this case, except for the data volume handling, there are few conflicts to avoid. In this stage the data acquisition modes are all set.
34
When the process is finalised, we are still two months before the execution of the first command on the spacecraft. And in the short term plan there is still time to do small modifications.
In the case of VMC this is also my responsibility. At this stage we use the exposure correction software previously described. And, as new information may have arrived in the two months between the finalisation of the plan and the actual execution small corrections may need to be applied, so all the plan is reviewed to catch any issue that may still exist. One important fact worth mentioning regarding the Short term planning and my involvement is that the complete process to execute it was defined by me.
4.4 Long Term Planning
As stated in the introduction, in Venus Express other than minor inputs from the VMC point of view, I had little involvement in the Long Term Planning, when I first joined the mission at the end of 2006.
This has recently changed, and in the last two years I have been involved in some of the studies regarding changes to the current baseline plan of Venus Express.
The first one was more than a study as it went on to the implementation phase. This was the collaboration that Venus Express prepared to have with the Japanese Akatsuki spacecraft. Co-ordination of different spacecraft is not new, although it happens a lot less than one may think, even when they are from the same agency. But when this happens is always ad-hoc co-ordination normally of very special events.
The novelty of what we were trying in Venus Express was that we wanted to have the co-ordination as part of the routine operations, without increasing the complexity of the operations.
35
Figure 29 - Venux Express/Akatsuki coordinated observations. Continuous monitoring of the cloud
motion (ESA internal document)
The next step, once we knew that valuable experiments could be done together and both spacecraft teams were committed to it, would be to find a way to insert the planning of these activities in the planning cycle, without disrupting it. The observations described were in fact like a Science Activity Plan for the two spacecraft, so what we did was to insert one extra meeting with the Akatsuki team where we would identify in each Medium Term Planning opportunities to conduct experiments together. This had to be done in such a way that the current exploration programs of both spacecraft would not be compromised and ideally that an opportunity could be combined with something that was already part of the plan.
These activities took place just before the orbit insertion of Akatsuki, and many combined observations were planned. Unfortunately, Akatsuki failed the orbit insertion, and we do not have the demonstration that the exercise worked. However, the experience gained in cooperating at this level between different agencies with very distinct cultures was of tremendous value.
Finally, in the last year I have been studying another activity that would change the Venus Express Operations as we know them. The Venus Express Project was learning the possibility of using aero-braking in the Venus atmosphere to change the orbital period. This would be done with two objectives, to increase the life time of the mission as a lower apocentre orbit would be more stable, and with a shorter period, previously not available science objectives would become available. One such example is that if the orbit was twelve hours, we would be able to follow the same clouds for a longer period of time (the Venus cloud deck has one complete rotation in four days).
36
communication passes occur always at the same time (as one day on Earth is 24 hours). In a 18 hour orbit, for example, however this is not the case. Therefore, has the constraints were mainly studied for the part of the orbit available in the current orbital period of 24 hours, a lot of observations would be precluded to be done outside that window as they would violate the spacecraft engineering constraints, such as thermal rules.
Figure 30 - Communication passes in a 24 hour orbit and in one 18 hour orbit shown in MAPPS
The decision for a go/no-go for aerobraking is still pending, but the full analysis from the science operations point of view has been delivered.
4.5 Student Projects
Since joining the Venus Express project I have tutored two master thesis students. One of them was in a more generic subject of planning analysis, and the second was in a very specific planning tool for Venus Express and in particular VMC.
37
computation time like the partition of the time domain, in what is called the binary search. But even in this case the domain has to be searched second by second if we do not want to lose any roots. Thus, the study that we asked the student was to try to use Fourier Transforms
in the analysis of the “planetary science” functions and find ways to speed up the search
process.
The student finalised the study successfully and gave some hints in what directions can algorithms be developed with that purpose.
Marc Costa – His project was much more concrete than the one from Victor. As previously described we can use the MAPPS tool to simulate any pointing and commanding on the spacecraft. However, because so many parameters, other than the ones required to search for the best science observation are calculated, MAPPS tends to be slow. If we want to do multiple tests in order to get the optimal solution, and since we can be planning in excess of 60 observations per month, this can be unpractical from the time point of view, and sometimes compromises were needed.
The main goal of this project was to have a tool that could simulate in a few seconds any spacecraft attitude and give the relevant parameters to help the science and engineering decision, like the type of illumination at the target or the thermal conditions at the spacecraft. The tool, that was named VisuaOps, was successfully developed, and in fact many plots from this thesis come from it.
39
5. References
Almeida, M. (2003). AMIE Pipeline Software Specification Document. ESA.
Almeida, M., Foing, B., & Heather, D. (2002, January 14-16). Science Operations for ESA's SMART-1 Mission to the Moon. Berlin.
Almeida, M., Foing, B., Heather, D., Marini, A., Lumb, R., & Racca, G. (2002). SMART-1 Science Experiments Co-Ordination and Expected Outputs. Geophysical Research Abstracts, XXVII Genera\l Assembly of EGS. Nice.
Almeida, M., Frew, D., Foing, B., Koschny, D., Volp, J., Lumb, R., et al. (2002). SMART-1 Science Overview.
Almeida, M., Frew, D., Sarkarati, M., Volp, J., Bloem, F., Koschny, D., et al. (2006). ESA's SMART-1 Science Planning Concept and its Evolution throughout the Mission. Proceedings of the Spaceops Conference. Rome.
Almeida, M., Koschny, D., & Grieger, B. (2008). AMIE to Planetary Science Archive Interface Control Document. Retrieved from PSA: ftp://psa.esac.esa.int/pub/mirror/SMALL- MISSIONS-FOR-ADVANCED-RESEARCH-AND-TECHNOLOGY/AMIE/S1-L-X-AMIE-2-EDR-EEP-V1.0/DOCUMENT/EAICD.PDF
Cerroni, P., Sanctis, M. C., Josset, J., Beauvivre, S., Grieger, B., Besse, S., et al. (2008). AMIE camera on SMART-1: colour information from selected lunar regions. Proceeding of the XXVII COSPAR Assembly. Montreal.
Chandrasekhar, S. (1960). Radiative Transfer. Dover Publications Inc.
ESA. (2006). SMART-1. Retrieved from ESA Science & Technology: http://smart.esa.int/science-e/www/object/index.cfm?fobjectid=31415
ESA. (2010). Venus Express. Retrieved from ESA Science & Technology: http://sci.esa.int/science-e/www/object/index.cfm?fobjectid=38850
Foing, B. H., Heather, D. J., & Almeida, M. (2000). The Science Goals Of Esa's Smart-1 Mission To The Moon. Earth, Moon and Planets, 523-531.
Koschny, D., Almeida, M., & Beauvivre, S. (2003). Calibration Report of the AMIE PFM. ESA. Koschny, D., Dhiri, V., Frew, D., Hoofs, R., Lumb, R., Schwehm, G., et al. (2004). Science
Operations for Planetary Missions in the European Space Agency. Proceedings of the Spaceops conference. Montreal.
NASA. (2008). http://nssdc.gsfc.nasa.gov/planetary/galileo.html#objective.
Pieters, C., Head, J., Gaddis, L., Jolliff, B., & Duke, M. (2001). Rock Types of the South Pole Aitken Basin. JGR.
Roos-Serote, M., Pimentão, J., & Vicente, S. (2005). The two upper cloud layers in the jovian atmosphere finally seen together. Bulletin of the American Astronomical Society, (p. 681). Roos-Serote, M., Vasavada, A. R., Kamp, L., Drossart, P., Irwin, P., Nixon, C., et al. (2000).
40
Vilar, E., Almeida, M., Koschny, D., & Foing, B. (2002). Lunar Data Simulation for SMART-1.
41
45
Relatório dos estágios da agência de Inovação no CERN, ESA e ESO
Pode ser encontrado na internet em:
http://www.adi.pt/estagiosinternacionaisppt/ResultsEN.pdf