Mathematical models of anaerobic
digestion for the treatment of swine effluents
1Daisa Stéfano Fagundes2, Marco Antonio Previdelli Orrico Junior2,
Ana Carolina Amorim Orrico2, Leonardo Oliveira Seno2
INTRODUCTION
The Brazilian pork industry, like other Brazilian agribusiness production chains, has grown significantly in recent years (ABIPECS 2013). However, it is considered an activity with high potential for pollution, because of the large volume
of effluents produced per area.
Swine manure effluents are composed of feces, urine, food waste, spilled water, hair and dust from the raising process (Orrico Junior et al.
ABSTRACT
RESUMO
2010). When effluents are mishandled, chemical
and microbiological contamination of soil and consequently of surface and groundwater may occur, in addition to air pollution by emissions of greenhouse gases (Dinuccio et al. 2008, Babson et al. 2013).
The anaerobic digestion process by implementa-tion of digesters can be considered an interesting process, because it promotes waste treatment and generates renewable energy that can return to the production system by converting chemical energy of biogas into electrical or thermal energy (Flesch et al. 2011).
1. Manuscript received in Jul./2014 and accepted for publication in Apr./2015 (http://dx.doi.org/10.1590/1983-40632015v4531052). 2. Universidade Federal da Grande Dourados (UFGD), Faculdade de Ciências Agrárias, Dourados, MS, Brasil.
Pig breeding results in the production of large amounts of waste, which can cause serious environmental problems, when handled incorrectly. This study aimed at testing mathematical models to estimate the parameters of anaerobic biodigestion in biodigesters as a function of the composition of swine effluents with and without separation of the solid fraction and hydraulic retention times (HRT). Semi-continuous biodigesters fed with swine effluents with and without separation of the solid fraction and managed for 15, 22, 29 and 36 days of hydraulic retention were used. The potential of biogas and methane production, as well as the reduction of total solids, volatile solids and chemical oxygen demand, were assessed as a function of the effluents composition. HRT was the variable that most influenced the variation of the models, followed by the contents of total and volatile solids. Uni and multivariate models presented high confidence indices, being classified as “great” at predicting the potentials of biogas and methane production and “good” at predicting the reductions of total solids, volatile solids and chemical oxygen demand. The models obtained in this study can be used to reliably predict the parameters of the anaerobic biodigestion process of swine effluents in semi-continuous tubular biodigesters.
KEY-WORDS: Methane; biodigester; biogas.
Modelos matemáticos da biodigestão
anaeróbia para o tratamento de efluentes de suínos
A suinocultura resulta na produção de grandes quantidades de resíduos, os quais, quando manuseados incorretamente, podem causar graves problemas ambientais. Este estudo objetivou testar modelos matemáticos para estimar os parâmetros de biodigestão anaeróbia em biodigestores, em função da variação da composição de efluentes de suinocultura com e sem separação da fração sólida e dos tempos de retenção hidráulica (TRH). Foram utilizados biodigestores semicontínuos, abastecidos com efluentes de suinocultura com e sem separação da fração sólida, manejados por 15, 22, 29 e 36 dias de retenção hidráulica. Foram avaliados os potenciais de produção de biogás e metano e as reduções de sólidos totais, sólidos voláteis e demandas químicas de oxigênio, em função da composição dos efluentes. O TRH foi a variável que teve maior influência na variação dos modelos, seguido dos teores de sólidos totais e voláteis. Os modelos uni e multivariados apresentaram elevados índices de confiança, sendo classificados como ótimos para predizer os potenciais de produção de biogás e metano e como bons para predizer as reduções de sólidos totais, sólidos voláteis e demanda química de oxigênio. Os modelos deste estudo podem ser utilizados para predizer com segurança os parâmetros do processo de biodigestão anaeróbia de efluentes de suinocultura, em biodigestores semicontínuos tubulares.
The potential of biogas and methane production
depends mainly on the composition of the effluent
(contents of essential nutrients and solids) and the time in which the material remains in the digester (hydraulic retention time - HRT). In general, the greater the amount of nutrients, the greater the HRT
required to stabilize the effluent.
Sieving the effluent is a way to improve the efficiency of the process, since it separates the highly
biodegradable liquid fraction from the solid fraction, which has slower degradation (Orrico Junior. et
al. 2010). Despite these benefits in the anaerobic
digestion process, many producers do not separate
the effluents, because the solid fraction retained on
the sieve must undergo additional slower treatment steps, such as composting, what often discourages the producer (Orrico Junior et al. 2009).
In the literature, most of the studies only quantify the volume of biogas produced by digesters supplied with swine effluent without considering the composition of the effluent and the HRT. The composition and digestion time affect biogas production (Herrero 2011), therefore, the development of mathematical models that take these factors into account to estimate the main parameters of the anaerobic digestion process can help to design digesters and predict their performance (Astals et al. 2013).
The present study aimed to test mathematical models to estimate the parameters of anaerobic digestion on biodigesters as a function of the variation of the composition of effluents from the pork industry, with and without separation of the solid fraction, and according to the hydraulic retention times (HRT).
MATERIAL AND METHODS
The experiment was conducted between March and September 2013, in Dourados, Mato Grosso do Sul State, Brazil, in a completely randomized design, following a 2 x 4 factorial scheme, with four replicates per treatment.
Data were obtained from semi-continuous
tubular digesters fed with swine effluent with and
without sieving, managed by 15, 22, 29 and 36 days of hydraulic retention. Some properties and nutrient
contents of the swine effluent used are shown on
Table 1.
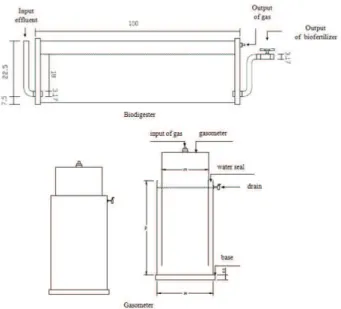
The laboratorial digesters consisted of two distinct parts: a container that holds the material for
fermentation (volume of 0.04 m3) and a gasometer
(Figure 1). The container was built with a PVC cylinder (300 mm of diameter and 1,000 mm in
length), with the two ends fixed with PVC plates of
15 mm thick. The inlet pipe for supplying the swine
effluent was fixed on one of the plates and, on the
other end, two pipes were connected, one for the output of biofertilizers and another for gas exhaustion. The gasometer was composed of two cylinders of 250 mm and 300 mm in diameter, which were inserted into each other, so that the space between the outer and inner cylinders would hold a volume of water
(“water seal”) with a depth of 500 mm. The cylinder of 300 mm in diameter was fixed to a 25 mm thick
PVC board. The 250 mm diameter cylinder had one end sealed with a cap that received the gas generated and the other end was overturned in the water seal to store the produced gas. The gasometers were placed on a bench under room temperature conditions and protected from sunlight and rain.
Biogas composition was determined using a Finigan GC-2001 gas chromatograph equipped with Porapack Q columns and molecular sieve and a thermal conductivity detector. The amount of total solids (TS), volatile solids (VS) and chemical oxygen demand (COD) were determined as described by APHA (2005).
The biogas and methane production was assessed, as well as the reductions in total solids, volatile solids and chemical oxygen demand. These data were analyzed with the R software (version 2.15.2 for Windows). The Shapiro Wilk test was used
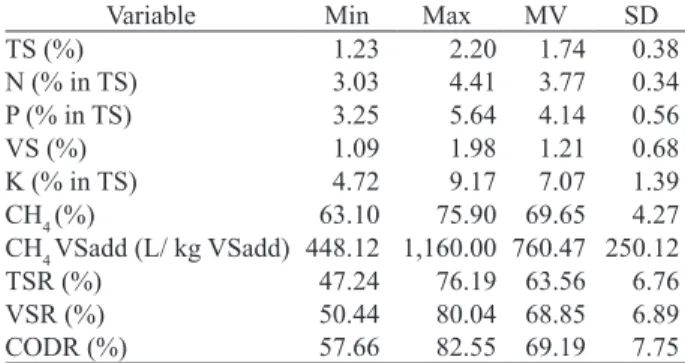
Table 1. Distribution of minimum (Min), maximum (Max), mean value (MV) and standard deviation (SD) of components of swine effluents (Dourados, Mato Grosso do Sul State, Brazil, 2013).
Variable Min Max MV SD
TS (%) 1.23 2.20 1.74 0.38
N (% in TS) 3.03 4.41 3.77 0.34
P (% in TS) 3.25 5.64 4.14 0.56
VS (%) 1.09 1.98 1.21 0.68
K (% in TS) 4.72 9.17 7.07 1.39
CH4 (%) 63.10 75.90 69.65 4.27
CH4 VSadd (L/ kg VSadd) 448.12 1,160.00 760.47 250.12
TSR (%) 47.24 76.19 63.56 6.76
VSR (%) 50.44 80.04 68.85 6.89
CODR (%) 57.66 82.55 69.19 7.75
TS = total solids; N = nitrogen; P = phosphorus; VS = volatile solids; K = potassium;
CH4 = % methane; CH4 VSadd = methane production per kg of added VS; TSR =
to verify the normality of residuals and the Bartlett test to verify the homogeneity of variances. The presence of outliers was also evaluated. All traits
studied satisfied the assumptions of the model.
After preliminary analysis, multiple regression
analysis between the levels of the effluent composition
(independent variables) and the characteristics of biogas production (dependent variables) were performed. The stepwise procedure of the stat package (R Development Core Team 2012) was used to indicate the independent variables that accounted for a large proportion of variability in the biogas production and composition. The selection of
models was based on the coefficient of determination
(R²), root mean square error (RMSE) and Akaike information criterion (AIC).
The quality of the proposed models was
assessed by using the concordance index “d” (Willmott et al. 1985) and the confidence index “c” (Camargo & Sentelhas 1997). The “c” index allows
interpretation for tests of accuracy, represented by the
“d” index. Precision is represented by the correlation coefficient, which is calculated from the ratio of
these two indices and ranges from great (> 0.85) to very good (0.76-0.85), good (0.66-0.75), medium (0.61-0.65), fair (0.51-0.60), poor (0.41-0.50) and
very poor (≤ 0.40).
The Spearman correlation (Agricolae package, version 1.1-4) was estimated to assess the association between the levels of the effluent composition (independent variables) and the characteristics
of biogas production, with a significance level of
95 %. Through correlation analysis it was possible to
identify the variables that most influenced the process
of anaerobic digestion which were selected to build the prediction models.
RESULTS AND DISCUSSION
The production of CH4 and CH4VSadd were
positively correlated (0.45 and 0.47) with HRT (i.e., the higher retention time of the material in the digester was essential to maximize the production of biogas and methane) (Table 2). The same was observed for TSR (0.39), VSR (0.40) and CODR (0.71).
Orrico Junior etal. (2010), using digesters fed with wastes from fully grown pigs,observed greater
Figure 1. Scheme of semi-continuous digesters and gasometers.
HRT = hydraulic retention times; TS = total solids; N = nitrogen; P = phosphorus; VS = volatile solids; K = potassium; CH4 = % methane; CH4sva = added volatile
solids methane; TSR = total solids reduction; VSR = volatile solids reduction; CODR = chemical oxygen demand reduction; ns = non-significant; * p < 0.05; ** p < 0.01; *** p < 0.001.
Variable HRT TS N P VS K CH4 CH4sva TSR VSR CODR
HRT - ns ns ns ns ns 0.45** 0.47** 0.39* 0.40* 0.71***
TS - - 0.65*** 0.67*** 0.92*** -0.42* -0.77*** -0.75*** 0.56*** 0.37* 0.56***
N - - - 0.52** 0.77*** ns -0.60*** 0.55** ns ns ns
P - - - - 0.79*** ns -0.79*** -0.80*** ns ns ns
VS - - - ns -0.78*** -0.75*** 0.49* ns 0.50**
K - - - 0.36* 0.40* ns ns ns
CH4 - - - 0.98*** ns ns ns
CH4sva - - - ns ns ns
TSR - - - 0.96*** 0.61**
VSR - - - 0.48**
CODR - - -
reductionsofTS(29 % and44 %), VS(31 % and45 %),
COD(45 % and61 %) and BOD(45 % and60 %) with increasing HRT(30, 60, 90 and 120 days). The CH4 productionalso increasedasmanureremainedlonger in thedigester(39 % and82 %).
Durand et al. (1986) observed high correlation between the results obtained from experimental analyses and those generated from prediction models, with only 6 % of divergence for methane production in continuous-feed digesters with 15 days of hydraulic retention. The authors also reported that the methane production peaks varied in 6 hours between observed and estimated results, while the maximum rate of VS was 4 % superior on the results of the MI prediction model.
The analysis of univariate models indicated
that the HRT and P had a significant effect (p= 0.05) on methane (Table 3). The results of R2, RMSE and
AIC were respectively 0.91, 0.59 and 12.74 for HRT and 0.34, 57.11 and 133.44 for P. The univariate model that showed the best performance in the
estimation of methane content was HRT, with a R2
of 0.91. The multivariate linear regression obtained through stepwise (CH4 = 0.91 * HRT + 0.02 * VS +
0.02 * TS) had a higher R2 (0.94), highlighting HRT,
TS and VS as the best variables to predict methane content. The only variable that contributed to the high
R2 was HRT, explaining the changes of the methane
(CH4) levels.
Methanogenesis is the final stage of the anaerobic digestion process, so the higher HRT results in higher CH4 content in the biogas. Fdez-Güelfo et
al. (2011) studied the influence of particle size and
organic matter content of municipal solid waste, using semi-continuous digester with two types of composting residues (synthetic and industrial), and
observed that the longer the effluent remains in the
digester the greater is the production of methane. As stated by Durand et al. (1986), the highest correlations of methane production from swine manure in continuous-feed digesters occurred with HRT, organic loading rate (concentration of volatile solids) and temperature. However, according to these authors, the inclusion of volatile solids was most correlated (0.87) to methane concentration in the biogas, when compared with TRH and temperature,
and the most beneficial levels of VS for the process
ranged between 60 g and 96 g VS per liter of substrate, a condition that also enhanced microbial growth.
The significant univariate models for the
potential production of methane (CH4VSadd) were
the HRT, N and P. HRT showed high R2 (0.89)
and lower RMSE (23.68) and AIC (105.27), when compared to N and P.
R2 = coefficient of multiple determination; RMSE = root mean square error; AIC = Akaike information criterion; p = F partial; index d = concordance index; r = correlation
index; index c = confidence index; HRT = hydraulic retention times; TS = total solids; N = nitrogen; P = phosphorus; VS = volatile solids; K = potassium; CH4 = %
methane; CH4 VSadd = methane production per kg of added VS; CODR = chemical oxygen demand reduction.
Model R² RMSE AIC p Index d r Index c Performance
Univariate
CH4 = 59.80 + 0.24 * HRT 0.91 0.59 12.74 < 0.001 0.98 0.96 0.93 Great
CH4 = 67.10 - 0.62 * TS 0.00 2.01 24.39 0.121 0.06 0.05 0.00 Very poor
CH4 = 68.36 - 0.64 * N 0.01 2.00 24.39 0.151 0.10 0.09 0.01 Very poor
CH4 = 77.69 - 2.61 * P 0.35 1.62 19.44 0.010 0.70 0.59 0.42 Poor
CH4 = 67.10 - 0.69 * VS 0.00 2.01 26.35 0.232 0.06 0.05 0.00 Very poor
CH4 = 68.91 - 0.48 * K 0.06 1.95 25.37 0,213 0.35 0.25 0.09 Very poor
Multivariate
CH4 = 57.62 + 0.24 * HRT + 7590.12 * TS - 8443.02 * VS 0.94 0.50 23.80 < 0.001 0.98 0.97 0.95 Great
Univariate
CH4 VSadd = 327.81 + 8.46 * HRT 0.89 23.68 105.27 < 0.001 0.97 0.94 0.91 Great CH4 VSadd = 556.02 - 6.06 * TS 0.00 70.30 138.09 0.198 0.02 0.01 0.00 Very poor CH4 VSadd = 582.54 - 9.87 * N 0.00 70.25 138.09 0.291 0.01 0.04 0.00 Very poor CH4 VSadd = 951.40 - 89.64 * P 0.34 57.11 133.44 0.050 0.01 0.58 0.00 Very poor CH4 VSadd = 556.04 - 6.69 * VS 0.00 70.30 138.09 0.346 0.02 0.01 0.00 Very poor CH4 VSadd = 646.52 - 15.99 * K 0.05 68.33 138.09 0,289 0.34 0.23 0.08 Very poor
Multivariate
CH4 VSadd = 327.81 + 8.46*HRT 0.90 22.23 105.27 < 0.001 0.97 0.95 0.92 Great Table 3. Univariate and multivariate models to estimate methane content and potential of methane production of swine effluents
Although significant, the contribution of N
and P in the model was not enough to be included by the stepwise procedure in the multivariate model. Therefore, the best performance for predicting CH4 VSadd was observed with the univariate linear regression using HRT (CH4 VSadd = 327.81 + 8.46 * HRT), which presented the best values of R2, RMSE
and AIC.
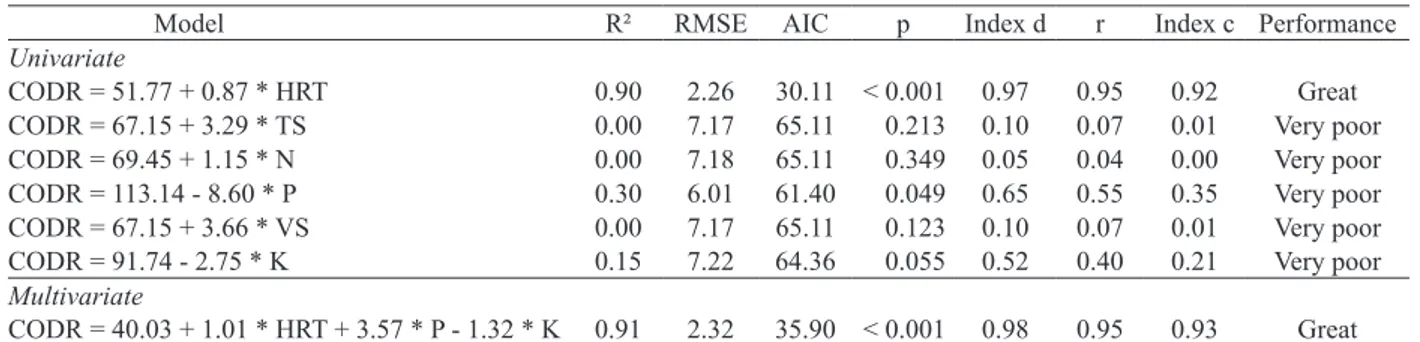
The univariate models for the reduction of
chemical oxygen demand presented as significant
variables (p = 0.05) the HRT and P. The values of
R2, RMSE and AIC were respectively 0.90, 2.26
and 30.31 for HRT and 0.30, 6.01 and 61.4 for P (Table 4). As a result, the univariate model with the best performance for estimating the reduction of chemical oxygen demand (COD) was the one with HRT, since it had a better R2 (0.90), when compared
to P. Multivariate linear regression presented better
results (CODR = 40.03 + 1.01 * HRT + 3.57 * P - 1.32 * K) for R2 (0.91), RMSE (2.32) and AIC (35.9).
Jianbin Guo et al. (2013) studied the effect of temperature on the concentration of biomass digesters and treatment with pig manure, using semi-continuous digesters, and observed that the biogas production increased with the reduction of COD. The concentration of COD in the waste indicates the amount
of organic matter in the effluent (Flotats et al. 2009).
Karmakar et al. (2010) reported that the reduction of organic material during digestion can be more affected by temperature and HRT than by the COD present on the digesting material. According to this, the conditions of the medium, when favorable to the degradation of organic matter, are more important
for the COD removal efficiency than the attempt to obtain effluents with lower concentrations of COD.
Effluents with lower COD are also less concentrated and, consequently, decrease the biodigestion efficiency.
Table 5 presents data from the analysis of univariate and multivariate regression with methane production for the solid fraction separation (SFS)
of the effluent. The CH4 production showed a
significant univariate model (p < 0.05) for HRT and
N, respectively with R2, RMSE and AIC of 0.83,
0.56 and 14.45 and 0.29, 1.14 and 8.44. So, the HRT univariate model performed better in the estimation
of methane content from SFS effluent. The best
prediction ability was found for the multivariate linear regression (CH4 = 73.58 + 0.14 * HRT - 1.06 * N),
respectively with values of R2, RMSE and AIC of
0.88, 0.47 and 16.15.
Fdez-Güelfo et al. (2011) studied the influence
of particle size of the organic matter using the organic fraction of municipal waste and synthetic waste. In both types of waste, they observed that univariate models with HRT presented the highest R2 (0.99).
Analysis of univariate and multivariate regression of potential methane production per kg
of VS added (CH4 VSadd) presented only the HRT
as a significant variable (p = 0.05). The significance
of this variable in the models is related to the HRT correlation with other variables. Therefore, only the HRT (0.92) had high R2 for predicting the production
of methane contents (CH4).
Fdez-Güelfo et al. (2011) studied two types of residues: one from organic fraction of municipal waste and other from synthetic waste. The two types of waste had univariate models in which the HRT showed the highest R2 (0.99). Karmakar et al. (2010)
pointed out that these conditions had more influence on the process than the specific characteristics of
CODR = chemical oxygen demand reduction; R2 = coefficient of multiple determination; RMSE = root mean square error; AIC = Akaike information criterion; p = F
partial; index d = concordance index; r = correlation index; index c = confidence index; HRT = hydraulic retention times; TS = total solids; N = nitrogen; P = phosphorus;
VS = volatile solids; K = potassium.
Model R² RMSE AIC p Index d r Index c Performance
Univariate
CODR = 51.77 + 0.87 * HRT 0.90 2.26 30.11 < 0.001 0.97 0.95 0.92 Great
CODR = 67.15 + 3.29 * TS 0.00 7.17 65.11 0.213 0.10 0.07 0.01 Very poor
CODR = 69.45 + 1.15 * N 0.00 7.18 65.11 0.349 0.05 0.04 0.00 Very poor
CODR = 113.14 - 8.60 * P 0.30 6.01 61.40 0.049 0.65 0.55 0.35 Very poor
CODR = 67.15 + 3.66 * VS 0.00 7.17 65.11 0.123 0.10 0.07 0.01 Very poor
CODR = 91.74 - 2.75 * K 0.15 7.22 64.36 0.055 0.52 0.40 0.21 Very poor
Multivariate
CODR = 40.03 + 1.01 * HRT + 3.57 * P - 1.32 * K 0.91 2.32 35.90 < 0.001 0.98 0.95 0.93 Great Table 4. Univariate and multivariate models to estimate reductions of chemical oxygen demand from swine effluents with no solid
Table 5. Univariate and multivariate models to estimate methane content and potential of methane production from swine effluents with separation of solid fraction (Dourados, Mato Grosso do Sul State, Brazil, 2013).
Model R² RMSE AIC p Index d r Index c Performance
Univariate
CH4 = 69.44 + 0.16 * HRT 0.83 0.56 14.45 < 0.001 0.95 0.91 0.87 Great
CH4 = 73.39 + 0.07 * TS 0.00 1.36 13.92 0.143 0.01 0.01 0.00 Very poor
CH4 = 83.43 - 2.78 * N 0.29 1.14 8.44 0.040 0.64 0.54 0.34 Very poor
CH4 = 78.74 - 1.41 * P 0.08 1.31 11.92 0.087 0.36 0.28 0.10 Very poor
CH4 = 75.03 - 2.79 * VS 0.01 1.35 11.92 0.102 0.15 0.12 0.02 Very poor
CH4 = 73.00 + 0.06 * K 0.00 1.36 13.86 0.213 0.08 0.06 0.00 Very poor
Multivariate
CH4 = 73.58 + 0.14 * TRH - 1.06 * N 0.88 0.47 16.15 < 0.001 0.97 0.94 0.91 Great
Univariate
CH4 VSadd = 513.75 + 18.18 * HRT 0.91 43.29 124.57 < 0.001 0.98 0.96 0.93 Great CH4 VSadd = 1028.07 - 36.43 * TS 0.00 148.65 164.05 0.112 0.05 0.03 0.00 Very poor CH4 VSadd = 1450.72 - 123.63 * N 0.08 112.96 154.55 0.078 0.00 0.41 0.00 Very poor CH4 VSadd = 1182.18 - 38.05 * P 0.02 68.94 137.84 0,096 0.00 0.15 0.00 Very poor CH4 VSadd = 1009.70 + 54.62 * VS 0.00 69.67 139.08 0,127 0.08 0.04 0.00 Very poor CH4 VSadd = 986.42 + 6.94 * K 0.02 69.10 137.84 0,0945 0.21 0.14 0.03 Very poor
Multivariate
CH4 VSadd = 513.75 + 18.18 * HRT 0.92 40.58 124.57 < 0.001 0.98 0.96 0.94 Great
R2 = coefficient of multiple determination; RMSE = root mean square error; AIC = Akaike information criterion; p = F partial; index d = concordance index; r = correlation
index; index c = confidence index; CH4 = % methane; CH4 VSadd = methane production per kg of added VS; HRT = hydraulic retention times; TS = total solids; N =
nitrogen; P = phosphorus; VS = volatile solids; K = potassium.
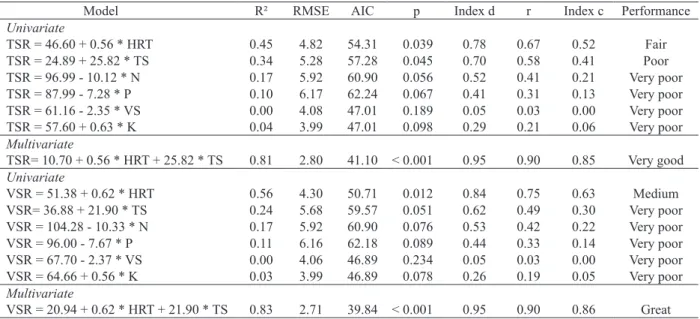
Table 6. Univariate and multivariate models to estimate reductions of total solid and volatile solid from swine effluents with solid fraction separation (Dourados, Mato Grosso do Sul State, Brazil, 2013).
Model R² RMSE AIC p Index d r Index c Performance
Univariate
TSR = 46.60 + 0.56 * HRT 0.45 4.82 54.31 0.039 0.78 0.67 0.52 Fair
TSR = 24.89 + 25.82 * TS 0.34 5.28 57.28 0.045 0.70 0.58 0.41 Poor
TSR = 96.99 - 10.12 * N 0.17 5.92 60.90 0.056 0.52 0.41 0.21 Very poor
TSR = 87.99 - 7.28 * P 0.10 6.17 62.24 0.067 0.41 0.31 0.13 Very poor
TSR = 61.16 - 2.35 * VS 0.00 4.08 47.01 0.189 0.05 0.03 0.00 Very poor
TSR = 57.60 + 0.63 * K 0.04 3.99 47.01 0.098 0.29 0.21 0.06 Very poor
Multivariate
TSR= 10.70 + 0.56 * HRT + 25.82 * TS 0.81 2.80 41.10 < 0.001 0.95 0.90 0.85 Very good
Univariate
VSR = 51.38 + 0.62 * HRT 0.56 4.30 50.71 0.012 0.84 0.75 0.63 Medium
VSR= 36.88 + 21.90 * TS 0.24 5.68 59.57 0.051 0.62 0.49 0.30 Very poor
VSR = 104.28 - 10.33 * N 0.17 5.92 60.90 0.076 0.53 0.42 0.22 Very poor
VSR = 96.00 - 7.67 * P 0.11 6.16 62.18 0.089 0.44 0.33 0.14 Very poor
VSR = 67.70 - 2.37 * VS 0.00 4.06 46.89 0.234 0.05 0.03 0.00 Very poor
VSR = 64.66 + 0.56 * K 0.03 3.99 46.89 0.078 0.26 0.19 0.05 Very poor
Multivariate
VSR = 20.94 + 0.62 * HRT + 21.90 * TS 0.83 2.71 39.84 < 0.001 0.95 0.90 0.86 Great
R2 = coefficient of multiple determination; RMSE = root mean square error; AIC = Akaike information criterion; p = F partial; index d = concordance index; r = correlation
index; index c = confidence index; TSR = total solids reduction; VSR = volatile solids reduction; HRT = hydraulic retention times; TS = total solids; N = nitrogen;
P = phosphorus; VS = volatile solids; K = potassium.
substrates in digestion and that the HRT would be determinant for greater degradation of organic matter and also to easily stabilize the conditions of the medium for the production of methane.
The analysis of the TS reduction through
HRT and TS were respectively 0.45 and 4.82, 54.41 and 0.34, and 5.28 and 57.28. The univariate model that showed the best performance in the estimation of methane content was the HRT, presenting a better R2 (0.45), when compared to the TS (0.34).
Multivariate linear regression (TSR = 10.70 + 0.56 * HRT + 25.82 * TS) presented R2, RMSE and AIC
of 0.81, 2.80 and 41.1, respectively. There was no correlation between TS and HRT (Table 2).
The univariate models obtained for the reduction of SV presented significant effect
(p < 0.05) only for the variables HRT and TS. The R2,
RMSE and AIC for HRT and TS were respectively 0.56 and 4.30, 50.71 and 0.24, and 5.68 and 59.57 (Table 6). The univariate model that showed the best performance in estimating the reduction in VS
was HRT, which had a higher R2, when compared
to TS. For multivariate linear regression (VSR =
20.94 + 0.62 * HRT + 21.90 * TS), better results
were obtained for R2 (0.83), RMSE (2.71) and AIC
(39.84).
The analysis of the reduction of COD through
the univariate models presented a significant effect (p < 0.05) for HRT and P (Table 7). The coefficient
of determination (R2), RMSE and AIC for HRT and
P were respectively 0.63 and 2.38, 31.82 and 0.42, and 2.37 and 31.66. In this way,the univariate model that performed better in estimating the reduction of chemical oxygen demand was the HRT, that had a
higher R2, when compared to P. The multivariate
linear regression (CODR = 56.43 + 0.38 * HRT + 7.85 * TS + 2.24 * N - 5.43 * P) presented R2, RMSE
and AIC of 0.89, 1.33 and 20.29, respectively. There
was significant correlation of P with ST and N, thus
only the less correlated variables were included
in the model. The HRT was the only variable that contributed to the high R2 for predicting changes of
COD reduction.
CONCLUSION
The models in this study can be used for the accurate prediction of the main parameters of swine wastewater anaerobic digestion with and without separation of the solid fraction process. HRT is the factor that most affects the process of anaerobic digestion, being responsible for most of the variation captured by the presented models.
REFERENCES
AMERICAN PUBLIC HEALTH ASSOCIATION (APHA). Standard methods for examination of water and wastewater. 21. ed. Washington, DC: American Water Works Association, 2005.
ASSOCIAÇÃO BRASILEIRA DA INDÚSTRIA PRODUTORA E EXPORTADORA DE CARNE SUÍNA (ABIPECS). Receita das exportações de carne suína caiu 8,3 % no 1º semestre. 2013. Disponível em: <http://www. abipecs.org.br/news/683/99/Receita-das-exportacoes-de-carne-suina-caiu-8-3-no-1-semestre.html>. Acesso em: 29 jul. 2013.
ASTALS, S. et al. Anaerobic digestion of seven different sewage sludges: a biodegradability and modeling study. Water Research, Delft, v. 47, n. 16, p. 257-262, 2013.
BABSON, D. M. et al. Anaerobic digestion for methane generation and ammonia reforming for hydrogen production: a thermodynamic energy balance of a model system to demonstrate net energy feasibility. Biomass and Bioenergy, Aberdeen, v. 56, n. 6, p. 493-505, 2013.
R2 = coefficient of multiple determination; RMSE = root mean square error; AIC = Akaike information criterion; p = F partial; index d = concordance index; r = correlation
index; index c = confidence index; CODR = chemical oxygen demand reduction; HRT = hydraulic retention times; TS = total solids; N = nitrogen; P = phosphorus;
VS = volatile solids; K = potassium.
Model R² RMSE AIC p Index d r Index c Performance
Univariate
CODR = 54.52 + 0.40 * HRT 0.63 2.38 31.82 0.001 0.87 0.80 0.70 Good
CODR = 51.86 + 9.28 * TS 0.12 3.70 45.91 0.089 0.45 0.34 0.15 Very poor
CODR = 84.17 - 5.42 * N 0.13 3.68 45.66 0.077 0.45 0.36 0.16 Very poor
CODR = 91.53 - 7.34 * P 0.42 2.37 31.66 0.045 0.78 0.65 0.51 Fair
CODR = 73.83 - 17.60 * VS 0.11 2.95 38.51 0.084 0.45 0.33 0.15 Very poor
CODR = 61.31 + 0.36 * K 0.02 3.09 38.51 0.098 0.23 0.16 0.03 Very poor
Multivariate
CODR = 56.43 + 0.38 * HRT + 7.85 * TS + 2.24 * N - 5.43 * P 0.89 1.33 20.29 < 0.001 0.97 0.94 0.91 Great Table 7. Univariate and multivariate models to estimate reductions of chemical oxygen demand from swine effluents with solid
CAMARGO, A. P; SENTELHAS, P. C. Avaliação do desempenho de diferentes métodos de estimativas da evapotranspiração potencial no Estado de São Paulo, Brasil. Revista Brasileira de Agrometeorologia, Santa Maria, v. 5, n. 1, p. 89-97, 1997.
DINUCCIO, E.; BERG, W.; BALSARI, P. Gaseous emissions from storage of untreated slurries and the fractions obtained after mechanical separation. Atmospheric Environment, Norwich, v. 42, n. 10, p. 2448-2459, 2008.
DURAND, J. H. et al. Modeling, simulating and optimizing the anaerobic digestion of swine manure. Biological Wastes, Trivandrum, v. 24, n. 1, p. 1-15, 1988.
FDEZ-GÜELFO, L. A. et al. Dry-thermophilic anaerobic digestion of organic fraction of municipal solid waste: methane production modeling. Waste Management, Padova,v. 32, n. 3, p. 382-388, 2011.
FLESCH, T. K.; DESJARDINS, R. L.; WORTH, D. Fugitive methane emissions from an agricultural biodigester. Biomass and Bioenergy, Aberdeen, v. 35, n. 9, p. 3927-3935, 2011.
FLOTATS, X. et al. Manure treatment technologies: on-farm versus centralized strategies. Bioresource
Technology, Trivandrum, v. 100, n. 22, p. 5519-5526,
2009.
HERRERO, J. M. Reduced hydraulic retention times in low-cost tubular digesters: two issues. Biomass and Bioenergy, Aberdeen, v. 35, n.10, p. 4481-4484, 2011.
JIABIM GUO et al. Kinetics evaluation of a semi-continuously fed anaerobic digester treating pig manure at two mesophilic temperatures. Waste Management, Padova, v. 47, n.15, p. 5743-5750, 2013.
KARMAKAR, S. et al. Development of expert system modeling based decision support system for swine manure management. Computers and Electronics in Agriculture, Amsterdam, v. 71, n. 1, p. 88-95, 2010.
ORRICO JUNIOR, M. A. P.; ORRICO, A. C. A.; LUCAS JÚNIOR, J. Compostagem da fração sólida da água residuária de suinocultura. Engenharia Agrícola, Jaboticabal, v. 29, n. 3, p. 483-491, 2009.
ORRICO JUNIOR. M. A. P.; ORRICO, A. C. A.; LUCAS JÚNIOR, J. Avaliação de parâmetros da biodigestão
anaeróbia de dejetos de suínos alimentados com dietas à
base de milho e sorgo. Engenharia Agrícola, Jaboticabal, v. 30, n. 7, p. 600-607, 2010.
R DEVELOPMENT CORE TEAM. R: a language and environment for statistical computing. Version 2.15.1. Vienna: R Foundation for Statistical Computing, 2012.