UNIVERSIDADE FEDERAL DE SÃO CARLOS
CENTRO DE CIÊNCIAS EXATAS E DE TECNOLOGIA
DEPARTAMENTO DE QUÍMICA
PROGRAMA DE PÓS-GRADUAÇÃO EM QUÍMICA
Materiais híbridos condutores baseados em
grafeno/polímero visando aplicações em monitoramento e
remediação de poluentes ambientais
Murilo Henrique Moreira Facure
*
Orientador: Dr. Daniel Souza Corrêa
*Bolsista: FAPESP
São Carlos, SP
2018
UNIVERSIDADE FEDERAL DE SÃO CARLOS
CENTRO DE CIÊNCIAS EXATAS E DE TECNOLOGIA
DEPARTAMENTO DE QUÍMICA
PROGRAMA DE PÓS-GRADUAÇÃO EM QUÍMICA
Conducting hybrid materials based on graphene/polymer
aiming at applications in monitoring and remediation of
environmental pollutants
Murilo Henrique Moreira Facure
*
Advisor: Dr. Daniel Souza Corrêa
*Scholarship: FAPESP
São Carlos, SP
2018
Dissertation presented as a part of the requirements to obtain
MASTER’S DEGREE in
AGRADECIMENTOS
Ao Dr. Daniel Souza Corrêa pelas portas abertas, pela dedicada, enriquecedora e valiosa orientação, pelos bons exemplos e confiança.
Aos parceiros nos trabalhos desenvolvidos nesse período, especialmente à Luiza A. Mercante pela inestimável colaboração e pela contribuição no meu desenvolvimento científico.
Aos membros da banca pela disposição e colaboração.
Aos colegas de grupo pelas contribuições na realização deste trabalho e por tornarem o dia a dia muito mais agradável.
À Embrapa Instrumentação pela estrutura disponibilizada e a todo o pessoal de suporte à pesquisa pelo incansável e indispensável auxílio, facilitando todo o processo.
À FAPESP (Processo Nº 2015/13140-0) pela bolsa de mestrado concedida e às demais agências de fomento (CNPq e CAPES) pelo suporte financeiro e pelo provimento de excelentes condições para a realização deste trabalho.
O presente trabalho foi realizado com apoio da Coordenação de Aperfeiçoamento de Pessoal de Nível Superior - Brasil (CAPES) - Código de Financiamento 001.
Ao Programa de Pós-Graduação em Química da Universidade Federal de São Carlos (PPGQ-UFSCar).
Ao LNNano-CNPEM pelo suporte e por proporcionar a fabricação dos eletrodos utilizados.
Ao Laboratório de Caracterização Estrutural (LCE) do Departamento de Engenharia de Materiais da UFSCar, onde foram obtidas imagens enriquecedoras para este trabalho.
Aos novos amigos de São Carlos, da casa, da brasa, da bola, do prato e do copo. Aos velhos amigos de Uberaba.
Aos irmãos de sangue e aos de coração pelos encontros, sorrisos, pelo apoio e otimismo.
AUTHOR'S PUBLICATIONS
1. FACURE, M. H. M.; MERCANTE, L. A.; MATTOSO, L. H. C.; CORREA, D. S. Detection of trace levels of organophosphate pesticides using an electronic tongue based on graphene hybrid nanocomposites. Talanta. 2017, 167, 59-66.
2. MERCANTE, L. A.; FACURE, M. H. M.; LOCILENTO, D. A.; SANFELICE, R. C.; MIGLIORINI, F. L.; MATTOSO, L. H. C.; CORREA, D. S. Solution blow spun PMMA nanofibers wrapped with reduced graphene oxide as an efficient dye adsorbent New J. Chem. 2017, 41, 9087-9094.
3. MERCANTE, L. A.; FACURE, M. H. M.; SANFELICE, R. C.; MIGLIORINI, F. L.; MATTOSO, L. H. C.; CORREA, D. S. One-pot preparation of PEDOT:PSS-reduced graphene decorated with Au nanoparticles for enzymatic electrochemical sensing of H2O2. Applied Surface Science. 2017, 407, 162– 170.
4. PAULA, K. T.; GAÁL, G.; ALMEIDA, G. F. B.; ANDRADE, M. B.; FACURE, M. H. M.; CORREA, D. S.; RIUL, A.; RODRIGUES, V.; MENDONÇA, C. R. Femtosecond laser micromachining of polylactic acid/graphene composites for designing interdigitated microelectrodes for sensor applications. Optics and Laser Technology 2018, 101, 74-79.
LIST OF FIGURES
FIGURE 4.4.1: SEM images of (a) PMMA nanofibers, (b) PMMA-GO nanofibers without and (c) with plasma treatment. (d) Magnified image of panel (c). (Reprinted with permission from Mercante et. al.130) ... 39 FIGURE 4.4.2: Photographs of a water droplet on PMMA fibers (a) before and (b) after plasma treatment. (c) FTIR spectra of pure PMMA (i), PMMA-GO (ii), PMMA-rGO (iii) and PMMA-rGO@MB (iv) nanofibers. (Reprinted with permission from Mercante et. al.130) ... 40 FIGURE 4.4.3: (a) Photographs of PMMA, GO, rGO and PMMA-rGO@MB nanofiber mats. (b) UV-Vis absorption spectra of MB aqueous solution in the presence of a PMMA-rGO membrane at different time intervals and (c) comparison of the extent of decontamination when using PMMA-rGO, with respect to those obtained with PMMA and PMMA-GO nanofiber mats after 60 min. Error bars indicate the standard deviation of the three measurements. (Reprinted with permission from Mercante et. al.130) ... 42 FIGURE 4.4.4: (a) pseudo-first order and (b) pseudo-second order plots for adsorption of MB on PMMA-rGO nanofiber membrane. (Reprinted with permission from Mercante et. al.130) ... 44 FIGURE 4.4.5: The linearized (a) Langmuir and (b) Freundlich isotherms for adsorption of MB on PMMA-rGO nanofiber membrane. (Reprinted with permission from Mercante et. al.130) ... 46 Figure A1: Digital picture (A) and a scheme of the geometrical features of the IDE (B). The fingers have a length (L) of 4 mm and width (w) and distance between fingers (s)
of 10 μm. ... 59 Figure A2: UV-Vis absorption spectra of: (i) rGO, (ii) PPy-rGO, (iii) PEDOT:PSS-rGO and (iv) PEDOT:PSS-rGO-AuNPs. ... 59 Figure A3: Energy-dispersive X-ray (EDX) spectroscopy images illustrating the distribution of the C, O and N elements in the PPy-rGO nanocomposite. ... 60 Figure B1: SEM images of PMMA-GO nanofibers using distinct adsorption times: (a) 30 min, (b) 1h and (c) 2h. ... 61
Figure C1: Permission to use the article “Detection of trace levels of organophosphate
pesticides using an electronic tongue based on graphene hybrid nanocomposites”. 62
Figure C2: Permission to use the article “Solution blow spun PMMA nanofibers
wrapped with reduced graphene oxide as an efficient dye adsorbent”. ... 63
Figure C3: Permission to use figures from the article “The rise of graphene”. ... 64
Figure C4: Permission to use figures from the article “Graphene Oxide, Highly Reduced
Graphene Oxide, and Graphene: Versatile Building Blocks for Carbon-Based
Materials”... 64
Figure C5: Permission to use figures from the article “Recent advances in electronic
RESUMO
ABSTRACT
CONDUCTING HYBRID MATERIALS BASED ON GRAPHENE/POLYMER AIMING AT APPLICATIONS IN MONITORING AND REMEDIATION OF ENVIRONMENTAL POLLUTANTS. Graphene is a material composed of a single layer of carbon atoms arranged in rings of six atoms with sp2 hybridization. Graphene displays a high sensitivity towards several molecules. Additionally, graphene presents other interesting features such as high electrical and thermal conductivity, mechanical strength and chemical stability, being considered a material with high potential for several technological applications. Herein, graphene-based and polymer-based materials were produced and used as constituents of sensing units of an electronic tongue in analyzes of organophosphorus pesticides and in pollutants remediation platforms based on the adsorption of methylene blue dye in aqueous solution. Graphene-based materials were obtained by chemical reduction of graphene oxide, which was synthesized using the modified Hummers method. The materials' physicochemical characterization was performed using Fourier transform infrared (FTIR) and UV–vis absorption spectroscopy and the morphology was analyzed using Scanning Transmission Electron Microscopy (STEM) images. The sensing units of the electronic tongue were obtained by using reduced graphene oxide (rGO) and nanocomposites obtained by the combination of the rGO with poly(3,4-ethylenedioxythiophene)-poly(styrenesulfonate) (PEDOT:PSS), polypyrrole and gold nanoparticles. The data were treated by Principal Component Analysis (PCA). The system was able to discriminate solutions of OP pesticides at nanomolar concentrations, solutions with the mixture of these pesticides and real samples, presenting a direct relationship between the pesticide concentrations and the values of the principal components in the PCA plots. The materials employed provided sensing units with a high specific surface area and high conductivity, yielding the development of a sensor with high sensitivity. In another work, a nanocomposite made of rGO and poly(methylmethacrylate) nanofibers, produced by the Solution Blow Spinning (SBS) technique, was employed in the adsorption of the methylene blue dye. The dye adsorption kinetics and isotherm follow the pseudo-second-order and the Langmuir models, respectively. The results suggest that the adsorption capabilities of the membrane obtained are due to the synergistic effect of the strong π–π stacking
SUMMARY
1. Introduction ... 1
1.1. Nanomaterials ... 1
1.2. Electronic Tongue ... 6
1.3. Adsorption ... 9
1.4. Solution Blow Spinning ... 11
2. Goals and Overview ... 13
3. Chapter I: Electronic tongue based on reduced graphene oxide* ... 14
3.1. Abstract ... 15
3.2. Introduction ... 15
3.3. Material and methods ... 17
3.4. Results and discussion ... 21
3.5. Conclusion ... 31
4. Chapter II: PMMA nanofibers modified with reduced graphene oxide
as adsorbent* ... 32
4.1. Abstract ... 33
4.2. Introduction ... 33
4.3. Experimental ... 35
4.4. Results and discussion ... 38
4.5. Conclusion ... 47
5. General Conclusions and Future Perspectives... 48
6. References ... 49
Appendix A ... 59
Appendix B ... 61
1.Introduction
1.1.Nanomaterials
Materials that present one or more dimensions in the nanoscale range, i.e. between 1 and 100 nm, are classified as nanomaterials.1 Research about nanomaterials have increased lately, where the miniaturization of devices is highly pursued, leading to lighter, more efficient and stronger gadgets. Once the material’s
properties are dependent on their dimensions, the physical and chemical properties of a bulk material can be drastically changed when they are reduced to the nanoscale. The surface area/volume ratio increases with decreasing particle size, influencing interfacial, electrical and optical properties of the materials. Therefore, it is clear that studies on nanomaterials and its processes and the development of novel experimental and theoretical techniques, as well as novel technologies based on this sort of materials will lead to major scientific and technological advances.1–3
Graphene
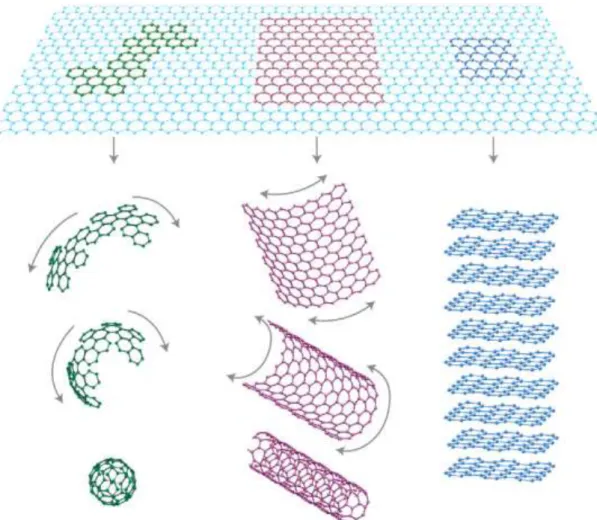
Graphene is a two-dimensional (2D) material consisting of a monolayer of carbon atoms arranged in rings of six atoms with sp2 hybridization, which is considered the building material for all carbon allotropes, as shown in Fig. 1.1.1.4 Until 2004, it was believed that 2D materials would not exist in the free state, when then graphene was obtained by mechanical exfoliation, being the first 2D atomic crystal isolated.5,6
The discovery of graphene enabled the confirmation of the outstanding characteristics predicted for this material. Graphene showed extremely high electron
mobility at room temperature, Young’s modulus of 1 TPa, strength and very high thermal conductivity, impermeability to gases, chemical stability and the ability to sustain extremely high densities of electric current.7
FIGURE 1.1.1: Graphene can be wrapped up into 0D fullerenes, rolled into 1D nanotubes or stacked into 3D graphite. (Reprinted with permission from Geim et. al.4)
to pristine graphene.10 The reduction of GO can be accomplished through different approaches, such as thermal and chemical reduction. The method used to synthesize GO and the reduction process used to obtain rGO will lead to different material structures, with different degrees of reduction, defects and functional groups. Since the properties of the final material are dependent on structure, the route used will affect the final performance of the material and the devices that it will compose.8,10,20,21 A scheme of the route used in this work is presented in Fig. 1.1.2, as well as the models of the structural backbone of GO and rGO19
.
FIGURE 1.1.2: Schematic representation of the route used to obtain graphene-based materials and the models of a graphene oxide and a reduced graphene oxide sheet. (Figure adapted from Compton et. al.19)
Graphene can still be doped or functionalized to modify its characteristics, reaching desired properties and increasing the application possibilities of this material and its based-devices.18,22,23 Graphene-based nanocomposites can be developed seeking an enhancement in the mechanical, thermal and electrical properties. Moreover, graphene as well as rGO sheets tend to aggregate irreversibly
process preventing agglomeration and maintaining the inherent properties of graphene.12,19,22 The functionalization of GO sheets is usually achieved in an easy way because of the highly oxygenated surface, in which the functional groups act as active sites in the incorporation of other materials and alter van der Waals forces, making it possible to obtain very stable dispersions of GO in a wide range of organic solvents.18,22
The modification of the graphene framework can be realized by covalent or noncovalent functionalization. The former is characterized by the rehybridization of the sp2 carbon atoms of the carbon network into the sp3 configuration. The structural alterations lead to a loss of electronic conjugation and can occur in the end and/or in the surface of the graphene sheet. The latter requires physical adsorption of suitable molecules on the graphene surface, not altering its structure and electronic and mechanical properties. The process can occur through different interactions, such as hydrogen bonding, π–π interactions, van der Waals and electrostatic forces.18,22,23
The huge interest in graphene arose mainly from its outstanding properties and the possibility of obtaining graphene-based materials with distinct characteristics that allow their use in different applications in many fields.7,18,22,34 Graphene-based materials have been used in nanoelectronics, drug delivery, supercapacitors, transistors, in the composition of flexible electrodes, as a component in energy materials, in solar and fuel cells, for H2 storage, in green chemistry, in catalysis, electrocatalysis and photocatalysis.7,22,23,27
The use of graphene in the composition of materials destined to environmental applications has grown notably. Its unique physicochemical properties can give rise to new alternatives and improved technologies to address and solve current environmental challenges. Graphene-based materials have been developed for contaminant monitoring or removal, as well as for water treatment and decontamination.35
electrochemical to optical.34 On the other hand, the use of graphene-based materials as a constituent element in sensing units of an electronic tongue (e-tongue) has not yet been widely reported and explored in scientific works. In this scenario, its use in e-tongues can give rise to more practical, stable and reproducible devices.
In the field of pollutants removal, graphene-based materials may be suitable as an adsorbent for inorganic, organic and gaseous contaminants, presenting inexpensive technological improvements for this area and some advantages in performance over well-established and already explored adsorbent materials.35,37,38
Polymers
Polymers have been widely used combined to graphene in order to obtain functional nanocomposites. Besides resulting in materials with improved physicochemical properties, the association of polymer and graphene can prevent the agglomeration of graphene sheets, improving the solubility and processability of the obtained solution.26 Furthermore, the use of polymers may be interesting in some specific areas, including sensor applications in which the functional groups of the polymer can improve the interaction with the target molecule, considering this interaction with pristine graphene is unfavorable due the absence of hydrophilic groups. However, graphene is important to decrease the electron transfer distance between the active sites of the biomolecules and the electrode area.22 In this context, the use of conducting polymers (CP) is even more interesting because they can maintain the desired electrical characteristics for this sort of application.39
Studies on CP began in the 1970s with the preparation of semiconducting films of poly(acetylene)40 and their further doping, which increased the conductivity by 13 orders of magnitude.41 Since then, the development of the CP field has grown at a very rapid rate due to the possibility of applications into several fields and technologies.42,43
macromolecule. Redox doping, doping without dopant ions and non-redox or protonation doping are examples of the main types of doping process for CPs.39,43
Controlling the structure and morphology of CPs at the nanoscale can lead to improved features not presented by the bulk materials. Conductive polymers are largely used as constituent materials of nanocomposites opening up a wide array of possible combinations to achieve desired physical and chemical properties not possessed by their bulk counterparts. Many of these new characteristics are due to surface structural features and quantum mechanical properties imparted by the nanostructuring process.42
Because of their appealing characteristics, the possibility to control or tailor many of their properties, the wide range of CPs nanocomposites that can be obtained, the different methods available of synthesis, CPs-based materials find applications in many fields. Indeed, the use of CPs have being reported in sensing with the different operating mechanism, including chemical, electrochemical, optical and fluorescence-based (bio)sensors, in sensor arrays, in biomedical applications, in solar cells, in catalysis, as transistors, among others.39,42–44
The choice of the polymer to obtain the graphene-based nanocomposite is of fundamental importance. The use of graphene combined with some polymers has already been explored. The polymer blend poly(3,4-ethylenedioxythiophene)-poly(styrenesulfonate) (PEDOT:PSS) and polypyrrole (PPy) can be associated with graphene-based materials leading to nanocomposites with interesting conducting properties.45–49 The polymers can be mixed with GO prior to the chemical reduction, preventing the aggregation of the graphene platelets and giving rise to more stable dispersions.27,50
1.2.Electronic Tongue
sensors) with high stability and cross-sensitivity associated with a suitable pattern recognition method or multivariate calibration tool for data processing.51–53 Selectivity is not a compulsory feature because the sensing units are expected to respond in a stable manner to several components of the analyte medium simultaneously, characterizing the global selectivity and cross-sensitivity. Accordingly, for each sample analyzed a fingerprint is obtained. Any slight change in the sample will be detected by the e-tongue, generating a different fingerprint. Thus, e-tongues can be employed in the classification (recognition, identification, discrimination) and quantitative determination of multicomponent and complex solutions, including varied beverages, ethanol/water mixtures, pharmaceutical products and in the monitoring of water quality samples.51,54–56
E-tongues can be based on different methods of detection. The most employed methods use electrochemical measurements, mainly potentiometry, amperometry and voltammetry. These methods have some advantages, e.g. high sensitivity, simple instrumentation and a well-known principle of operation.53,54,57 Impedance spectroscopy was first employed for e-tongues in 2002 by Riul et al.58,59 The impedimetric e-tongue present some advantages when compared to electrochemical methods because it has also high sensitivity, does not require sensing units with electroactive materials or active species in the measuring system and a reference electrode is not required.53,54,57 In this method, the sensing units are composed of interdigitated electrodes (IDEs) covered with ultrathin films of different materials and the measurements are carried out varying the frequency and collecting the impedance data. The process and the experimental setup usually employed in impedance spectroscopy measurements are illustrated in Fig. 1.2.1. At low frequencies the response is governed by the double-layer at the electrode/electrolyte interface, while at higher frequencies the geometric capacitance is most relevant. The solution conductance and the effects of the coating material over the electrodes is responsible for the total impedance at intermediate frequencies.54,58
FIGURE 1.2.1: Schematic representation of the apparatus usually used in an impedimetric e-tongue. (Reprinted with permission from Riul et. al.54)
There are some methods for processing multivariate experimental data employed for e-tongues. Partial least-squares regression (PLS), self-organizing map (SOM), artificial neural networks (AANs) and Principal Component Analyzes (PCA) are often used in this field.51,52 PCA is the most used process in the literature for e-tongues.54 Through a mathematical algorithm, PCA reduces the dimensionality of the data without loss of information, making a linear combination, creating new directions, the principal components, along which the variation of the data is the highest. The result of the treatment can be visualized through graphics in two or three dimensions, each axis representing a principal component. The graphics are used to assess similarities and differences among samples. In the case of impedimetric e-tongues, the input data is provided as matrices with the electrical responses obtained where rows represent the number of experiments and the columns represent the sensing units used.54,60,61
chemical nature of the samples and analytes to be investigated. The sensing units need also to be chemosensitive and respond electrically to minor changes in the liquid to be analyzed. The various possibilities of combining different sensors must lead to complementary and complete information about the analytes.53,54,57 Various class of materials has been used in impedimetric e-tongues, including lipidic membranes,54,57,62 conducting polymers,56,58,59,63,64 oxides,55 phthalocyanines,56,64 porphyrins54 and ruthenium complexes59,65. The use of other materials that have not yet been properly exploited in an electronic tongue can lead to improvements in the performance of such devices. In this scenario, the use of graphene-based materials can lead to an improvement of the sensing capability of new technologies.
1.3.Adsorption
Adsorption is a fast, low-cost, ease of operation and widely applicable alternative for the removal of undesired compounds. It is a spontaneous phenomenon, in which the concentration of a particular component increases at the surface or at the interface between two phases.66 The process can occur in solid-liquid, solid-gas, liquid-liquid and liquid-liquid-gas systems. The adsorbed component is denominated as adsorbate and the material that retains this component is defined as the adsorbent.66,67 Adsorption depends on temperature and on the nature and concentration of the adsorbate. When the process occurs through chemical bonds, it is denominated as chemical adsorption or chemisorption. On the other hand, when the process occurs by van der Walls interaction, it is called as physical adsorption or physisorption and in this case, the forces of attraction are weaker.66,68
Adsorption is also a time-dependent process and for this reason thermodynamics and kinetics studies are of fundamental importance in the acquisition of information about the final equilibrium interfacial energy and the rate of adsorption. While kinetics deals about the rate of changes occurring during the process, thermodynamics gives information about the final state of the system.69
The most used models are first order, pseudo-first and pseudo-second order models, in which kinetics equations are proposed in the form of chemical equations to explain the process.66,68,69
Thermodynamics studies, in turn, are commonly realized through adsorption isotherms, regardless of the system interface. The isotherms consist in the fundamental concept in adsorption science and graphically represent the relation between the quantity of adsorbate per mass unit of the adsorbent and the pressure or concentration of the adsorbate in the bulk fluid phase (liquid or gas) at a constant temperature. Through their analyzes important information can be obtained, such as the influence of temperature, the nature of the interactions between adsorbate and adsorbent, the existence of active sites in the adsorbent and the maximum adsorption capacity of the system. Therefore, isotherms help in the selection of suitable adsorbates and in choosing parameters for specific applications.68,69 Equilibrium models are used to describe adsorption isotherms. There are some more frequently used models, but no one is generally applicable. Thus, tests are made in order to obtain one model that best fits the experimental data under one set of conditions and can describe the studied process.70
The Langmuir model is based on a continuous process of adsorption of molecules onto the surface of the adsorbent and a corresponding desorption of other molecules, therefore, maintaining a zero rate of accumulation at the surface under an equilibrium condition. In this model, it is assumed that: (i) the surface is homogeneous, that is, the adsorption energy is constant over all sites; (ii) the adsorption occurs at localized sites with no interaction between adsorbate molecules and (iii) each site can accommodate only one adsorbate molecule.70,71 The Langmuir isotherm is presented in equation 1. It is derived from a solid-gas system, but analogously an isotherm for a solid-liquid system can be derived.
𝑞
𝑒= 𝑄
𝑜 𝑏𝐶1+𝑏𝐶𝑒𝑒 (1)where qeis the amount of adsorbate per weight unit of adsorbent, Q is the solid phase concentration corresponding to complete coverage of available sites and Ce is the residual liquid phase at equilibrium.66,70
multilayer adsorption. However, at low pressure this equation does not present a
proper Henry’s law behavior and at high temperature the isotherm does not have a finite limit. Therefore, the Freundlich model should be used in situations that do not present such limitations.70
𝑞
𝑒= 𝐾
𝐹𝐶
𝑒1 𝑛⁄ (2)where KF and n are constants, commonly temperature-dependent. Linearization of the equations can be made favoring the obtainment of the model parameters.
1.4.Solution Blow Spinning
Nanofibers are one-dimensional materials with great potential for application due to their unique physicochemical properties and characteristics. Nanofibers have a high surface area-to-volume ratio and are able to form networks of highly porous mesh with remarkable interconnectivity between their pores. A wide diversity of materials can be used in the preparation of nanofibers through different techniques.72
Solution blow spinning (SBS) has emerged as an interesting technique to produce micro/nanofibers. This technique can produce fibers with diameters ranging from a few tenths of nanometers to several microns, depending on the experimental conditions used.73 In SBS, the setup consists of a source of compressed gas with a pressure regulator, a syringe and a syringe pump to control the injection rate of the solution, a spraying apparatus consisting of two concentric nozzles and a collector. SBS method, differently from the electrospinning method, does not require high voltage equipment or any electrically conductive collector.74
of the gas. The fibers are formed with the evaporation of the solvent between the nozzles and the collector. A wide range of polymer types can be used to obtain the fibers through SBS. The appropriate choice must be made in order to produce a material with the characteristics required for the application to which the material will be intended. Unlike other techniques, in SBS the fibers formed are not attracted to the collector, and can be directed to any target. The fibers are deposited in a one-step process with no further drying, washing or cooling necessary and can be obtained in custom conformal geometries.73–76
Several parameters can exert influence on the fiber formation and, consequently, on its morphology and characteristics. Solution viscosity, polymer concentration, molecular weight, surface tension and vapor pressure can affect the fiber formation process when using SBS, as well as some other process and system parameters, such as air pressure, working distance, solution flow-rate, nozzle diameter and geometry. Ambient conditions like temperature, humidity and atmospheric pressure can also interfere with the process.75,76
2.Goals and Overview
The general goal of this dissertation was to develop and characterize different graphene-based nanomaterials combined with other nanostructured platforms to be employed as sensing units of an electronic tongue in the analysis of components that present a potentially harmful environmental impact and develop a graphene-based nanocomposite with adsorption ability towards a specific dye.
Specific goals
– Synthesis of GO and its further reduction to obtain rGO and the nanocomposites;
– Perform the morphological and physicochemical characterization of the obtained nanomaterials;
– Use of graphene-based materials as sensing units of an e-tongue in the analysis of organophosphorus pesticides;
– Investigation of the performance of a composite membrane obtained using SBS method in the adsorption of the dye methylene blue.
Chapters Overview
Initially, GO was synthesized using an improved eco-friendly Hummers method. The chemical reduction was performed using ascorbic acid, obtaining rGO. The nanocomposites were obtained by reducing the GO in the presence of the chosen polymers and the functionalization with gold nanoparticles occurred in the same reaction medium after the chemical reduction process. The materials were characterized and used to modify gold IDEs to be employed in the electronic tongue. The system was used in the analyses of OP pesticides. Chapter I presents the main results, indicating that the e-tongue was able to respond to the variation of solutions concentration, including real samples and mixtures of OPs pesticides.
Chapter II reports the fabrication of a membrane using SBS technique wrapped with rGO. The composite membrane was used in the adsorption of the methylene blue (MB) dye as a model of wastewater treatment. The adsorption kinetics and isotherm were determined, revealing a great potential of the nanocomposite towards MB adsorption.
3.Chapter I: Electronic tongue based on reduced graphene oxide*
*The content of this chapter is an adaptation of the article entitled: “Detection of trace levels of organophosphate pesticides using an electronic
tongue based on graphene hybrid
nanocomposites” by M. H. M. Facure, L. A. Mercante, L. H. C. Mattoso and D. S. Correa, published in Talanta.
3.1.Abstract
Organophosphate (OP) compounds impose significant strains on public health, environmental/food safety and homeland security, once they have been widely used as pesticides and insecticides and also display potential to be employed as chemical warfare agents by terrorists. In this context, the development of sensitive and reliable chemical sensors that would allow in-situ measurements of such contaminants is highly pursued. Here we report on a free-enzyme impedimetric electronic tongue (e-tongue) used in the analysis of organophosphate pesticides comprising four sensing units based on graphene hybrid nanocomposites. The nanocomposites were prepared by reduction of graphene oxide in the presence of conducting polymers (PEDOT:PSS and polypyrrole) and gold nanoparticles (AuNPs), which were deposited by drop casting onto gold interdigitated electrodes. Impedance spectroscopy measurements were collected in triplicate for each sample analyzed, and the electrical resistance data were treated by Principal Component Analysis (PCA), revealing that the system was able to discriminate OPs at nanomolar concentrations. In addition, the electronic tongue system could detect OPs in real samples, where relations between the principal components and the variation of pesticides in a mixture were established, proving to be useful to analyze and monitor mixtures of OP pesticides. The materials employed provided sensing units with high specific surface area and high conductivity, yielding the development of a sensor with suitable stability, good reproducibility, and high sensitivity towards pesticide samples, being able to discriminate concentrations as low as 0.1 nmol L-1. Our results indicate that the e-tongue system can be used as a rapid, simple and low cost alternative in the analyses of OPs pesticide solutions below the concentration range permitted by legislation of some countries.
3.2.Introduction
development of simple, rapid, and accurate methods to detect OPs residues at low concentrations becomes imperative.91,92
Since the introduction of OPs to the market in the 1970s, many analytical methods have been developed to detect these compounds.93 Mixture of organophosphorus pesticides can be analyzed, detected and quantified by techniques such as gas-chromatography-mass spectrometry,94 high-performance liquid chromatography95 and liquid chromatography–tandem mass spectrometry,96 achieving low limits of detection in the range of ng mL−1. Despite the good sensitivity and the
possibility of discriminating different pesticides, these methods require pre-treatment of the sample and sophisticated equipment.97
A detection approach capable of discriminating different pesticides in a mixture should provide reliable and robust sensor. At this point, array-based sensing approaches, such as electronic tongues, have emerged as an attractive method.97–99 The sensor array makes use of the global selectivity concept. In this type of sensor, although the sensing units may individually present poor selectivity, being considered
“nonspecific”, their response together should present cross-sensitivity, namely the ability of the system to respond reproducibly to a wide number of different analytes in solution without specific interaction. Although selectivity is not an essential condition, the system must have stability and high sensitivity.54 The use of a sensor array coupled with a chemometric tool, such as a Principal Components Analysis (PCA) employed for data treatment, can substantially improve sensor sensitivity and allow exact identification of the pesticide at trace levels in real samples. In addition, sensor arrays represent a low cost alternative since the system is not composed of sophisticated equipment and does not require a large amount of samples or their pre-treatment.57
used in (bio)sensing, including for pesticide detection,101 because of its unique properties and intrinsic electrochemical characteristics.109 In addition, the electron transfer between conjugated polymers and graphene through a π–π interaction can consequently increase the sensing performance of the hybrid material.13
In this work, we propose the use of an impedimetric electronic tongue (e-tongue) to discriminate and analyze mixtures of OPs pesticides in real samples. The sensor array was based on reduced graphene oxide (rGO) and rGO-based nanocomposites, which were characterized by physical chemical techniques, including Fourier transform infrared (FTIR) and UV–vis spectroscopy, Scanning Transmission Electron Microscopy (STEM) and Energy-dispersive Xray (EDX) analysis. By correlating the experimental data using Principal Component Analysis (PCA), the sensor array was capable of detecting OPs pesticides down to nanomolar concentrations in a expedite way.
3.3.Material and methods
3.3.1.Materials
Graphite flakes, sulfuric acid (H2SO4), potassium permanganate (KMnO4), hydrochloric acid (HCl) and hydrogen peroxide (H2O2) used in the synthesis of graphene oxide were purchased from Dinamica, Brazil. Ascorbic Acid (AA), polypyrrole (PPy), poly(3,4-ethylenedioxythiophene) poly(styrenesulfonate) (PEDOT:PSS), sodium citrate, hydrogen tetrachloroaurate (III) trihydrate (HAuCl4·3H2O, ≥99,9%), monopotassium phosphate (KH2PO4) and dibasic potassium phosphate (K2HPO4) were obtained from Sigma-Aldrich. Malathion and cadusafos pesticides (commercial grade samples) were obtained from FMC (Brazil). The stock solutions of each pesticide were prepared in acetone and stored in amber flasks maintained at 4 °C. All the chemicals were used as received, and double-distilled water was used to prepare all the aqueous solutions. Mineral water was purchased from a local supplier.
3.3.2.Synthesis of nanocomposites
concentrated H2SO4 (70 mL) solution using an ice bath. KMnO4 (9g) was slowly added to the mixture in order to keep the temperature of the mixture below 20 °C. The temperature was raised to 40 °C and the system was maintained under vigorous stirring for 30 min. Next, 150 mL of water was added and the resultant mixture solution was maintained at 95 °C. The solution was stirred for 15 min and subsequently 500 mL of water was added followed by the addition of 15 mL of H2O2 (30%), leading to a color change of the mixture from brown to yellow. Subsequently, the mixture was filtered and washed with 5% HCl aqueous solution and double-distilled water in order to remove the excessive acid and inorganic salts. The GO was dried overnight at room temperature. Finally, the solid was dispersed in double-distilled water using ultrasonic bath for 30 min. Centrifugation (4000 rpm for 5 min) was used to remove any non-exfoliated material, and the supernatant was stocked for further use.
The synthesis of the nanocomposites used to modify the electrodes was carried out through the chemical reduction of GO using AA as the reducing agent. Reduced graphene oxide (rGO) was synthetized by adding 70 mg of AA in a 50 mL dispersion of GO (0.5 mg mL−1) maintaining the system under reflux for 24 h. PPy-rGO
and PEDOT:PSS-rGO nanocomposites were synthetized reducing the GO in the presence of the conducting polymers. In the synthesis, 75 mg of the polymers were added to 50 mL of a GO dispersion (0.5 mg mL−1). After obtaining a homogeneous
dispersion, 50 mg of AA were added and the system was kept for 24 h under reflux. The PEDOT:PSS-rGOAuNPs nanocomposite was obtained adding 25 mg of HAuCl4 and 37 mg of sodium citrate into the solution of PEDOT:PSS-rGO, maintaining the system in reflux for 20 min. The solids were recovered by centrifugation and washed twice with water before use.
3.3.3.Physical chemical characterization
UV–Vis absorption spectroscopy was performed in a Perkin-Elmer Lambda spectrophotometer. Fourier transform infrared (FTIR) spectroscopy was carried out with a Bruker Vertex 70 instrument. The spectra in ATR mode were collected in the range from 2000 cm−1 to 400 cm−1 with a resolution of 2 cm−1 and using
Energy-dispersive X-ray (EDX) analyses were performed using a FEG-SEM (JEOL, JSM 6510) using silicon as substrate.
3.3.4.Interdigitated electrodes (IDEs)
The gold interdigitated electrodes (IDEs) were fabricated by conventional photolithography at the Brazilian Nanotechnology National Laboratory (LNNano). Every IDE is composed by 50 pairs of fingers having length of 4 mm and width and distance between fingers of 10 μm. A digital picture and a scheme of the geometrical features of the IDE employed can be seen in Fig. A1 in Appendix A. IDEs do not require polishing, and analysis can be done using a small sample volume in a wide frequency spectrum. Moreover, the IDEs electrical response can be changed by modifying their shape and geometrical dimensions.110
3.3.5.Impedimetric electronic tongue
Impedance spectroscopy measurements were performed using a Solartron impedance analyzer (1260 A). All sensing experiments were carried out by recording impedance values as a function of frequency from 10 Hz up to 1 MHz using an applied voltage of 50 mV. Once the measurements of an impedimetric e-tongue are performed using a fixed potential, it is not necessary to use a reference electrode usually required for a three-electrode cell employed in electrochemical measurements.64
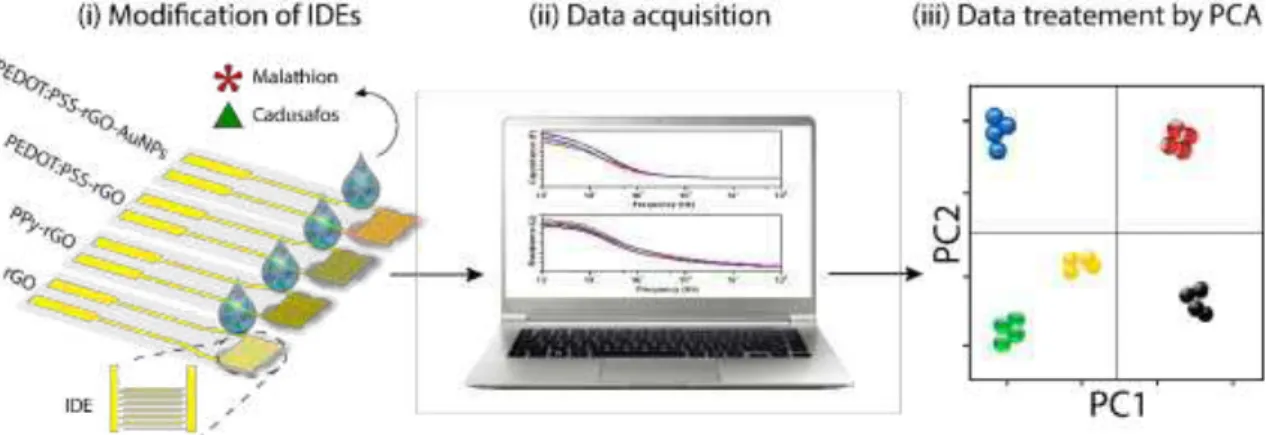
The electronic tongue was composed by four sensing units prepared by drop casting the nanocomposite solutions onto the gold interdigitated electrodes (IDEs), which were used to analyze the pesticides solutions, as illustrated in Fig.3.3.1 (i). The sensing units were characterized by impedance spectroscopy (Fig.3.3.1 (ii)) and the data were treated with the Principal Component Analysis (PCA) method (Fig.3.3.1 (iii)). The following nanocomposite films were used to compose the e-tongue array: rGO, PPy-rGO, PEDOT:PSS-rGO and PEDOT:PSS-rGO-AuNPs.
Prior to the electrode modification, bare IDEs were subjected to impedance measurements in PBS buffer (0.1 mol L−1, pH 7.0) to check the
FIGURE 3.3.1: Schematic illustration (i-ii) of the impedimetric e-tongue system based on graphene hybrid nanocomposites for detection of trace levels of OPs pesticides. (iii) PCA was the statistical technique used to treat the electrical resistance data collected by the e-tongue. (Reprinted with permission from Facure et. al.84)
Three consecutive measurements were performed with each sensing unit immersed in the buffer used as reference, and in the malathion and cadusafos solutions at 0.1, 0.5, 1, and 5 nmol L−1. A solution of each pesticide was first prepared
in acetone. These solutions were then diluted with PBS buffer (0.1 mol L−1, pH 7.0) to obtain the stock solutions with a concentration of 30 μmol L−1. The standard pesticides
samples used in the measurements were prepared by diluting the stock solution with PBS buffer, while the real samples were prepared by diluting it with tap water. The measurements started with the buffer and then from the lowest (0.1 nmol L−1) to the
highest (5 nmol L−1) concentration of pesticide solution. The sensing units were left
soaking into the solution 10 min before data acquisition.
3.3.6.Data treatment
obtained shows the maximized variance of the samples and allows visualization of the treatment. The PCA plot is used to determine if the samples can be grouped through the evaluation of differences and similarities between them.60
3.4.Results and discussion
3.4.1.Nanocomposites characterization
The chemical reduction of GO and the formation of the hybrid nanocomposites were evaluated by UV–vis absorption and FTIR spectroscopies. The UV–vis absorption spectra are presented in Fig. A2 in Appendix A. The spectrum of rGO (i) displays a single absorption band at 271 nm that arises from a redshift of the GO absorption peak, indicating a restoration of the electronic conjugation and the successful reduction of GO.50 The peak related to rGO in the nanocomposites is
redshifted to 291 nm due to the π–π interaction between the quinoid rings of the
conductive polymers and the planar structure of the rGO. In the spectrum of the PPy-rGO nanocomposite (ii) two peaks of the PPy appear at 225 nm and 415 nm, which are assigned to the π–π* transition.45,111 The composites containing PEDOT:PSS show a peak at 225 nm related to the substituted phenyl groups in PSS and another peak at 890 nm ascribed to the polaron state of PEDOT.112,113 The spectrum of the nanocomposite with AuNPs (iv) presents a characteristic peak at 545 nm attributed to the surface plasmon resonance of the nanoparticles.114
The FTIR spectra in the Fig. 3.4.1 confirm the successful synthesis of the materials. The FTIR spectrum of rGO (i) presents only one major peak at 1633 cm−1
attributed to C=C stretching, suggesting a restoration of unoxidized graphitic domains after the chemical reduction.115 The peaks associated with the oxygen functional groups characteristic of GO do not appear with significant intensity in the spectrum, confirming the high degree of GO reduction achieved using AA as reducing agent. The PPy-rGO nanocomposite spectrum (ii) presents a peak related to the C=C stretching of rGO in 1630 cm−1 and the characteristic peaks of PPy appear at 1554, 1449 and
1030 cm−1, which are attributed to asymmetric and symmetric ring stretching vibration
(iii), displays a peak of rGO at 1633 cm−1, in addition to the vibrational bands at 1515
and 1295 cm−1 related to C=C and C-C stretching vibrations of the quinoid structure of
the thiophene ring, respectively. Moreover, the peaks at 932 and 680 cm−1 are related
to the C-S bonds in the thiophene ring. The S-O bond and S-phenyl bond in PSS are respectively evidenced by the peaks at 1174 and 1080 cm−1.48 The same vibrational
peaks of rGO and PEDOT:PSS appear in the spectrum of the nanocomposite with gold nanoparticles (iv), as expected.
FIGURE 3.4.1: FTIR spectra of rGO (i), PPy-rGO (ii), PEDOT:PSS-rGO (iii) and PEDOT:PSS-rGO-AuNPs (iv). (Reprinted with permission from Facure et. al.84)
to involve and coat the rGO sheets and, as a consequence of the electrostatic repulsive force between them, a higher dispersibility is reached, preventing the restacking of the rGO.46,49,116 This is in agreement with the zeta potential experiments: PPy-rGO, PEDOT:PSSrGO and PEDOT:PSSrGOAuNPs dispersions yielded values of 42, -40 and -51 mV, respectively, while the dispersion of rGO presented a value of -22 mV.
FIGURE 3.4.2: STEM images of (A) rGO, (B) PPy-rGO, (C), PEDOT:PSS-rGO, (D) PEDOT:PSS-rGO-AuNPs, (E) histogram of size distribution of gold nanoparticles and (F) EDX spectra of rGO (black), PPy-rGO (green), PEDOT:PSS-rGO (blue) and PEDOT:PSS-rGO-AuNPs (red). (Reprinted with permission from Facure et. al.84)
spectrum of the PPy-rGO nanocomposite at around 0.39 keV, indicating the presence of the polymer in the material. The presence of N element is confirmed in the EDX mapping images presented in Fig. A3 in the Appendix A. The peaks related to Si element appear because of the substrate employed and due to the thickness of the films evaluated. The presence of Na element arises from residual sodium citrate used in the reduction of Au nanoparticles.
3.4.2.Impedimetric electronic tongue experiments
Before using the IDEs modified by rGO and the rGO-based nanocomposites in the impedimetric e-tongue system for the detection of the pesticides, measurements in PBS buffer (0.1 mol L−1, pH 7.0) were performed. Such
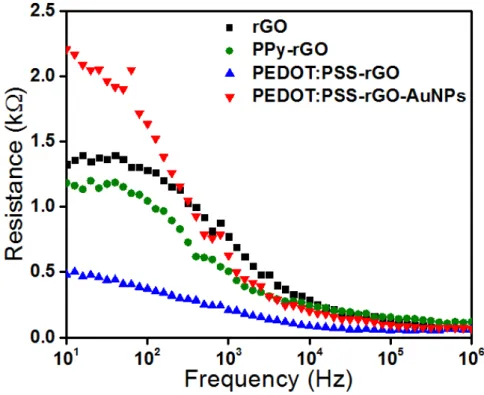
experiments aimed at determining the optimized frequency in the impedance spectroscopy measurements for yielding the best samples discrimination ability. Fig. 3.4.3 shows the electrical resistance curves of each sensing unit.
The responses in the lower frequency region ( < 100 Hz) are governed by the double-layer effect, while at higher frequencies ( > 100 kHz) the impedance is governed by the geometric capacitance. The films coating the electrodes governs the responses at the intermediate frequency region, from 100 Hz to 100 kHz.58 Based on Fig. 3.4.3, all the experimental data in this work will be correlated through PCA by grouping the information from electrical resistance values at 100 Hz, a frequency at which the effects from the materials coating the electrodes are more evident. In addition, the deposition of the conducting films onto the gold IDE's caused an expected substantial decrease in electrical resistance (almost 92%), indicating that the films altered deeply the electrical responses of bare electrodes.
3.4.2.1.Different pesticides and concentrations
To fully explore the different sensitivities of the rGO based nanomaterials, an electronic tongue based on an array of 4 IDEs modified by rGO, PPy-rGO, PEDOT:PSS-rGO and PEDOT:PSS-rGOAuNPs was first used to perform discrimination of OPs pesticides in PBS buffer solution (0.1 mol L−1, pH 7.0). In a first
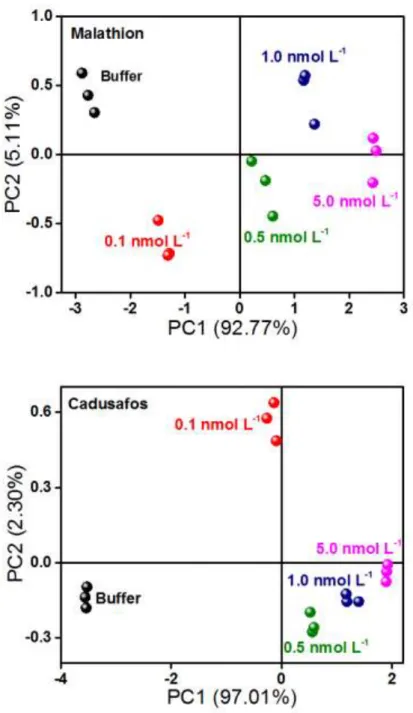
investigation, PCA (Fig. 3.4.4) was employed to interpret the response of the e-tongue collected at 100 Hz to individual malathion (A) and cadusafos (B) solutions in nanomolar range. In both PCA plots, all the samples are clearly discriminated, presenting no superposition between distinct groups (buffer, 0.1, 0.5, 1.0 and 5.0 nmol L−1) and a proximity of triplicate points of the same sample can be seen, indicating high
FIGURE 3.4.4: PCA plots for the electrical resistance responses (experimental data collected with the electronic tongue) at 100 Hz for the analysis of malathion (A) and cadusafos (B) diluted solutions. (Reprinted with permission from Facure et. al.84)
FIGURE 3.4.5: PCA plot for the electrical resistance responses (experimental data collected with the electronic tongue) at 100 Hz for the analysis of malathion and cadusafos solutions. (Reprinted with permission from Facure et. al.84)
3.4.2.2.Mixture of pesticides
In order to simulate a real sample analysis, we prepared and analyzed PBS solutions contaminated with different amounts of both pesticides. Sixteen solutions were prepared making a combination of the concentrations used previously. The array was again able to discriminate all the solutions, yielding a PCA without any superposition of the distinct groups of samples, while a good proximity of the samples having the same pesticide concentrations could be observed. When the concentration of one pesticide is fixed at 1 nmol L-1, the average value of the PC1 varies linearly with the concentration of the other pesticide, as displayed in Fig. 3.4.6. The linear regression curves obtained when the concentration of malathion (Fig. 3.4.6A) and cadusafos (Fig. 3.4.6B) in the solutions was varied yielded R2 values of 0,997 and 0,987, respectively.
present in the mixture.89 Our e-tongue proved to be useful to analyze the variation of the concentration of OP pesticides in a mixture at a nanomolar range.
3.4.2.3.Real samples
FIGURE 3.4.7: PCA plot for the electrical resistance responses (experimental data collected with the electronic tongue) at 100 Hz for the analysis of malathion and cadusafos solutions prepared with PBS buffer solution and tap water (real samples). (Reprinted with permission from Facure et. al.84)
developed here presents high sensitivity once it could detect malathion and cadusafos at concentrations as low as 0.1 nmol L−1.
3.5.Conclusion
4.Chapter II: PMMA nanofibers modified with reduced graphene
oxide as adsorbent*
*The content of this chapter is an adaptation of the
article entitled: “Solution blow spun PMMA nanofibers wrapped with reduced graphene oxide
as an efficient dye adsorbent” by L. A. Mercante, M. H. M. Facure, D. A. Locilento, R. C. Sanfelice, F. L. Migliorini, L. H. C. Mattoso and D. S. Correa, published in New Journal of Chemistry.
4.1.Abstract
Nanotechnology has provided innovative solutions to guarantee sustainable energy and maintain a clean environment for the future. In this regard, 1D nanostructured materials, such as nanofibers, are very attractive, especially for the development of economic and environmentally friendly approaches for wastewater treatment. Recently, Solution Blow Spinning (SBS) has appeared as a powerful fiber forming technique with several advantages compared to the traditional electrospinning method. Herein, we present the fabrication of composite membranes using solution blow spun poly(methylmethacrylate) nanofibers wrapped with reduced graphene oxide (PMMA-rGO) to adsorb methylene blue (MB), which is a typical dye used in the printing and dyeing industry. The dye adsorption kinetics and isotherm follow the pseudo-second-order and the Langmuir models, respectively. The π–π stacking interactions were considered to be the major driving force for the spontaneous adsorption of MB and the maximum adsorption capacity was 698.51 mg g-1 according to Langmuir fitting. The developed nanocomposite shows great potential for decolorizing dyeing wastewater aimed at industrial and environmental remediation applications.
4.2.Introduction
Water contamination has nowadays become a global problem due to the intensification of industrial and agricultural activities. As a class of water pollutants, organic dyes used in varied industrial processes can be found widespread in the environment as long-life residual products.37,131 In addition to their unwanted colors, some of these dyes may degrade to produce carcinogens and toxic products.132 In this context, attempts to develop novel materials and nanofiber membranes with high surface area and porosity at a low cost for efficient remediation of dyes are highly keen. Also, the possibility of incorporating a variety of functionalities to the nanofibers, prior or after the spinning process, enables the tuning of the sorbent properties for specific pollutants.133
nanosized structures also endow them some advantages such as rapid equilibrium rates, high adsorption capacity and effectiveness over a broad pH range.138 Adsorption capacity depends on the surface properties of the adsorbent, in which the sites available to interact with the pollutants and the homogeneous dispersity in aqueous media are important factors in the case of graphene-based materials.136 Although the diverse oxygen functionalities of graphene oxide (GO) provide the material with hydrophilicity, at the same time they also provide a weak π electron structure that results in a poor affinity for aromatic pollutants.136 Reduction of GO nanosheets allows the recovery of its adsorption capabilities by giving back the π-delocalized electron system. However, reduced graphene oxide (rGO) tends to aggregate due to strong
intermolecular (specially, π–π and van der Waals) interactions between the layers,
thus reducing the number of potential adsorption sites of graphene. In order to overcome such undesirable aggregation, loading rGO onto low-cost substrates has proven to be a promising alternative.139 In this scenario, inexpensive spun nanofibers appear as an ideal framework material that can be used to support rGO nanosheets, preventing their agglomeration.
More recently, the solution blow spinning (SBS) technique has been developed as a promising micro/nanofiber mat fabrication technology.73–76,140 This method uses high speed gas flow as the driving force to blow polymer solution streams to ultrathin jets and nanofibers.74 The process has received considerable attention due to its easy handling and high productivity for mass production of nanofibers.141 In comparison to electrospinning, one of the most widely employed fiber fabrication technique,142 SBS has fewer process requirements and variables, does not require a high voltage source and a metallic target and has a deposition rate that is approximately 10 times faster than conventional electrospinning.74
capabilities as compared to their homologous PMMA and PMMA-GO counterparts. The fact that the graphene adsorption sites are fully expressed on the surface of a low-cost nanofiber membrane-based substrate offers the possibility of an efficient pollutant removal process, which opens up new possibilities for environmental remediation.
4.3.Experimental
4.3.1.Materials
Poly(methylmethacrylate) (PMMA, Mw = 350 000), methylene blue (MB) and ascorbic acid were purchased from Sigma- Aldrich. Acetone and chloroform were purchased from Synth Chemical (São Paulo, Brazil). Graphite flakes, potassium permanganate (KMnO4), sulfuric acid (H2SO4), hydrochloric acid (HCl) and hydrogen peroxide (H2O2) were obtained from Dinamica, Brazil. All the chemicals were used as received.
4.3.2.Preparation of PMMA spun nanofibers by SBS
PMMA was dissolved in chloroform : acetone at 3 : 1 (v/v) under vigorous stirring for 2 h at room temperature to prepare a 10% (w/v) polymer solution.
FIGURE 4.3.1: Sketch of the steps involved in the preparation of PMMA-rGO composite nanofibers: (A) solution blow spinning PMMA nanofibers and (B) surface modification: (i) plasma treatment, (ii) GO adsorption and (iii) GO reduction. (C) Scheme of the decontamination process of MB-containing water using the developed composite nanofibers. (Reprinted with permission from Mercante et. al.130)
4.3.3.Synthesis of GO
from brown to yellow. The mixture was filtered and washed with diluted HCl (1 : 10) and distilled water several times to remove any excessive acid and inorganic salts. The resulting GO was dried overnight at room temperature.
4.3.4.Surface functionalization of PMMA nanofiber mats with rGO
Before the functionalization, the as-prepared PMMA spun nanofiber membranes were subjected to plasma treatment (SPI Plasma Prep II system) for different etching times (15, 30 and 60 s) and the time period of 30 s was chosen for subsequent studies. Then, the nanofiber membranes were coated with GO by means of immersion in an aqueous suspension of GO (0.5 mg mL-1). Different adsorption times for GO were also tested (30 min, 1 and 2 h) and the time period of 1 h was chosen for further studies (see Fig. B1 in Appendix B). The resultant PMMA-GO composite was washed three times and dried under ambient conditions before immersion in a 0.3 mg mL-1 ascorbic acid solution for the reduction of the GO-wrapped nanofibers. The mixture was allowed to stir for 48 h, washed 3 times with distilled water and dried overnight at room temperature.
4.3.5.Dye adsorption experiments
For the adsorption experiments, MB was chosen as a model dye. The dye adsorption experiment was performed in a 100 mL beaker under ambient conditions. The beaker was filled with a MB solution (100 mg L-1, 50 mL). Then, 15 mg of PMMA-rGO nanofiber mats were added to the beaker. At each time interval, 1.5 mL of the solution was collected. The sample was then diluted to 3 mL with water to analyze MB adsorption efficiency by using a Lambda-25 UV-vis spectrometer (Perkin Elmer). The dye removal efficiency (Rt,%) and adsorption amount (qt, mg g-1) at time t were calculated using eqn (3) and (4), respectively:
𝑅
𝑡=
(𝐶0𝐶− 𝐶0 𝑡)× 100
(3)𝑞
𝑡=
(𝐶0− 𝐶𝑚 𝑡)𝑉 (4)desorption experiment, the PMMA-rGO@MB nanofibers were washed thoroughly with deionized water. Then the fibers were put in ethanol solution containing 2% (v/v) NaOH. After desorption equilibrium, the fibers were washed several times with deionized water and were reused in the next cycle of the adsorption experiment.
4.3.6.Characterization
The morphology and size of the samples were evaluated using a Scanning Electron Microscope (JEOL JSM-6510). The average fiber diameter was estimated using the Scanning Electron Microscopy (SEM) images with the aid of an image analysis software program (Image J, National Institutes of Health, USA).
Contact angles of water drops on the surface of spun fibers (nonwoven mats) were measured using a contact angle measuring system (CAM 101 model KSV Instruments) equipped with a CCD camera (KGV-5000). For each measurement, a 5 µL droplet was pipetted onto the mat surface, and the images of the droplet were automatically taken as a function of time. From these images, contact angle values were calculated using dedicated software (KSV CAM 2008).
The surface area of PMMA nanofibers was calculated according to the Brunauer–Emmett–Teller (BET) method, using N2 adsorption data obtained in a ASAP-2020 system (Micromerities).
Fourier transform infrared (FTIR) spectra of samples were recorded using a Bruker Vertex 70 equipment. The spectra were collected in ATR mode from 2000 cm-1 to 600 cm-1. A total of 64 scans were collected at a resolution of 2 cm-1.
4.4.Results and discussion
4.4.1.Characterization of PMMA-rGO composite fiber membranes
A facile spinning-based strategy was developed to fabricate composite nanofiber membranes for dye adsorption. The preparation process of the PMMA-rGO composite spun nanofibers is illustrated in Fig. 4.3.1, including solution blow spinning PMMA nanofibers, plasma treatment of the PMMA surface, GO adsorption and GO reduction.
shows PMMA nanofibers randomly orientated with a diameter of 642 ± 169 nm. Furthermore, BET analysis for the PMMA spun membranes revealed that the surface area of the fibers was 16 m2 g-1. This value is similar or even higher when compared to other polymeric nanofibers.143,144
Plasma treatment was a key step to the successful chemical modification of PMMA fibers with GO, as illustrated in Fig. 4.4.1b and c. In Fig. 4.4.1b, it is clearly seen that the GO sheets only cover part of the nanofiber surface, while a large portion has no GO. However, the GO sheets uniformly covered the entire surface of the nanofibers after the plasma treatment was applied for 30 s (Fig. 4.4.1c). The characteristic veil-like structure of graphene materials can be seen covering the whole surface area of the nanofibers in Fig. 4.4.1d (magnified image of panel c).
FIGURE 4.4.1: SEM images of (a) PMMA nanofibers, (b) PMMA-GO nanofibers without and (c) with plasma treatment. (d) Magnified image of panel (c). (Reprinted with permission from Mercante et. al.130)
PMMA surface has a large contact angle value of about 114º. With the plasma treatment, the contact angle of the PMMA nanofiber mats decreased, which reveals a modification in the surface chemistry. The hydrophobic surface of the PMMA fiber mats becomes quite hydrophilic upon plasma etching for 30 s, due to plasma-induced oxidation of the surface methyl groups, causing the surface of the film to become more hydrophilic.145 Together with the SEM images (Fig. 4.4.1), we can conclude that plasma etching for 30 s produced enough hydrophilic functional groups on the surface of the PMMA nanofibers leading to a uniform decoration of the GO. The interaction between the plasma treated PMMA nanofibers and GO is mainly due to the presence of hydrogen bonds between the hydroxyl groups of GO and the carboxyl groups of PMMA (after plasma treatment).146
To further evaluate how the changes in surface properties affected the adsorption capability of the composite material, the chemical reduction of GO-coated nanofibers was performed with an environmentally friendly ascorbic acid-based method.17 Chemical reduction of GO results in a stable rGO layer which significantly altered the surface chemistry of graphene oxide (including loss/conversion of surface O-functional groups and partial recovery of the π electron structure), and consequently, had marked effects on the adsorption affinities of the carbon nanomaterials.147
To better understand the chemical composition of the nanofiber coating with GO or rGO, FTIR analyses were done (Fig. 4.4.2c). As noted, all the spectra show the characteristic bands of PMMA at 1750 (C=O), 1452 (C–H), 1382 (O–CH3), 1268 (C–C–O), 1128 (C–O–C) and 868 (C–O–C) cm-1.83,148 The spectrum of PMMA-GO, in addition to the characteristics of PMMA, displays the vibrational bands at 1424 and 1292 cm-1 related to epoxy C–O and alkoxy C–O stretching vibrations of GO, respectively. After the reduction with ascorbic acid, these peaks disappeared and a new vibrational band, attributed to the C=C stretching, appears at 1640 cm-1, suggesting a restoration of the carbon basal plane in rGO.84
Each modification step was also monitored and confirmed by digital photographs, as illustrated in Fig. 4.4.3a. After modifying the white PMMA nanofiber membrane by immersing it in the suspension of GO, the material surface became brown. After GO reduction with ascorbic acid, the color of the nanofibers changed to black, thereby confirming the formation of PMMA-rGO nanocomposites.
4.4.2.Dye adsorption studies
of the composite nanofibers for MB was determined to be 230.7 mg g-1. The adsorption capacity of MB was found to be 163.3 mg g-1 for the second cycle, which represents 71% of the capacity determined in the first adsorption process, demonstrating reasonable stability and reutilization of the composite material.
FIGURE 4.4.3: (a) Photographs of PMMA, GO, rGO and PMMA-rGO@MB nanofiber mats. (b) UV-Vis absorption spectra of MB aqueous solution in the presence of a PMMA-rGO membrane at different time intervals and (c) comparison of the extent of decontamination when using PMMA-rGO, with respect to those obtained with PMMA and PMMA-GO nanofiber mats after 60 min. Error bars indicate the standard deviation of the three measurements. (Reprinted with permission from Mercante et. al.130)