UNIVERSIDADE DE LISBOA
FACULDADE DE CIÊNCIAS
DEPARTAMENTO DE BIOLOGIA ANIMAL
From Plasticity to Robustness:
Mechanisms coordinating organ size and pattern
André Nogueira Alves
Mestrado em Biologia Evolutiva e do Desenvolvimento
Dissertação orientada por:
Doutora Christen Mirth, School of Biological Sciences, Monash University,
Melbourne, Austrália
Doutor Élio Sucena, Faculdade de Ciências da Universidade de Lisboa,
Lisboa, Portugal
Agradecimentos
Agradecer, ou noutras palavras: “Obrigado por me terem dado parte do vosso coração”. E porque, com cada pedaço de coração que fui recebendo, e por vezes mais do que isso, consegui manter as minhas forças e a minha sanidade mental ao longo do ano, agora é a minha vez de retribuir e dar parte do meu coração.
Primeiro quero agradecer a toda a comunidade da Universidade de Monash, em Melbourne, por me fazerem rir às horas de almoço ou fora delas. Por serem curiosos e quererem saber mais do meu trabalho, obrigando-me a pensar nas melhores maneiras de apresentá-lo.
Aos membros dos laboratórios de Drosophila do espaço de laboratório onde estive, ajudaram-me incontáveis vezes e faziam-ajudaram-me companhia por várias noitadas que lá se fez.
A todos os membros do laboratório onde estive, sem eles não perceberia quão complicado é este projecto para quem não trabalha nele. À Ansa por aturar-me na quantidade de vezes que dizia que estava esfomeado, e por ser a primeira a levantar-se e chamar-me caso houvesse comida de graça na sala comum. À Celina por ajudar-me nas minhas experiências e deixar-me atazaná-la horas sem fim. E ao Nuno pelas conversas não relacionadas com trabalho, mas sim sobre livros, séries e tantos outros assuntos. Ajudaram-me a ter uma mente crítica e sã, elemento crucial nos últimos meses.
A todos os elementos associados ao meu mestrado, o meu obrigado, o primeiro ano não seria nada sem eles e o segundo também não seria grande coisa. Obrigado aos meus colegas e aos professores por proporcionarem um mestrado brilhante.
À minha família, por apesar de ser gigantesca, lembrarem-se sempre do “André que foi para a Austrália e que um dia será o doutor da família” com um orgulho sem comparação, sem que alguma vez o tenha pedido. O que fiz nesta tese é um mistério do universo para eles, mas mesmo não sabendo, eles acreditam sempre que farei o meu melhor.
Aos seis, que comigo formam o C7ayton, Cass, Kevin, Emily, Mario, Helena e Tent. Foram todos essenciais, cada um à sua maneira, quer dando apoio, quer criticando. Por todas as vezes que apoiaram, com bolos, doces, palavras simpáticas ou apenas dois dedos de conversa com um café, um gigantesco obrigado. Por todas as vezes que criticaram com, “não consegues fazer isto”, “pára de fingir que trabalhas”, ainda maior obrigado. Por vezes um não cria uma maior força de vontade do que um “sim”. Pelas vezes que me fizeram rir, como quando coseram sinos à minha bata para não os assustar, e como, mesmo com 6 sinos, conseguia assustá-los a todos. Por serem dos primeiros a perguntar se precisava de ajuda com alguma coisa, mesmo quando estavam ocupados com tudo. As minhas memórias com estes seis serão sempre recordadas com alegria.
À única Velha, Eduarda, ou Vyteer, por mesmo a milhares de quilómetros, 11 horas de diferença horária e muito mais, conseguir estar a par tudo e pronta para dar tudo de si caso fosse necessário. Nos bons e maus momentos, estava lá, nem que fosse calada, a sua presença foi suficiente em muitos momentos para manter a minha sanidade. Por continuar a ser assim e não mudar nunca. Por ser aquela pessoa que ajuda outra e fica na véspera de entregar uma tese até de madrugada acordada. Espero que esta amizade continue por muitos mais anos.
Aos meus pais, por me terem criado da maneira que sou, cada um com os seus erros, mas por me terem apoiado incondicionalmente em cada decisão que fizesse. Apesar de serem um duo estranho e impossível de se aturar juntos, as palavras que teria para vos agradecer nunca seriam suficientes.
À minha supervisora, Christen Mirth, primeiro por me ter deixado ter esta aventura, sem ela, nada disto teria sido possível. Segundo, por ter puxado por mim, sabendo que só atingindo os meus limites seria capaz de ultrapassá-los. Terceiro por me ter ajudado na escrita da tese e ficar mais stressada do que eu com a data limite de entrega, esta tese seria muito pior se não tivesse tido todo o apoio proveniente dela. Quarto, por ser a pessoa brilhante e amigável que é, uma inspiração para
III
muitos e um modelo do que é ser um PI como deve ser. Espero um dia poder ser como ela, e que eu seja um motivo de orgulho para ela também.Por último, quero agradecer ao acaso, ou como outras pessoas o chamariam, destino, por ter sido aleatório da maneira certa, por ter reunido as condições ideais, e ter permitido que tudo isto acontecesse e que conhecesse todas estas pessoas.
Um muito obrigado a todos… André N. Alves
Abstract
Environments are spatially and temporally dynamic, which poses a particular challenge to organisms as they try to tune their development to optimise their traits for a given environment. For some traits, it is beneficial to alter traits according to environmental conditions – a process known as developmental plasticity. Other traits need to maintain constant phenotypes across environmental conditions, known as developmental robustness. Even though we understand some of the mechanisms that give rise to plasticity or robustness in traits, little is known of how these processes are coordinated within organs so that these structures can exhibit both plastic and robust phenotypes. In
Drosophila melanogaster, the wing development is well characterized and this organ displays both
plasticity, in the form of wing size, and robustness, in the form of wing pattern. Previous studies in wing have shown that although the final pattern of the wing is robust, the rates of patterning in this organ show considerable variation throughout the third larval instar. Signalling via the steroid moulting hormone ecdysone is known to regulate both wing disc growth and patterning. This raises the question; how can the same signalling pathway coordinate both plastic and robust developmental responses? In this study, we genetically ablated the prothoracic gland (PGX), the gland that produces ecdysone, to explore how ecdysone concentrations affect the growth and patterning of the wing imaginal disc. By feeding PGX larvae a range of ecdysone concentrations, we determined how ecdysone, growth and patterning interact. We show that ecdysone triggers different responses in different traits. Early in the third instar, growth responds linearly to increasing ecdysone concentrations. Further, we observe significant differences between sexes in the response to ecdysone, with ecdysone affecting growth rates in fed males, but only affecting wing growth of the female wing discs when they are starved of protein. Wing disc patterning, on the other hand, shows threshold responses to ecdysone early in the third instar, and these responses to not differ between sexes. At the very end of development, ecdysone concentration does not affect disc growth rates. However, it does affect the rate of patterning for both Achaete and Senseless. These data suggest that ecdysone coordinates plastic with robust developmental processes via differences in how these processes respond to the hormone, both in nature and time.
Key-words: Plasticity, Robustness, Ecdysone, Growth, Patterning, Wing imaginal disc, Drosophila
V
Resumo
Os ambientes são dinâmicos, quer temporalmente quer espacialmente. Devido a isto, os organismos têm de ter mecanismos que permitam ajustar-se às condições ambientais para poder sobreviver. Dependendo da característica em questão, os organismos podem alterar os seus fenótipos para melhor adaptar-se ao ambiente, habilidade conhecida como plasticidade fenotípica. Outras características podem ter mecanismos que permitam manter um fenótipo constante durante várias condições ambientais, conhecido como robustez fenotípica.
A plasticidade fenotípica foi profundamente estudada nos passados anos. Desde plantas que alteram a coloração das pétalas dependendo da composição do solo, até mamíferos como raposas, que alteram a coloração do pelo de forma a adaptar-se à estação do ano em que se apresentam. Os mecanismos moleculares que descrevem plasticidade foram extensamente estudados em Drosophila
melanogaster. Apesar desta espécie de insetos não ter a plasticidade no que toca ao tamanho, e forma
de corpo, que insetos sociais como formigas e abelhas têm, mudar o ambiente térmico ou nutricional, causa alterações no tamanho do corpo/órgão destas moscas-da-fruta. Como este inseto tem várias ferramentas genéticas disponíveis, torna-se um bom animal-modelo para estudar plasticidade.
Nesta espécie de drosofilídeo, o crescimento de órgãos e a taxa de crescimento são altamente reguladas pela cascata génica da insulina/alvo de rapamicina (Insulina/TOR). Insulina/TOR afeta também a duração do crescimento através da regulação da transição conhecida como peso crítico. A cascata génica insulina/TOR atua na glândula protorácica, a glândula responsável por produzir a hormona ecdisona. Esta hormona regula rigidamente o efeito da nutrição no crescimento de órgãos.
Robustez fenotípica é também importante para garantir que o fenótipo mantém-se igual ao longo de vários ambientes. A dominância em heterozigotos para a cor castanha dos olhos é um dos exemplos de robustez, visto que ter duas cópias ou apenas uma de um gene resulta no mesmo fenótipo. Em D. melanogaster, o disco genital é um bom exemplo de robustez, visto que muda pouco no seu tamanho relativamente ao resto do corpo quando submetido a gradientes nutricionais ou térmicos.
Em D. melanogaster, o padrão final de órgãos como a asa permanece constante ao longo de vários ambientes, e já foi demonstrado que a taxa de padronização é variável com condições ambientais. A hormona ecdisona é também importante neste processo. Isto demonstra que, apesar do padrão final ser robusto, a trajetória que leva ao estadio final tem de ser altamente plástica e afetada pela ecdisona. Como é que estes mecanismos, que conferem plasticidade e robustez a características do fenótipo, são coordenados, é algo ainda desconhecido.
Foi descrito em D. melanogaster o desenvolvimento do disco imaginal da asa no terceiro estadio larvar. Foi observado que, no desenvolvimento deste disco imaginal, há plasticidade no início do processo, na forma de trajetórias de padronização diferentes. Estas trajetórias são alteradas com diferenças na sinalização da hormona ecdisona ou até com diferenças ambientais, como temperatura. No entanto, existe também robustez, visto que mesmo que haja um atraso na padronização dos discos, estes assumem o estadio final de padronização no final do desenvolvimento.
Para tentar desvendar o funcionamento destes mecanismos, fizemos uso de larvas PGX. Estas larvas quando sujeitas a temperaturas superiores a 29°C, sofrem apoptose da glândula protorácica, e como consequência, são incapazes de produzir ecdisona. Administração de ecdisona na comida destas larvas resulta num resgatamento do fenótipo.
Utilizando estas larvas e comparando-as com duas linhas controlo, >grim e PG>, observamos o crescimento e a padronização dos discos imaginais das asas no início e no fim do desenvolvimento para tentar entender o funcionamento dos mecanismos que controlam plasticidade e robustez referidos
anteriormente. Observamos também o efeito da concentração da hormona ecdisona nestes processos e como é que altera a resposta quer do crescimento, quer da padronização.
Para entender estas respostas, tentámos enquadrar os melhores modelos que pudessem explicar os efeitos observados. Os modelos variavam entre um modelo linear e modelo-limite. O modelo linear é observado em várias cascatas génicas, como uma forma de aumentar ou diminuir o efeito da cascata. Já os modelos-limite são observados em várias reações que envolvem acionar ou suspender o funcionamento de cascatas génicas, funcionando como um botão bimodal.
Os nossos resultados demonstram que, no início do desenvolvimento, o crescimento dos discos imaginais não são afetados pela hormona ecdisona em fêmeas alimentadas numa dieta padrão. Já nos machos alimentados numa dieta padrão, o aumento da hormona ecdisona aumenta a taxa de crescimento dos discos. Em fêmeas que foram alimentadas apenas com sucrose, e cujas taxas de crescimento são significativamente menores, o aumento da concentração da hormona ecdisona, aumenta a taxa de crescimento dos discos até níveis semelhantes às larvas alimentadas numa dieta padrão.
Quanto à taxa de padronização, observámos que, apesar das larvas terem diferenças significativas quando alimentadas numa dieta padrão ou apenas sucrose, ambas respondem de formas semelhantes ao aumento de ecdisona. Aumentar a concentração desta hormona aciona uma resposta-limite, em vez de acionar uma resposta de aumento de taxa de padronização. O limite superior aumenta com o aumento da concentração da hormona, ou seja, aumento de ecdisona aumenta o estadio máximo que os discos imaginais conseguem atingir.
Nos últimos estadios do desenvolvimento observámos que o crescimento dos discos imaginais das asas continua sem ser afetado pela hormona ecdisona. Fornecer ecdisona a larvas alimentadas numa dieta padrão não altera significativamente a taxa de crescimento dos discos.
A padronização dos discos das asas no final do desenvolvimento tem uma resposta diferente dos estadios iniciais. As linhas controlo apresentam uma taxa de padronização exponencial, semelhante o suficiente com a resposta limite dos estadios iniciais. As larvas PGX, no entanto, apresentam uma taxa de padronização linear. Aumentar a concentração da hormona ecdisona, aumenta a taxa de padronização, mas esta mantém-se sempre linear.
Estes resultados demonstram que o tamanho da asa, que é uma característica altamente plástica, parece ser controlada por um processo robusto na sua resposta. Em fêmeas, na ausência de proteína, a hormona ecdisona pode resgatar a taxa de crescimento, mesmo que a sinalização da insulina/alvo da rapamicina (insulin/TOR) esteja inativa. A insulin/TOR é a cascata que promove crescimento em resposta a condições ambientais. A hormona ecdisona parece capaz de sobrepor a sua atividade sobre a atividade da cascata insulin/TOR para assegurar taxas de crescimento elevadas. Este processo é robusto também pelo facto de não ser alterado ao longo do desenvolvimento quando comparado com larvas alimentadas numa dieta padrão. Nos últimos estadios de desenvolvimento larvar, a hormona ecdisona continua sem produzir algum efeito em larvas alimentadas numa dieta padrão.
Por outro lado a padronização do disco imaginal da asa, que é uma característica robusta, parece ser regulada por um processo plástico. Este processo é alterado através das concentrações da hormona ecdisona. A hormona ecdisona é essencial para ativar a padronização nos discos imaginais das asas. As variações nas trajetórias de padronização que se observam em diferentes condições ambientais ou genéticas podem ser resultado duma alteração do primeiro pico de ecdisona no terceiro estadio larvar. Este pico pode ser alterado no seu tempo de aparecimento ou até mesmo na concentração de hormona libertada, ativando respostas-limite para limites diferentes, o que resulta em várias trajetórias de padronização.
No final do desenvolvimento, caso haja discos com padronização atrasada, uma rápida taxa de padronização causada por uma resposta-limite, seria uma boa estratégia para manter a robustez
VII
desta característica. O ultimo pico de ecdisona no terceiro estadio larvar pode ser em concentrações suficientes que não só aumentam a taxa de padronização, como foi observado, mas pode eventualmente transformar uma resposta linear numa resposta-limite como a observada nos genótipos controlo.Este estudo revelou várias interações entre o crescimento dos órgãos e a sua padronização que não eram conhecidas antes. A forma como a plasticidade e robustez de características fenotípicas é mantida através de processos de desenvolvimento plásticos ou robustos ainda tem questões por responder. Analisar estadios intermédios de desenvolvimento ou manipular a expressão de ecdisona e insulina no disco da asa levará a uma maior compreensão de como é que estas cascatas interagem com o crescimento e padronização. Levará também a um entendimento maior de como é que estas interações são diferentes entre os sexos.
Palavras-Chave: Plasticidade, Robustez, Drosophila melanogaster, disco imaginal da asa, crescimento, padronização, ecdisona
Index
1. Introduction ... 1
2. Materials and Methods ... 8
2.1. Fly Stocks and Rearing Conditions... 9
2.2. Larval Staging ... 9
2.3. Dissections and Immunocytochemistry ... 9
2.4. Quantification of gene pattern ... 10
2.5. Statistical Analysis ... 10
3. Results ... 11
3.1 – Exploring the effects of ecdysone concentration in wing disc growth and patterning in early third instar stages ... ………...12
3.2 – Exploring the relationship between ecdysone concentration, wing disc growth and wing disc patterning in late third instar stages ... 21
4. Discussion ... 30
4.1 – Exploring the effects of ecdysone concentration in wing disc growth and wing disc patterning in early third instar stages ... 31
4.2 – Exploring the relationship between ecdysone concentration, wing disc growth and wing disc patterning in late third instar stages ... 32
4.3 - Future Directions ... 33
5. Conclusions ... 34
6. Bibliography ... 36
IX
List of figures and tables
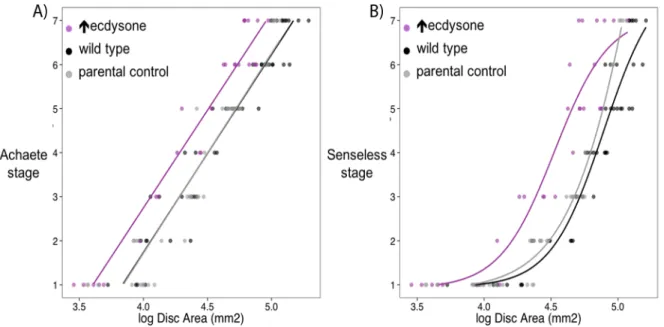
Figure 1.1: Achaete and Senseless differ in their relationship with disc size. A) The relationship between Achaete stage
and log10 Disc Area best fits a linear model. B) The relationship between Senseless stage and log10 Disc Area is best fit with
a threshold function: the four-parameter logistic Hill’s function. In both A and B, black symbols are wild type (Samarkand) lines, grey are UAS InR parental controls, and purple are phantom GAL4>UAS InR larvae which are known to have increased rates of ecdysone synthesis (Mirth et al., 2009)………...………3
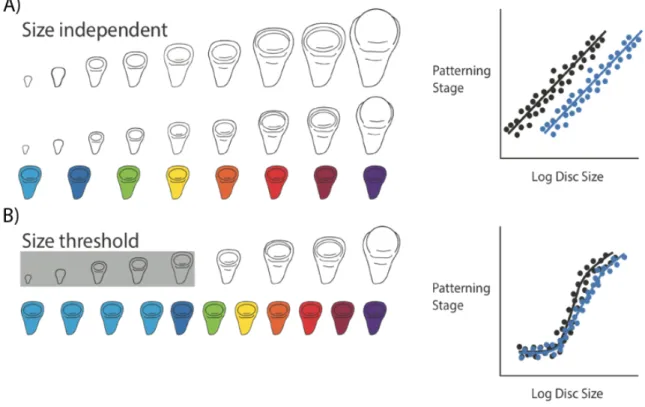
Figure 1.2: Two hypotheses for the relationship between disc size and disc pattern throughout third instar development. (A) Hypothesis 1 (Size independent): discs pattern independently of size. This would mean that discs with
different growth rates (shown in black and blue in the graph) will reach the same patterning stage at different disc sizes. (B) Hypothesis 2 (Size threshold): discs have to reach a specific size for patterning to progress. Once the size threshold is reached, patterning will switch on and progress rapidly……….……….4
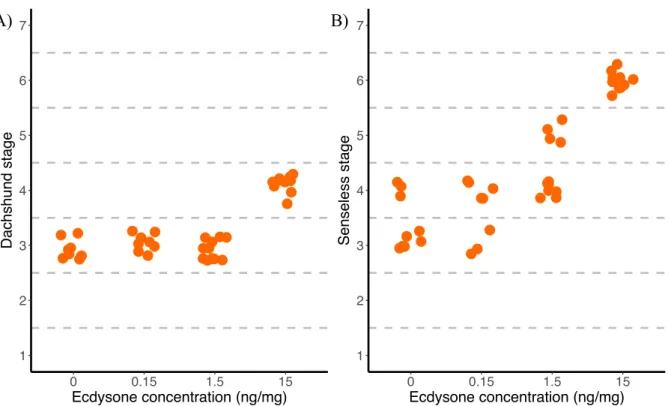
Figure 1.3: Dachshund and Senseless show differences in sensitivity to ecdysone. Larvae in which the prothoracic gland
has been genetically ablated (PGX) to eliminate ecdysone production were fed on a range of ecdysone concentrations starting 55 h after third instar ecdysis. Their wing discs were then dissected 24 h later and stained for Dachshund (A) or Senseless (B). A) shows the relationship between ecdysone concentration and Dachshund stage. B) shows the relationship between ecdysone concentration and Senseless stage……….……….5
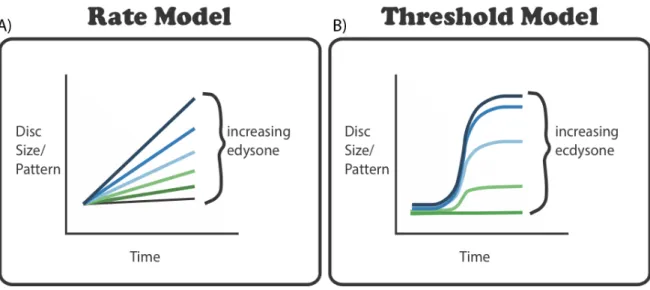
Figure 1.4: Alternative models explaining how developmental processes respond to ecdysone. (A) In a rate model
hypothesis, increasing ecdysone will increase the growth or patterning rate across time; (B) In a threshold model hypothesis, ecdysone induces a threshold response for disc growth or patterning, which higher concentrations generating more advanced pattern………...………7
Figure 3.1: Growth rates of wing discs for fed and starved control larvae. (A) Growth rates for >grim (black lines) and
PG> (grey lines) females. Solid lines and circles represent fed females, dashed lines and triangles represent starved females.
Starved females have lower growth rates than fed females. (B) Growth rates for >grim (black line) and PG> (grey line) males. Both controls have high growth rates……….……….………...……13
Table 3.1: Comparisons in the response of log10 disc area to time and genotype, for males, or time, genotype and food,
for female control larvae……….….14 Table 3.2: Comparisons in the response of log10 disc area to time and ecdysone, for males, or time, ecdysone and food,
for female PGX larvae……….…14 Figure 3.2: The effect of ecdysone on growth rates of the wing discs for starved and fed PGX larvae. (A) Disc area
(log10) over time for fed (solid line and circles) and starved (dashed line and triangles) female PGX larvae. (B) Disc area
(log10) over time for fed PGX males. Numbers above the graphs and in the legend refer to ecdysone concentrations. (ng/mg
of diet)………15
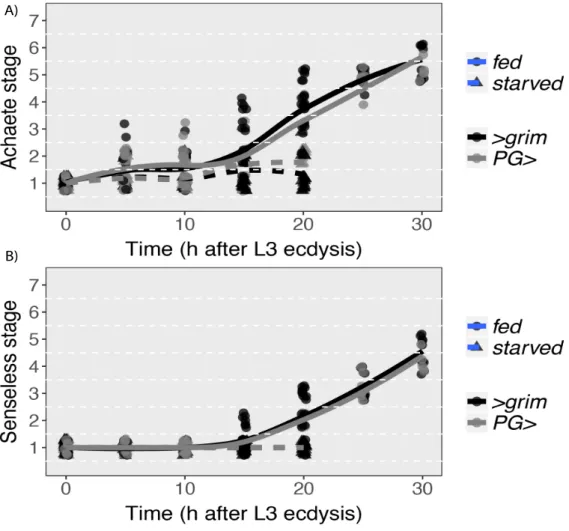
Figure 3.3: Achaete and Senseless patterning rates in wing discs of fed and starved female control larvae. (A) Achaete
stage over time for >grim (black lines) and PG> (grey lines) for both fed (full lines and circles) and starved (dashed lines and triangles). (B) Senseless stage over time for >grim (black lines) and PG> (grey lines) for fed (full lines and circles) and starved (dashed lines and triangles). Both >grim and PG> starved animals have the same senseless stages.………..………...………16
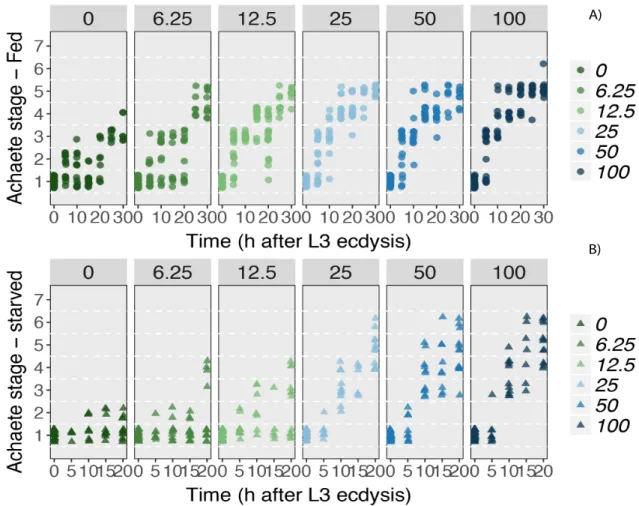
Table 3.3: Comparisons in the response of Achaete stage to time and ecdysone, for male, or time, ecdysone and food, for female PGX larvae………..………...……17 Table 3.4: Comparisons in the response of Senseless stage to time and ecdysone, for male, or time, ecdysone and food, for female PGX larvae……….…...……….17 Fig. 3.4: The effects of ecdysone concentration on Achaete patterning rates in the wing discs fed and starved PGX larvae. (A) Achaete stage over time for fed PGX females. (B) Achaete stage over time for starved PGX females. Numbers
above the graphs and in the figure legends refer to ecdysone concentrations (pg/mg of diet)………..18
Fig.3.5: The effect of ecdysone concentration on Senseless patterning rates in the wing discs of fed and starved PGX females. (A) Senseless stage over time for fed female PGX larvae. (B) Senseless stage over time for starved PGX females.
Fig.3.6: Achaete and Senseless patterning rates for male control larvae. (A) Achaete stage over time for >grim (black
line) and PG> (grey line) males. (B) Senseless stage over time for >grim (black line) and PG> (grey line) males………...19
Fig.3.7: The effect of ecdysone concentration on Achaete and Senseless patterning rates in the wing discs of PGX males. (A) Achaete stage over time for PGX males. (B) Senseless stage over time for PGX males. Numbers above the
graphs and in the figure legends refer to ecdysone concentrations (ng/mg of diet)……….……..19
Table 3.5: Analysis of Variance Table (ANOVA) from the comparison between models, for fed and starved PGX larvae, comparing the fit of linear models versus Hill’s function models for the response of Achaete stage (top) and Senseless stage (bottom) to time for a range of ecdysone concentrations………...21 Fig.3.8: Growth and patterning in the wing discs after prothoracic gland ablations (PGX) at 28 and 55 h AL3E compared to >grim larvae. (A) Disc area (log10) over time for PGX (green circles) and >grim (black circles) larvae. (B)
Achaete stage over time for PGX (green circles) and >grim (black circles) larvae. (C) Senseless stage over time for PGX (green circles) and >grim (black circles) larvae. All >grim larvae pupariated between 55+16 and 55+24 hours AL3E………...……22
Table 3.6: Comparisons in the response of log10 disc area to time, sex and genotype after prothoracic gland ablation
at either 28 or 55h AL3E. ………...………22 Table 3.7: Comparisons in the response of Achaete or Senseless stage to time, sex and genotype after prothoracic gland ablation at either 28 or 55h AL3E.………..………….……23 Fig.3.9: Comparing the growth and patterning of the wing discs in prothoracic gland ablations (PGX) at 55 h AL3E to control genotypes. (A) Disc area (log10) for PGX (green), >grim (black) and PG> (grey) female and male larvae. (B)
Achaete stage over time in PGX (green), >grim (black) and PG> (grey) female and male larvae. (C) Senseless patterning rates for PGX (green), >grim (black) and PG> (grey) genotypes. All control larvae pupariated between 55+16 and 55+24 hours………...………..…..23
Table 3.8: Comparisons in the response of log10 disc area to time, sex and genotype for prothoracic gland ablations at
55h AL3E without ecdysone supplement………...………24 Table 3.9: Comparisons in the response of Achaete or Senseless stage to time, sex and genotype for prothoracic gland ablations at 55h AL3E without ecdysone supplement……….……….24 Fig.3.10: Growth rates in the wing discs after prothoracic gland ablation (PGX) at 55h AL3E and controls, >grim and PG> . (A) Disc area (log10) over time for PGX (green), >grim (black) and PG> (grey) female larvae. (B) Disc area (log10)
over time for PGX (green), >grim (black) and PG> (grey) male larvae. Numbers above the graphs refer to ecdysone concentration (pg/mg of diet)………..…………...………25
Table 3.10: Comparisons in the response of log10 disc area to time, ecdysone and genotype both for females (top) and
males (bottom) with 0 and 15ng/mg of ecdysone after prothoracic gland ablation at 55h AL3E…………...………….26 F Fig.3.11: Achaete patterning rates after prothoracic gland ablation (PGX) at 55 h AL3E and in control larvae, >grim and PG>. (A) Achaete stage over time in PGX female (solid line and circles) and male (dashed line and triangles)
larvae. (B) Achaete stage over time in >grim (black) and PG> (grey) female (solid lines and circles) and male (dashed lines and triangles) larvae. Numbers above the graphs refer to ecdysone concentrations (pg/mg of diet)………27
Fig.3.12: Senseless patterning rates in prothoracic gland ablations (PGX) at 55 h AL3E and controls, >grim and PG> larvae. (A) Senseless stage over time in PGX female (solid line and circles) and male (dashed line and triangles) larvae. (B)
Senseless stage over time in >grim (black) and PG> (grey) female (solid lines and cirlces) and male (dashed lines and triangles) larvae. Numbers above the graphs refer to ecdysone concentrations (pg/mg of diet)…...………28
Table 3.11: Comparisons in the response of Achaete (top) or Senseless (bottom) stage to time, ecdysone and sex after prothoracic gland ablation at 55h AL3E………29 Supplemental Figure 1: Patterning scheme from Oliveira et al., 2014. Differences in gene expression of six different
genes (Achaete, Senseless, Daschund, Cut, Notch and Wingless) throughout development of Drosophila melanogaster from moult to L3 stage (Stage A) to white pre-pupae (Stage K). For the experiments, only Achaete and Senseless patterning progressions were used………...43
XI
List of abbreviations and symbols
PGX – Prothoracic gland ablated TOR – Target of rapamycin >grim - UAS grim
PG> - phmGAL4
EGF – Epidermal growth factor MS – Methionine synthase
MTHFR – Methylenetetrahydrofolate reductase DNA - Desoxyribonucleic acid
DNMT – DNA methylation reaction Dpp – Decapentaplegic
AL3E – After L3 ecdysis SYA – Sugar-yeast-agar g – gram
°C – Celsius degree
PBS – Phosphate-buffered saline
PBT – Phosphate-buffered saline with Triton ANOVA – Analysis of variance
ng – nanogram mg – milligram
dILP – Drosophila insulin like peptides mRNA – Messenger ribonucleic acid
1
1.
Introduction
All environments are dynamic, either temporally or spatially. Because of this, animals and plants have mechanisms that allow them to adjust to their environmental conditions in order to survive. Depending on the trait in question, organisms can change their phenotypes to better fit their environment, known as phenotypic plasticity (Moczek et al., 2011), or they can have inbuilt mechanisms that allow them to maintain phenotypes constant over a range of environmental conditions, called robustness. Whether a trait changes or remains constant in response to environmental variation depends on the nature of the trait in question. Further, a single organ can exhibit both plastic and robust traits. A multitude of studies have uncovered the genetic mechanisms that allow traits to be plastic in response to environmental variation. Similarly, both theoretical and genetic studies have demonstrated mechanisms underlying trait robustness. However, few studies have explored how organs coordinate their development to allow plasticity in some traits, while maintaining the robustness of others.
In an environment in constant change, plasticity is vital for survival. Phenotypic plasticity allows an organism, with its own singular and unique genotype, to present a variety of phenotypes, each of which depends on the environmental context during development. Phenotypic plasticity has been documented in virtually every type of organism, from plants such as Hydrangea macrophylla that changes petal colours depending on the amount and kind of heavy metals in the soil (Oyama et al., 2015), to mammals, such as foxes that change fur colour from orange to white depending on the season (Hart, J. 1956). Being able to express these plastic traits is essential to cope with a temporally or spatially changing environment.
Many of the most impressive examples of phenotypic plasticity are found in insects. Social insects in particular present striking examples, remodelling their development in response to key environmental variables. Ant species such like Pheidole rhea develop into one of several castes, either workers, soldiers, or queens, depending on the nutrition they are given in their growth phase, the larval stage (Huang et al., 2013). In the African butterfly Bicyclus anynana, seasonal cues during development alter the colour patterns of the wings to generate large eyespots in the wet season and small eyespots in the dry (Brakefield et al., 2007). Although these insects present dramatic examples of plasticity, understanding the genetic mechanisms regulating this plasticity is limited by the narrow range of genetic tools available in these species.
The molecular mechanisms underlying plasticity have been best described in the fruit fly
Drosophila melanogaster, thanks to its impressive genetic toolkit. Although D. melanogaster does not
present the dramatic alterations in body size and shape found in ants, plasticity in body/organ size induced by changing thermal and nutritional environments has received significant attention over the past 15 years. In D. melanogaster, body and organ size varies with nutritional availability (Beadle et al., 1938, Robertson, 1963). Nutrition affects body size in two ways, by regulating growth rate or regulating the duration of growth (Nijhout 2003; Mirth & Riddiford, 2007; Shingleton et al 2008).
The insulin/target of rapamycin (TOR) pathway, conserved in all animals, regulates growth rates of the body and its organs in response to nutrition (Shingleton, 2010). In addition, insulin/TOR regulates the duration of growth by controlling the timing of an important developmental transition known as critical weight (Shingleton et al 2005, Mirth et al 2005, Koyama et al 2014). Animals starved before critical weight delay the onset of metamorphosis. After critical weight, starvation induces mild acceleration in pupariation.
Insulin/TOR regulates this transition by acting on the prothoracic gland, the gland responsible for producing the steroid moulting hormone ecdysone. Ecdysone peaks three times during the third instar before a fourth peak induces pupariation (Warren et al, 2006). Reducing insulin/TOR signalling
3
in the prothoracic gland represses the first of these peaks, thereby extending the larval phase (Mirth et al 2005, Koyama et al 2014).In addition to its effects on developmental timing, the ecdysone peak that induces critical weight also alters the effect of nutrition on organ growth. Starving D. melanogaster larvae of yeast before critical weight represses growth of both the wing imaginal disc, the pouch of cells that will give rise to the adult wing and notum, and the developing ovary more than starvation after critical weight (Shingleton et al., 2008, Mendes & Mirth, 2016). This is not simply a peculiarity of D.
melanogaster wing disc growth. In Manduca sexta, growth in the wing imaginal discs is more
sensitive to nutrition before critical weight than after (Tobler & Nijhout 2010).
In the ovary of D. melanogaster, differences in the effect of nutrition before and after critical weight result from a change in how ovary growth is regulated (Mendes & Mirth, 2016). Whereas insulin/TOR regulates most of the growth of the ovary before critical weight, both insulin/TOR and ecdysone contribute to ovary growth after (Mendes & Mirth 2016). A similar mechanism is thought to act in the wing disc, as ecdysone plays an important role in regulating the growth of wing discs after critical weight (Ghosh et al., 2013, Herboso et al., 2015).
Whereas the ability to alter phenotypes like organ or body growth in response to environmental conditions is clearly beneficial, other phenotypes need to remain the same across different environments. This is called phenotypic stability or robustness (Nijhout et al. 2017). Examples of this include many types of enzymatic reactions. Substrates can be converted to their final compounds via several pathways, each pathway with its own unique properties (Felix and Wagner, 2006). Since this conversion starts from the same substrate and ends with the same product, these alternative pathways convey robustness to this process. This becomes important when one branch of an enzymatic cascade fails to function, due to a mutation or lack of cofactors. Alternative branches of this pathway that can execute the same reaction ensure the final product is produced, vital if this product is necessary for proper cell function. Thus, phenotypic robustness exists not due to an unchangeable state, but because the properties of systems change dynamically to ensure the phenotype remains constant.
Other types of processes generate phenotypic robustness. Dominance in heterozygotes is also an example of robustness, since having either one or two copies of a gene results in the same
Figure 1.1: Achaete and Senseless differ in their relationship with disc size. A) The relationship between Achaete stage
and log10 Disc Area best fits a linear model. B) The relationship between Senseless stage and log10 Disc Area is best fit
with a threshold function: the four-parameter logistic Hill’s function. In both A and B, black symbols are wild type (Samarkand) lines, grey are UAS InR parental controls, and purple are phantom GAL4>UAS InR larvae which are known to have increased rates of ecdysone synthesis (Mirth et al., 2009).
phenotype (Kacser and Burns, 1981), for example brown eyes result from a single copy of the allele that confers brown colour to eyes. Another example, in Caenorhabditis elegans the vulva’s final cell fate pattern is highly robust. LIN-3/epidermal growth factor (EGF) is necessary for specifying the cells of the vulva (Hill & Sternberg, 1992). A four-fold reduction in genetic dosage of LIN-3 still results in proper vulval induction (Barkoulas, et al., 2013). Finally, in D. melanogaster the genital disc changes little in size relative to the rest of the body across thermal or nutritional gradients (Shingleton et al., 2009). This occurs because the pathway that makes organs sensitive to nutritional variation, the insulin/TOR signalling pathway, is altered specifically in this organ such that insulin/TOR signalling remains high in this tissue even when the animal is starved (Tang et al., 2011). Even for traits that are robust, the capacity for phenotypic robustness is not indefinite. Although robust traits tend to vary little within a range of genetic backgrounds or environmental conditions, outside this range phenotypic variability can increase rapidly (Nijhout et al., 2014). This is the case of the methionine synthase (MS) and methylenetetrahydrofolate reductase (MTHFR) enzymes, both involved in the DNA methylation reaction (DNMT). Genetic variation can reduce the activity of these two enzymes up to 30% without significantly altering the rate of the DNMT reaction. However, when faced with an environmental change in the form of a deficiency for vitamin B12, a cofactor for MS, genotypes with reduced MS or MTHFR activity are unable to maintain constant rates of DNMT reactions (Nijhout et al., 2017). This shows that the range of conditions that a process remains robust depends on complex interactions between genetic variation and environmental conditions.
Although these studies explore the mechanisms and limitations of trait robustness, they do not address how single organs coordinate developmental processes that lead to trait plasticity, like
Figure 1.2: Two hypotheses for the relationship between disc size and disc pattern throughout third instar development. (A)
Hypothesis 1 (Size independent): discs pattern independently of size. This would mean that discs with different growth rates (shown in black and blue in the graph) will reach the same patterning stage at different disc sizes. (B) Hypothesis 2 (Size threshold): discs have to reach a specific size for patterning to progress. Once the size threshold is reached, patterning will switch on and progress rapidly.
5
growth, with those that lead to trait robustness, like patterning. The wings of D. melanogaster may vary in size, depending on the developmental environmental of the larva, but the structures of the wing, such as the vein number and position and the position of sensory bristles, are invariant. These structures are not established by a single robustness gene, but rather by a series of patterning gene products, such as Achaete, Senseless, and Decapentaplegic (Dpp) (Restrepo et al., 2014), that interact with each other and also with hormones, such as ecdysone (Nijhout et al., 2007), to specify cell fates. In D. melanogaster, the robustness of patterning in wing imaginal discs is determined by several factors, one of them a gradient of Dpp, that acts as a morphogen to pattern the organ (Teleman & Cohen 2000). Without this Dpp gradient, the wing imaginal disc is unable to activate the proper genes to progress in its patterning, and therefore will not develop into a functional wing. Further, hormones, most notably ecdysone, ensure that patterning events occur at the appropriate time in the wing (Mirth et al., 2009, Schubiger & Truman 2000, Schubiger et al., 2005). Thus, the regulation of pattern at several levels ensures that at the end of development the wing is correctly patterning, bearing all the correct structures and ensuring the robustness of this trait.Although the final pattern of organs like the wing remains constant across environmental conditions and across wild type genetic backgrounds, the rate of patterning has been shown to vary with environmental conditions, physiological conditions, and genetic background. Starving larvae of yeast before they reach critical weight induces substantial delays in the patterning of both the wing and the ovary (Mirth et al., 2009, Mendes and Mirth, 2016). The peak of ecdysone at critical weight mediates this transition. Activating ecdysone signalling in the wing discs or ovaries of yeast-starved larvae allows organ patterning to progress (Mirth et al., 2009, Mendes and Mirth, 2016). These findings highlight that even though the final pattern is robust, the trajectory to reach that final state can be highly plastic and is affected by ecdysone signalling.
Given that wing size and wing pattern are both regulated by ecdysone during larval development, how are the developmental processes that govern each coordinated to ensure that wings
1 2 3 4 5 6 7 0 0.15 1.5 15 Ecdysone concentration (ng/mg) Dachshund stage 1 2 3 4 5 6 7 0 0.15 1.5 15 Ecdysone concentration (ng/mg) Senseless stage
Figure 1.3: Dachshund and Senseless show differences in sensitivity to ecdysone. Larvae in which the prothoracic gland
has been genetically ablated (PGX) to eliminate ecdysone production were fed on a range of ecdysone concentrations starting 55 h after third instar ecdysis. Their wing discs were then dissected 24 h later and stained for Dachshund (A) or Senseless (B). A) shows the relationship between ecdysone concentration and Dachshund stage. B) shows the relationship between ecdysone concentration and Senseless stage.
are correctly patterned independent of their size? One approach to understanding how plastic and robust developmental responses are coordinated is to examine the extent to which patterning is coordinated with other developmental processes, such as organ growth or developmental time of the whole body. In the buckeyed butterfly, Precis coenia, wing disc patterning, as measured by the extent of lacuna development and of tracheation, occurs independently of wing disc growth (Miner et al., 2000). These studies would lead us to conclude that patterning and growth in the wing disc are independent processes.
More recently, Oliveira and colleagues (2014) tested to what extent patterning of the wing disc was coordinated with developmental events that regulate developmental timing across the whole body in D. melanogaster. To do this, they developed a system for quantifying the patterning stage of the wing disc using the changes in expression domains of six patterning gene products, including Achaete and Senseless (Oliveira et al., 2014) (Figure 1.1). They calibrated their scheme to whole body developmental events: moulting to third instar (L3 stage), wandering, when the larvae emerge from the food to find a pupariation site, and pupariation. They then generated environmental or hormonal variation, by changing temperature or examining genotypes that varied in their rates of ecdysone synthesis. Comparing the rates of patterning across these conditions, they found that patterning stage was invariant at two developmental events: at the moult to the third instar and at pupation (Oliveira et al., 2014). Between these events, the rates of patterning varied significantly. This study illustrates that although patterning does not depend strictly on the mechanisms that regulate developmental time throughout the entire third instar, it is coordinated with whole body development at key developmental milestones.
From this study, two questions arose: a) what generates variation in patterning and b) given the variation in patterning rates, what ensures that patterning is invariant at pupariation? As a first attempt to understand what gives rise to variation in patterning rate, we explored the relationship between disc size and disc patterning. Because we know that disc size and pattern both rely on ecdysone signalling, variation in patterning rate across conditions might be generated by variation in disc growth across the third instar. This led to two hypotheses: 1) that disc pattern was independent of disc size, as has been described for P. coenia, (Fig 1.2A) or 2) that discs need to attain a minimal threshold size for patterning to progress (Fig 1.2B).
Preliminary data collected by Dr. Marisa Oliveira suggests that the relationship between disc size and disc pattern differs between patterning gene products (Fig1.1). When comparing the disc size/disc pattern relationships in the wing disc using two patterning gene products, Achaete and Senseless, Dr. Oliveira found that Achaete stage increases linearly with increasing size (Fig. 1.1A). Increasing the rate of ecdysone synthesis shifted the disc size/disc patterning relationship to the right but the relationship remained linear (Fig.1.1A). This suggests that Achaete patterning progresses independently of disc size. Senseless, on the other hand, shows a threshold response, where patterning only occurs once the disc has reached a certain size (Fig. 1.1B). Increasing the rate of ecdysone synthesis shifts the disc size threshold to earlier in development, meaning that wing imaginal discs switch on patterning at smaller sizes (Fig.1.1B). These data support a size threshold model for the disc size/disc pattern relationship. These data suggest two things: 1) that patterning gene products differ in their relationship with wing disc size and 2) that ecdysone regulates patterning progression for both Achaete and Senseless. This difference in how Achaete and Senseless respond to disc size and to ecdysone potentially highlights a mechanism for generating variation in patterning rate.
The second question arising from the Oliveira et al (2014) study is once variation in patterning is generated, how do discs alter their rates of patterning to ensure that they all reach the same final stage at pupariation? Dr. Oliveira’s preliminary data suggest that ecdysone may play a role
7
in ensuring that all discs reach the correct patterning stage at pupariation. She genetically ablated the prothoracic gland (PGX), to eliminate ecdysone production and fed these larvae a range of concentrations of ecdysone starting at 55 h after third instar ecdysis (AL3E) (Figure 1.3). She then dissected out the discs and performed immunocytochemistry for two patterning gene products, Dachshund and Senseless. She found that Senseless required less ecdysone to change between stages than Dachshund (Figure 1.3). We thus hypothesized that both the variation in patterning rate generated at earlier stages of development and the coordination of pattern at the end of development both depend on how patterning gene products respond to ecdysone.To test these hypotheses, we explored how wing disc growth and wing disc patterning responded to concentrations of ecdysone at both early stages and later stages of the third instar. We compared how disc growth and disc patterning responded to ecdysone using one of two models. Ecdysone could either regulate the rates of growth and patterning, with changes in ecdysone changing the slope of this relationship (Fig. 1.4A) or growth and patterning could respond to ecdysone in a threshold manner (Fig. 1.4B). This would mean that the lowest ecdysone concentrations would not induce patterning, but higher amounts of ecdysone would trigger a switch-like response (Fig.1.3B). Changes in how disc growth rates and patterning gene products respond to ecdysone across developmental stage could explain how variation in patterning rate early and coordination of patterning late in the third instar occur. Furthermore, differences in how disc growth and disc patterning respond to ecdysone will highlight how the same developmental hormone can generate both plastic and robust traits within the same organ. Taken together, these studies will shed insight into how plasticity and robustness are coordinated to give rise to a fully functional organs or organisms across a range of environmental conditions.
Figure 1.4: Alternative models explaining how developmental processes respond to ecdysone. (A) In a rate model
hypothesis, increasing ecdysone will increase the growth or patterning rate across time; (B) In a threshold model hypothesis, ecdysone induces a threshold response for disc growth or patterning, which higher concentrations generating more advanced pattern.
2.
Materials and Methods
You have brains in your head. You have feet in your shoes. You can steer yourself any direction you choose. – Dr. Seuss
9
Fly Stocks and Rearing Conditions
We used a transgenic combination that allowed us to ablate the prothoracic gland to eliminate native ecdysone synthesis specifically in the third larval instar. We crossed the progeny from
tub-GAL80ts, phm GAL4 with UAS Grim (phm>Grim, PGX) (Herboso et al., 2015). GAL80ts is a repressor of GAL4 active at temperatures lower than 22ºC (Suster et al., 2004). Rearing larvae at 17ºC maintain GAL80ts activity, ensuring that the phmGAL4, expressed specifically in the prothoracic gland, cannot drive the expression of UAS grim, a cell death gene. Under these conditions, the prothoracic gland does not undergo programmed cell death, and the larvae can moult, pupariate, and complete metamorphosis (Herboso et al., 2015). Changing the larval rearing temperature to 29ºC disables GAL80ts activity, thus ablating the prothoracic gland. The progeny of an isogenic wild-type strain, w1118, crossed with one of two parental lines, either phm-GAL4 (PG>) or UAS Grim (>grim), were
used as controls for genetic background effects. The parental controls were reared under the same thermal conditions as PGX larvae.
Crosses, egg collections, and larval rearing were done on Sugar-Yeast-Agar (SYA) medium with 20% extra water. This medium consists of 50g of autolysed Brewer’s yeast powder (MP Biomedicals), 100 g of sugar, 10 g of agar and 1200 ml of water. In addition, we added 3 ml of propionic acid and 3 grams of nipagen to prevent bacterial and fungal growth.
Egg collections were performed on SYA medium for 4 hours at 25°C or overnight at 17°C and larvae were reared at controlled densities of 200 eggs per food plate (60 x 15 mm Petri dish filled with SYA medium) at 17°C, as described previously (Herboso et al., 2015).
Larval Staging
For the PGX, PG>, and >Grim genotypes, larvae were raised from egg to second instar at 17°C. Larvae were staged into 2-hour cohorts at ecdysis to the third larval instar by flooding the food plate with 20% sucrose and transferring all the second instar larvae to a new food plate. After two hours, the food plate was flooded once again with 20% sucrose and the newly moulted third instar larvae were collected and transferred to food plates at 29°C at the desired time interval.
For early shift experiments, newly ecdysed larvae were separated into males and females, and then transferred at 0 h AL3E to 29°C and fed either a SYA medium or a 20% sucrose in 1% agar medium without additional yeast. Larval wing discs were sampled at the following times: 0, 5, 10, 15, 20, 25, 30h AL3E. The active form of ecdysone, 20-hydroxyecdysone (Sapphire Bioscience, catalogue #16145), was added to the different foods in the following concentrations (in ng/mg of SYA or sucrose medium): 0, 6.25, 12.5, 25, 50, 100 ng/mg of food.
For late shift experiments, newly ecdysone L3 larvae were separated into males and females and returned to 17°C for an additional 28 or 55 h, after which they were transferred to 29°C for the following times (in h AL3E): 28+0, 28+24, 55+0, 55+8, 55+16, 55+24h AL3E. Ecdysone was added to the food in the following concentrations: 0, 0.15, 1.5, 15ng/mg of food.
Dissections and Immunocytochemistry
For each time point sampled, at least 10 larvae were dissected in ice cold PBS and fixed in 4% formaldehyde in PBS overnight at 4°C. The number of discs varied depending on the treatment/genotype, ranging from 5 to 26 discs. After fixation, the tissue was washed four times (15 minutes per wash) with 0.3% Triton X-100 in PBS (PBT), then blocked for 30 minutes at room temperature in 2% heat-inactivated normal donkey serum in PBT. After blocking, the tissue was incubated in a primary antibody solution diluted with 2% heat-inactivated normal donkey serum in PBT overnight at 4°C. The washing and blocking procedure was repeated after primary antibody incubation and then the tissue was incubated in a secondary antibody overnight at 4°C. The tissues were washed with PBT and rinsed with PBS and then the wing imaginal discs were mounted on poly-L-lysine-coated coverslips using Fluoromount-G (SouthernBiotech). Tissues were imaged using a Nikon confocal microscope and processed using ImageJ (version 2.0) and Adobe Photoshop CC 2017.
The primary antibodies used to stain wing-imaginal discs were: anti-Senseless (Nolo et al., 2000, 1:1000) and anti-Achaete (supernatant, 1:10). The secondary antibodies used were: anti-guinea pig (546nm) and anti-mouse (488nm). To compare signal across tissues, we stained for both antigens simultaneously.
Quantification of gene pattern
The expression stage of each of the gene products was quantified using the staging scheme developed by Oliveira et al., 2014, associating each of the wing imaginal discs to an Achaete or Senseless stage varying from 1 to 7 according to its expression pattern (Supplemental Figure 1).
For wing disc size, the wing disc area was measured by defining the disc perimeter, through use of the software ImageJ (version2.0).
Statistical Analysis
For all experiments, the data were first fit with linear models using either log10-transformed disc area or gene stage as the dependent variable, time as the independent variable and factors such as sex, genotype, food, and ecdysone concentration as fixed effect factors. To test between the rate and the threshold models for growth and patterning, we fit the data with both linear models and four parameter logistic (Hill’s function) models. We used ANOVA to test whether the logistic models significantly improved the fit to the data. Data analysis and statistics were conducted using RStudio (version 1.0.143).
11
3.
Results
Sometimes the questions are complicated and the answers are simple – Dr. Seuss
The primary aim of this study was to determine how ecdysone controls both plasticity of growth while maintaining robustness of pattern. To address this question, we examined the effects of ecdysone on the growth and patterning of the wing discs both at the onset of third instar development, where growth and patterning rates show sensitivity to nutrition, and at the end of the third instar, when growth ceases and patterning stage becomes invariant across environmental conditions. By comparing how wing discs respond to ecdysone at these two stages of development we can gain insight into how variation in patterning and growth is generated, and into how patterning is coordinated at the end of larval development.
3.1 – Exploring the effects of ecdysone concentration in wing disc growth and
patterning in early third instar stages
To assess the effect of ecdysone on growth and patterning at the onset of the third instar, we generated variation in growth rates of the disc by rearing larvae on one of two different diets, standard food (SYA medium) and a starvation medium consisting of 20% sucrose (w/v) and 1% agar, which starves larvae of yeast but does not deprive them of calories. We analysed wing disc growth and wing disc patterning separately for male and female larvae, to account for known differences in disc growth between sexes (Testa et al., 2013). Control genotypes, >grim and PG>, were staged at the moult to third instar then separated into males and females. Females were reared on either standard food or starvation medium, males were reared on standard food alone. PGX larvae were also staged to the third instar then separated into males and females. We performed more detailed analysis on female larvae, using the males as a comparison. Females were transferred to either standard food or starvation medium supplemented with one of six different ecdysone concentrations (0, 6.25, 12.5, 25, 50, 100 ng/mg of diet). Males were only transferred to standard food, and this food was supplemented with one of the six concentrations of ecdysone outlined above. For all genotypes, we collected wing discs at defined intervals between 0 and 30 hours after the moult, processing these discs for immunocytochemistry against Achaete and Senseless to assess the progression of pattern.
The effects of ecdysone concentrations on wing disc growth early in the third
instar
Wing imaginal discs are known to grow exponentially in the early third instar. To be able to compare disc growth rates across conditions and genotypes, we log10 transformed disc area, thereby linearizing the data, and examined the relationship with log10 disc area over time. We then used ANOVA to compare disc growth between genotypes and conditions. Significant interactions between either diet type and time or ecdysone concentration and time indicate differences in disc growth rates between these conditions.
For the control genotypes, >grim and PG>, under standard food conditions the discs grow linearly with time for both the female and male larvae (Fig. 3.1). However, in starved female larvae wing discs do not grow, differing significantly in growth rate from wing discs from fed females (Fig. 3.1, Table 3.1). These results are similar to previously published data showing that starving larvae early in the third instar, before they have reached critical weight, impedes most disc growth. (Shingleton et al., 2008). For females there is a slight but significant effect of genotype on growth rates, and the interaction between time, genotype, and diet type is significant (Fig. 3.1, Table 3.1). For males, there is no difference in growth rate between genotypes on the standard food (Fig. 3.1, Table 3.1).
13
We next explored how ecdysone concentrations affect the growth of the wing discs in the PGX larvae. In fed PGX females, discs increase in size with time (Fig. 3.2, Table 3.2). However, growth rates are unaffected by ecdysone concentration in fed female discs (Fig. 3.2, Table 3.2). In contrast, PGX females raised on starvation medium without ecdysone supplement showed significantly slower growth rates than fed PGX females, resulting in a significant interaction between time and diet treatment (Fig. 3.2, Table 3.2). In the starved larvae, disc growth rate increased with the rising ecdysone concentrations (Fig. 3.2, Table 3.2), approaching growth rates similar to fed discs at the highest ecdysone concentrations.In contrast, wing discs from fed PGX males increased their rates of growth with increasing ecdysone concentrations, resulting in a significant interaction between ecdysone concentration and time (Fig. 3.2, Table 3.2). Thus, at least for in the standard food conditions males and females differ in the way the growth of their wing discs responds to ecdysone.
Figure 3.1: Growth rates of wing discs for fed and starved control larvae. (A) Growth rates for
>grim (black lines) and PG> (grey lines) females. Solid lines and circles represent fed females, dashed
lines and triangles represent starved females. Starved females have lower growth rates than fed females. (B) Growth rates for >grim (black line) and PG> (grey line) males. Both controls have high growth rates.
"
14
Response: log10 disc area
Sums of Squares Df F-value Females Time 8.20 1 493.10*** Diet 5.05 1 303.69*** Genotype 0.02 1 1.65 Time*Diet 6.60 1 396.76*** Time*Genotype 0.11 1 6.80** Diet*Genotype 0.00 1 0.10 Time*Diet*Genotype 0.09 1 5.13* Residuals 9.68 582 Males Time 0.14 1 10.93** Genotype 0.02 1 1.36 Time*Genotype 0.00 1 0.01 Residuals 0.45 36 Response: log10 disc area
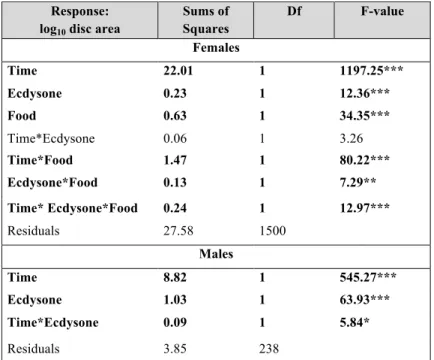
Sums of Squares Df F-value Females Time 22.01 1 1197.25*** Ecdysone 0.23 1 12.36*** Food 0.63 1 34.35*** Time*Ecdysone 0.06 1 3.26 Time*Food 1.47 1 80.22*** Ecdysone*Food 0.13 1 7.29** Time* Ecdysone*Food 0.24 1 12.97*** Residuals 27.58 1500 Males Time 8.82 1 545.27*** Ecdysone 1.03 1 63.93*** Time*Ecdysone 0.09 1 5.84* Residuals 3.85 238
Table 3.2: Comparisons in the response of log10 disc area to time and
ecdysone, for males, or time, ecdysone and food, for female PGX larvae.
Females: F7, 1500=196.5, p value<0.001, Adjusted R2=0.48
Males: F3, 238=209, p value<0.001, Adjusted R2=0.72
Significance code: *≤0.05, **≤0.01, ***≤0.001, significant parameters are highlighted in bold.
Table 3.1: Comparisons in the response of log10 disc area to time and
genotype, for males, or time, genotype and food, for female control larvae.
Females: F7, 582=179.1, p value<0.001, Adjusted R2=0.68
Males: F3, 36=4.10, p value=0.013, Adjusted R2=0.19
Significance code: *≤0.05, **≤0.01, ***≤0.001, significant parameters are highlighted in bold.
15
The effects of ecdysone concentrations on wing disc patterning early in the third
instar
We next examined the progression of patterning for Achaete and Senseless in control larvae. In both control genotypes, Achaete progressed steadily throughout the third instar, starting from stage 1 at 0 h after the third instar moult and reaching stages 5 and 6 by 30 h after the moult (Fig. 3.3A). Senseless expression progressed more slowly, remaining at stage 1 until 15 h after the moult. After 15 h, Senseless began to increase in stage, reaching stages 4 and 5 by 30 h (Fig. 3.3B). In both cases, patterning of the wing discs in fed males showed similar dynamics (Fig.3.6). For the starved female larvae, patterning fails to progress within the first 20 h after the moult, with all discs remaining at stages 1 or 2 for Achaete and stage 1 for Senseless. These results corroborate previous studies by Mirth et al (2009), demonstrating that starving larvae before critical weight inhibits patterning in the wing disc.
Then, we determined how ecdysone concentration regulated the progression of pattern in PGX larvae. In female larvae, the rate of patterning significantly affected by ecdysone concentration for both patterning gene products (Figures 3.4 & 3.5, Time * Ecdysone interactions in Tables 3.3 & 3.4). Although the interaction term between diet and time was not significant for either gene product, the interaction between diet and ecdysone and the three way interaction between time, diet and ecdysone concentration was significant for both Achaete and Senseless. This indicates that the effect of ecdysone on Achaete and Senseless patterning rates depends on whether the larvae were fed or starved. Similarly, in male larva ecdysone significantly affected the patterning rates for both Achaete and Senseless (Fig3.7 and Tables 3.3 & 3.4).
"
#
Figure 3.2: The effect of ecdysone on growth rates of the wing discs for starved and fed PGX larvae. (A) Disc area (log10)
over time for fed (solid line and circles) and starved (dashed line and triangles) female PGX larvae. (B) Disc area (log10) over time
For Achaete patterning, discs from fed PGX female larvae pattern slowly in the absence of ecdysone, reaching stages 3 and 4 by 30 h after the moult (Fig. 3.4). In starved PGX females, Achaete does not surpass stage 2 in the absence of ecdysone. Adding ecdysone to the medium increases the upper boundary, with discs reaching stages 5 and 6 by 30 h after the moult in fed females. Changing the concentration of ecdysone appears to change the speed at which these discs reach later stages of Achaete progression. At the highest ecdysone concentrations (100 ng/mg), some discs reach stage 5 as early as 10 hours after the moult. Male discs appear to respond in a similar manner, however we have insufficient data to resolve the dynamics of Achaete stage over time. Taken together, although Achaete patterning progresses to a certain extent on its own in PGX larvae, ecdysone appears to regulate the rate at which patterning occurs.
In PGX females that have not been supplemented with ecdysone, Senseless pattern does not progress beyond stage 2 by 30 h after the moult in fed larvae or beyond stage 1 by 20 h after the moult in starved larvae (Fig. 3.4B). Similarly to Achaete, adding ecdysone to the medium increases the patterning stage in both the fed and starved conditions, with the highest ecdysone concentrations resulting in discs that reach stages 4 and 5 by 30 h after the moult in fed larvae. Senseless male discs respond to increasing ecdysone concentrations in a similar manner. These data indicate that patterning rates for Senseless depend on ecdysone concentration.
"
#
Figure 3.3: Achaete and Senseless patterning rates in wing discs of fed and starved female control larvae. (A) Achaete stage over time for >grim (black lines) and PG> (grey lines) for both fed (full lines
and circles) and starved (dashed lines and triangles). (B) Senseless stage over time for >grim (black lines) and PG> (grey lines) for fed (full lines and circles) and starved (dashed lines and triangles). Both >grim and PG> starved animals have the same senseless stages.
17
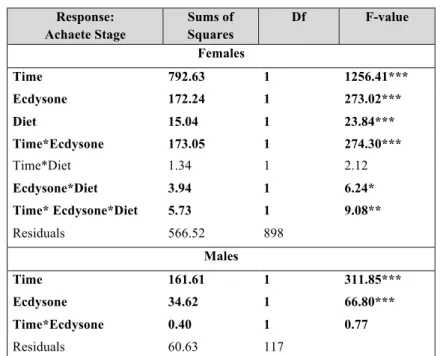
Response: Achaete Stage Sums of Squares Df F-value Females Time 792.63 1 1256.41*** Ecdysone 172.24 1 273.02*** Diet 15.04 1 23.84*** Time*Ecdysone 173.05 1 274.30*** Time*Diet 1.34 1 2.12 Ecdysone*Diet 3.94 1 6.24* Time* Ecdysone*Diet 5.73 1 9.08** Residuals 566.52 898 Males Time 161.61 1 311.85*** Ecdysone 34.62 1 66.80*** Time*Ecdysone 0.40 1 0.77 Residuals 60.63 117 Response: Senseless Stage Sums of Squares Df F-value Females Time 166.28 1 692.59*** Ecdysone 66.52 1 277.06*** Diet 0.16 1 0.68 Time*Ecdysone 83.31 1 342.82*** Time*Diet 0.17 1 0.40 Ecdysone*Diet 3.84 1 13.98*** Time* Ecdysone*Diet 3.73 1 15.55*** Residuals 215.60 898 Males Time 75.77 1 230.14*** Ecdysone 39.73 1 120.68*** Time*Ecdysone 16.53 1 50.22*** Residuals 38.52 117Table 3.3: Comparisons in the response of Achaete stage to time and ecdysone, for male, or time, ecdysone and food, for female PGX larvae.
Females: F7, 898=261.6, p value<0.001, Adjusted R2=0.67
Males: F3, 117=129.5, p value<0.001, Adjusted R2=0.76
Significance code: *≤0.05, **≤0.01, ***≤0.001, significant parameters are highlighted in bold.
Table 3.4: Comparisons in the response of Senseless stage to time and ecdysone, for male, or time, ecdysone and food, for female PGX larvae.
Females: F7, 898=191.1, p value<0.001, Adjusted R2=0.58
Males: F3, 117=137.2, p value<0.001, Adjusted R2=0.77
18
"
#
Fig. 3.4: The effects of ecdysone concentration on Achaete patterning rates in the wing discs fed and starved PGX larvae. (A) Achaete stage over time for fed PGX females. (B) Achaete stage over time for starved PGX
females. Numbers above the graphs and in the figure legends refer to ecdysone concentrations (pg/mg of diet).
"
#
Fig.3.5: The effect of ecdysone concentration on Senseless patterning rates in the wing discs of fed and starved PGX females. (A) Senseless stage over time for fed female PGX larvae. (B) Senseless stage over time for starved
19
"
#
Fig.3.6: Achaete and Senseless patterning rates for male control larvae. (A) Achaete stage over time for
>grim (black line) and PG> (grey line) males. (B) Senseless stage over time for >grim (black line) and PG>
(grey line) males.
"
#
Fig.3.7: The effect of ecdysone concentration on Achaete and Senseless patterning rates in the wing discs of PGX males. (A) Achaete stage over time for PGX males. (B) Senseless stage over time for PGX males. Numbers above the