445
Vol 3 Issue 9 September, 2015
THE INTERNATIONAL JOURNAL OF
BUSINESS & MANAGEMENT
Applying the Activity-Based Costing (ABC)
Model in a Consulting Company: An Improvement of the Model
1. Introduction
The business world is a market that evolves really fast. Theories/models that companies have been applying in their business strategies are constantly being updated as the market evolves. Strong competition and the enormous technology innovation, together with the demanding market that we are facing, lead companies to develop new approaches and drive them to update these new instruments of management1(Kaličanin & Knežević, 2013).
In order to companies achieve business success in such a competitive environment, the priority should always be the customers’ satisfaction. This implies either having lower total costs (which drives companies to compete against each other for the lowest practiced prices), or providing the customer with an exceptional level of added value, in comparison to the competition (competing for the differentiation of the products). There is also a third alternative that relies on the best combination of these two: lower costs with great level of added value (differentiation), which is known as Best Cost Strategy.
However, whatever the strategy companies consider to be the best for them, there are certain information that should always be studied and taken into account in order to the management to take the right decisions. Inaccurate information, specifically on costs, may outcome in decision-making mistakes and consequently, the loss of the competitive advantage.
According to this, companies have been perceiving that there is a growing need on finding more efficient management techniques, including those to manage costs. One of those methods is the so well-known Activity-Based Costing, which lays down on the type of management that is based on the ongoing activities of a company. Nevertheless, this model is mostly being applied on companies that produce physical goods and that have a well-defined production line. But what about service companies (namely, the Consultancy)? Is it so linear to apply it in this kind of organizations? Does it provide enough information to these companies, in order for them to ascertain about the right decisions to make? Is this analysis enough for this kind of companies?
This project aims to apply ABC model in a consulting organization and also to understand how the adaptability to this kind of companies should be performed, by having Winning Management Consulting as a pilot company.
1
Kaličanin, D., &Knežević, V. 2013. Activity-based costing as an information basis for an efficient strategic management process. Economic annals, 58(197) - p. 96.
Mafalda Cristina Parracho Neto
Master's Student, ISCTE Business School, Lisboa, Portugal
Leandro Luis Ferreira Pereira
Professor, ISCTE Business School, Lisboa, Portugal
Abstract:
In unstable and constant changing environments, as it is the current organizational world, it is notable the real need felt by companies on trying to overcome their competitors, in both employed strategy and auxiliary tools. In this way, there is an increase in the available tools in the market, which aim to help companies in their decision-making process and in the achievement of higher efficiency in the running of all their internal processes. Due to this, the necessity on being constantly innovating these tools outstands significantly in companies, in order to these to be always one step in front of their competitors.
From this necessity arises the subject of this article, as it pretends to adapt an existing tool – the costing model “Activity-Based Costing” – to a management consulting company, named Winning Management Consulting. This application aims to prove the adaptability of this model to the Consulting sector, as there are so many benefits that a company may achieve from its application, namely in the assistance to the decision-making process and to the cost management.
In parallel, the project will also contemplate a secondary analysis (a complement to the ABC model), which will allow the company to act not only upon the main processes (that were analyzed in the ABC), but also upon all the secondary processes, without which would not be possible the correct running of the business. In conclusion, this analysis aims to positively contribute to the model’s improvement.
446
Vol 3 Issue 9 September, 2015
2. Methodology
As the company has recently changed its Organizational Breakdown Structure (OBS), and considering that there may not be the necessary data by the time this research was developed, all the data that will be used in the research will be based on the previous OBS. As such, the data included in the analysis (namely costs, revenues, number of employees, among others) will have a monthly basis, which in turn will be obtain from the average of the last three months of 2014 – October, November and December.
However, before knowing the effective costs, we shall first define the “products” of the company, as all the costs will be attributed to these.
After this, we will have to study in deep and understand the processes that compose and that cut across the entire company (these are the overhead costs – that are essential for the running of the business and therefore, for the final outputs/products). These processes shall be converted into real costs, which in turn will be assigned to each one of the final products. The attribution of each overhead cost will be held according to proper cost drivers, which in turn will be defined after a discussion with the company’s expert – Winning’s CEO.
For the collection of data regarding these kind of costs, and since it is a small company and everything is well-organized, information will be obtained from several interviews with the Financial Office.
Also, in order to make the indirect costs allocation, we need to understand the whole flow of the existing supporting processes. For this, we will study and analyze Winning’s Governance Model. Later on, and after analyzing all the existing techniques, we have considered to use either the interview or the questionnaire, as this data collection is an activity that requires deep understanding of the figures and of the business itself.
In conclusion, we will use a mixture of both techniques, by using the interview to explain the participants the real goal of the research and the information we will need from them, and by using a kind of questionnaire (several templates that will be provided to the participants, asking the required information), so that the participants can fill in the templates with the necessary data without having any influence of external sources.
The choice of these techniques is due to the fact that this is a very analytical activity and, as such, we will need to use techniques that shall allow the understanding in deep of the information provided by each participant. These interviews and forms will then be conducted with people that have the enough awareness and acknowledgement of the processes that will be analyzed in this project. The selected people will be known after discussing it with Winning’s CEO, as he is the person that better knows the company and the experts of every process. As such, we will try to allocate costs in the most effective and accurate way.
After having all the indirect costs (from the supporting processes) assigned to each one of the final products, we shall ascertain about the costs that were directly incurred by each one of the considered products, in order to determine the global costs. Having these last ones defined, another interview with the financial office shall be conducted, in order to obtain data regarding the revenues.
In a second phase (after ABC is applied), we will make an analysis to the detailed processes, in order to turn the company more efficient.
Therefore, for each secondary process there will be a balance between the incurred costs and the real benefit/impact that each one of them has in the company.
For the classification of costs, we will use the information from the interviews and forms applied to each process’ accountable. After ascertaining about the real costs of each secondary process, these shall be compared within themselves (each group of processes shall be analyzed separately) and translated into a scale from 0 to 1 (being 1 the most expensive one).
Regarding the measurement of the benefits, this information will be obtained by using the same methods. As the necessary information shall be qualitative, interviews and forms shall also be the best techniques to use, in order to obtain reliable information regarding the real impact of each process in the company.
This qualitative information can be resumed into a classification, in a scale from 0 to 3 (being 0 “not having any impact at all” and 3 “having a lot of impact”), of each secondary process in each of the three categories of impacts – Business Impact (Loss Margins, Loss Revenues, Loss Clients, Loss Image), Efficiency Impact (More Rework, More Scrap, More Work, More Time), Compliance Impact (Big Penalty, Penalty, Big Incongruence, Incongruence).
After collecting this data, and in order to be able to compare the benefits with the costs, these benefits/impacts shall also be translated into a scale from 0 to 1 (being 1 the most impacting process).
Having the costs and the benefits/impacts in the same unit of measure, these shall be compared, in order to verify what the real cost-benefit ratio is (for a better perception, these values will be placed in a scatter plot).
3. The Company
Winning’s OBS follows a matrix structure, being the first line of direction and corporative management functional and stable2(Pereira, 2014).
Nevertheless, there are three groups of processes at Winning3(Pereira, 2014):
Core Business Processes, which are the set of processes which main mission is the delivery of value to clients, through the supply of services. The range of services provided by Winning can be translated into the three main competency centers that compose the company: Project Management Competency Center (PMCC), Business Analysis Competency Center (BACC) and
2
Pereira, L. 2014. Governance Model - p. 6 3
447
Vol 3 Issue 9 September, 2015
Benefits Management Competency Center (BMCC). All the services acquired by clients are always associated to one (or more) of these three. Support Business Processes, which are the set of processes which main mission is the management of opportunities that exist in the market, in order to assure the business continuity. These processes are translated into a single office that is called Business Development Office (BDO).
Support Organizational Processes, which are the set of processes which main mission is to support, facilitate and provide the necessary conditions for the course of the business. These processes include several offices, such as the Finance Office (FIN), Human Capital Office (HCO), Marketing Office (MKO), Management School Office (MS), Project Management Office (PMO), Quality and Compliance Office (QCO), Office Management (OM) General Management Office (GM) and Informatics and Communication Technologies Office (ICT).
4. Results and Discussion
4.1. Step 1 - Defining the “Products” of the Company
In order to simplify the complexity of the model, we will consider the three core business processes (PMCC, BACC and BMCC) as the final outputs, which comprehend all the services provided by the company to the customers.
Now, in order to understand the real costs of each Competency Center and consequently, each one’s contribution to the total costs incurred by Winning, it is important to distinguish the direct from the indirect costs. As the direct costs are easier to compute, let us start with the indirect ones, by applying the ABC Model.
4.2. Step 2 - Defining the Activities
As we already know, besides the core business processes, Winning has the support processes, which are divided into the Support Business Processes and the Support Organizational Processes.
In Winning’s specific scope, these processes are the ones that support and assure the running of the main business. These are transversal to the three main competency centers as they are the ones that support and assure their continuity. Therefore, instead of activities, we will consider the concept of processes, further on.
These shall include the following: BDO, FIN, HCO, MKO, MS, PMO, QCO, OM, GM and ICT. 4.3. Step 3 - Data Collection (Indirect Costs)
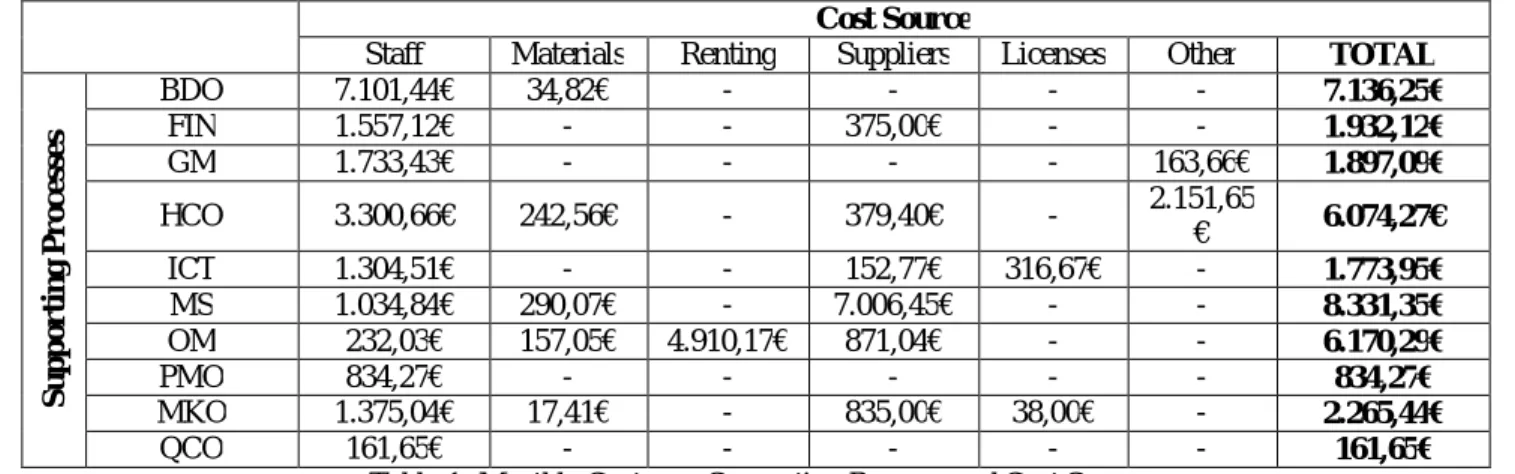
In order to allocate the overhead costs into the three main Competency Centers, these costs were classified into different groups (which are named as Process Cost Pools). Having said this, these were divided into the following six cost sources:
Staff Costs, which are translated into the wages of the employees that work for each process: Material Costs, which are the physical materials that are used/consumed by the supporting processes;
Renting Costs, which are the costs incurred by the supporting processes, in case they have equipment or any other properties that are being rented;
Suppliers Costs, which are translated into the payment to suppliers (from several sources); Licenses, which are the costs of external authorizations, necessary to the course of the processes; Other, which are all the other costs that do not fit in the previous groups.
In order to accurately ascertain about the costs of each one of the supporting processes, the collection of data was conducted by gathering the costs of three consecutive months (last three months of 2014 – October, November and December), and then a monthly average was made. The collected data was organized as displayed next:
Cost Source
Staff Materials Renting Suppliers Licenses Other TOTAL
S u p p or ti n g P r o c e ss e s BDO 7.101,44€ 34,82€ - - - - 7.136,25€ FIN 1.557,12€ - - 375,00€ - - 1.932,12€ GM 1.733,43€ - - - - 163,66€ 1.897,09€ HCO 3.300,66€ 242,56€ - 379,40€ - 2.151,65 € 6.074,27€ ICT 1.304,51€ - - 152,77€ 316,67€ - 1.773,95€ MS 1.034,84€ 290,07€ - 7.006,45€ - - 8.331,35€ OM 232,03€ 157,05€ 4.910,17€ 871,04€ - - 6.170,29€ PMO 834,27€ - - - 834,27€ MKO 1.375,04€ 17,41€ - 835,00€ 38,00€ - 2.265,44€ QCO 161,65€ - - - 161,65€
Table 1: Monthly Costs per Supporting Process and Cost Source Source: Compiled by author
448
Vol 3 Issue 9 September, 2015
4.4. Step 4 – Choosing a Proper Cost DriverHaving the previous data already well-defined, it is now necessary to properly allocate all these costs to the three main competency centers.
As this is a service analysis, it is very difficult to accurately say how many hours a person or a machine is dedicated to perform an activity. Therefore, the activity rates cannot be computed as it is described in the theory.
In order to distribute all these costs over the main outputs of the company, we will choose a proper cost driver, for each process. These should be directly related to the process and will help on directing the cost to its correct source, in the right proportion.
The cost driver that will be used in each process was discussed with the company’s expert, and it was concluded to be as follows:
Number of Employees Global Revenues Training Revenues
HCO, ICT, OM, PMO, QCO BDO, FIN, GM, MKO MS
Table 2: Costs Drivers to be used in each Supporting Process Source: Compiled by author
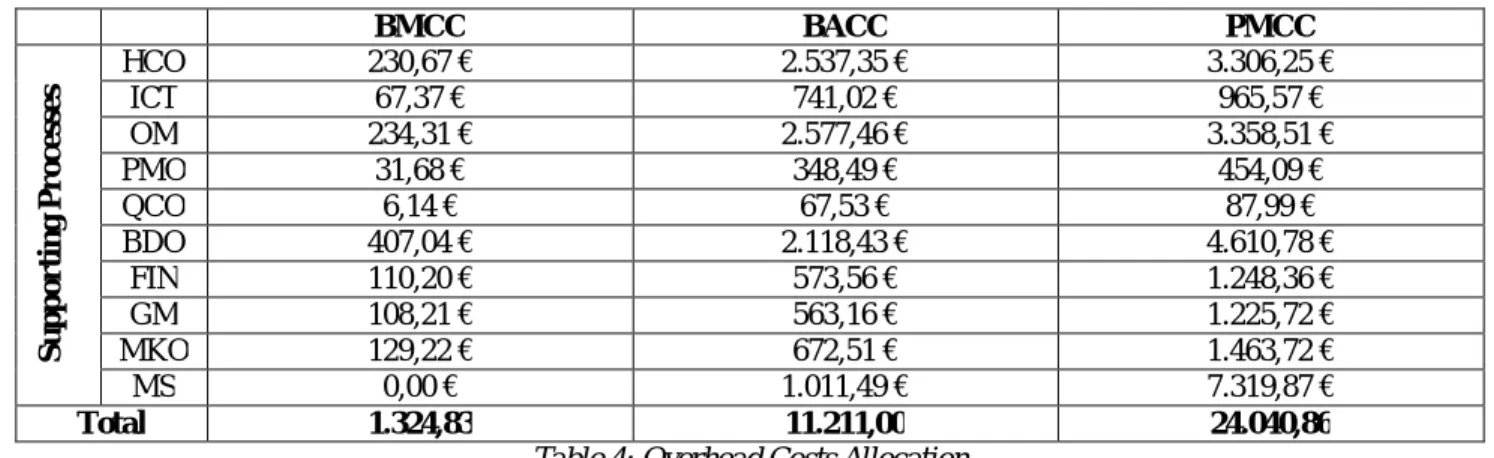
4.5. Step 5 – Allocating the Indirect Costs to the Main Competency Centers
In order to make this distribution, we will need to know the total number of employees in each center, the global revenues earned by each center, and the training revenues earned by each center:
Number of Employees (absolute number) Global Revenues (Euros) Training Revenues (Euros)
BMCC 3 15.042,33 0,00
BACC 33 78.288,00 4.300,00
PMCC 43 170.394,33 31.118,00
TOTAL 79 263.724,66 35.418
Table 3: Measures to be used in the Allocation of Overhead Costs Source: Compiled by author
The previous values were then used to make the allocation of costs to the respective centers, depending on the proportion of each one. Therefore, considering the cost driver of each center and its respective values, the allocation of the overhead costs (present on Table 1) was performed (applied directly to the “Total” costs) and the following results were obtained:
BMCC BACC PMCC S u p p or ti n g P r o c e ss e s HCO ICT 230,67 € 67,37 € 2.537,35 € 741,02 € 3.306,25 € 965,57 € OM 234,31 € 2.577,46 € 3.358,51 € PMO 31,68 € 348,49 € 454,09 € QCO 6,14 € 67,53 € 87,99 € BDO 407,04 € 2.118,43 € 4.610,78 € FIN 110,20 € 573,56 € 1.248,36 € GM 108,21 € 563,16 € 1.225,72 € MKO 129,22 € 672,51 € 1.463,72 € MS 0,00 € 1.011,49 € 7.319,87 € Total 1.324,83 11.211,00 24.040,86
Table 4: Overhead Costs Allocation Source: Compiled by author 4.6. Step 6 – Direct Costs
In addition, all the direct costs incurred by each center were collected and summed to the previous total values. From this, the following table was obtained:
BMCC BACC PMCC
Indirect
Costs 1.324,83 € 11.211,00 € 24.040,86 €
Direct Costs 10.196,28 € 68.644,33 € 107.500,58 €
Total 11.521,11 € 79.855,33 € 131.541,44 €
Table 5: Direct Costs incurred by each Competency Center Source: Compiled by author
4.7. Step 7 – Ascertaining about the Contribution of Each Center
Having ascertaining all the costs incurred by each center, it becomes possible to verify about the contribution that each has on the company’s total costs. The following diagram aims to represent this contribution, in percentage figures:
449
Vol 3 Issue 9 September, 2015
Figure 1: Total Costs incurred by each Competency Center, in percentage valuesSource: Compiled by author
Now that we are aware of each center’s cost contribution, it is important to understand their real return. For this, we must counterbalance the obtained results with the global revenues, previously mentioned (by applying the Benefit/Cost Ratio). The following table aims to show the obtained results:
Total Costs (Euros) Global Revenues (Euros) Benefit/Cost Ratio (Euros)
BMCC 11.521,11 15.042,33 1,31
BACC 79.855,33 78.288,00 0,98
PMCC 131.463,47 170.394,33 1,30
TOTAL 222.839,91 263.724,66 -
Table 6: Application of the Benefit/Cost Ratio Source: Compiled by author
From the previous table, one may understand that the center that is providing the best return is the Benefits Managements Competency Center, by providing 1,31 euros for each invested euro. This Center is followed by the Project Management Competency Center, by providing 1,30 euros for each invested euro. The Center with the worst return is the Business Analysis Competency Center, by providing a return of 0,98 euros, for each invested euro.
4.8. Step 8 – Complementary Analysis
As a complement to the ABC application, another analysis was developed, in order to give Winning a more powerful tool that can help it on the decision-making process.
This secondary analysis encompass an assessment to the company’s supporting processes, in order to ascertain about the usefulness of each one of them in the running of the business. The analysis had begun with the detailing of each supporting area into smaller processes. The greatest majority was obtained from an analysis to the company’s Governance Model, which in turn had been adjusted after a discussion with each area’s accountable.
In order to simplify the analysis, all the processes will be designated with a numeric number, instead of the respective description. Each detailed process has passed through a process of cost allocation of respective classification of benefits, in order to better understand the balance between costs and obtained benefits.
In relation to the cost allocation, this was performed by requesting each supporting area’s accountable to allocate the area’s costs according to the consumption of each process.
Regarding the classification of benefits, each area’s accountable was also asked to classify (qualitatively) each detailed process on the impact that each has on the company.
This information was translated into a scale from 0 to 1, in order to allow the comparison between them. Also, the referred scale was developed in a relative basis, i.e., the most costly process in each area was considered with the value of “1”, and the remaining processes in the same area was classified according to the proportion between this and the most costing process. The same method was developed in the classification of the benefits, as the most impacting process (within the same area) was considered to have the value of “1”, while the remaining processes were classified according to the their proportion, in relation to the first one.
After balancing the costs with the impact of each detailed process, a diagram was constructed in order to ascertain about the For each supporting area, the following results were obtained:
450
Vol 3 Issue 9 September, 2015
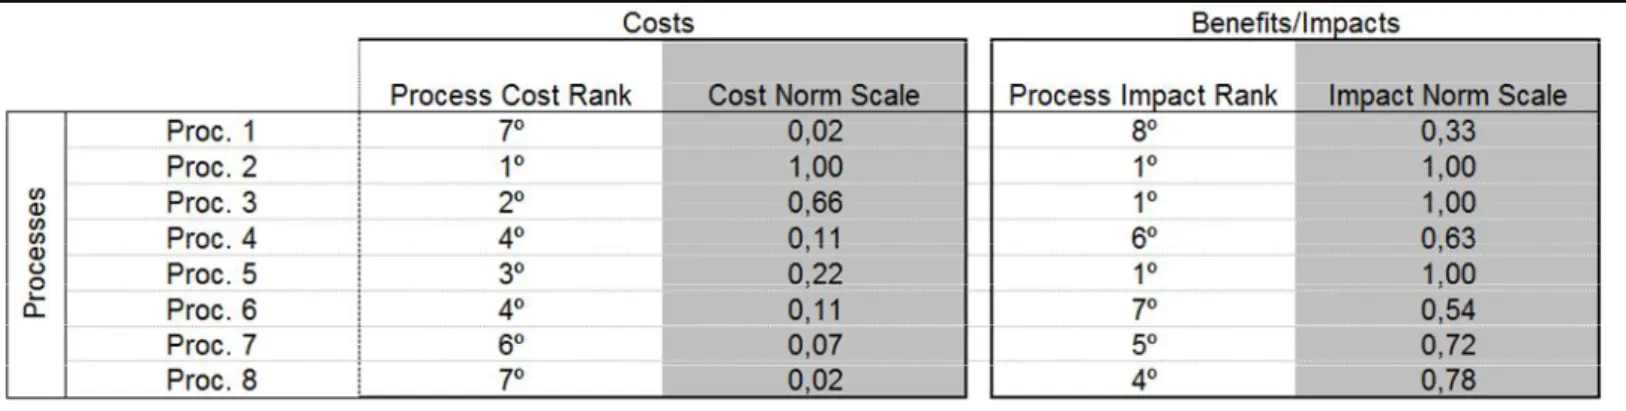
4.8.1. For the BDO Supporting Area:Table 7: BDO's Cost and Impact Scale Source: Compiled by author
Figure 2: BDO's Cost/Benefit Diagram Source: Compiled by author
As one may see in the previous figures, any process from this supporting area should be eliminated.
On the “Evaluate” category there is only Process 1, due to its low impact on the running of the business. Therefore, this process should be rethought, in order to make it more valuable to the company.
On the “Reduce” category, there are Process 2 and Process 3. This means that, for these two processes, Winning should reconsider about the costs that these are incurring, as they may be excessive in relation to the impact they have in the company.
The remaining processes (Process 4, 5, 6, 7 and 8) are classified in the “Keep” category. This means that all of these (some more than others) are incurring in reasonable costs, and providing considerable value for the company.
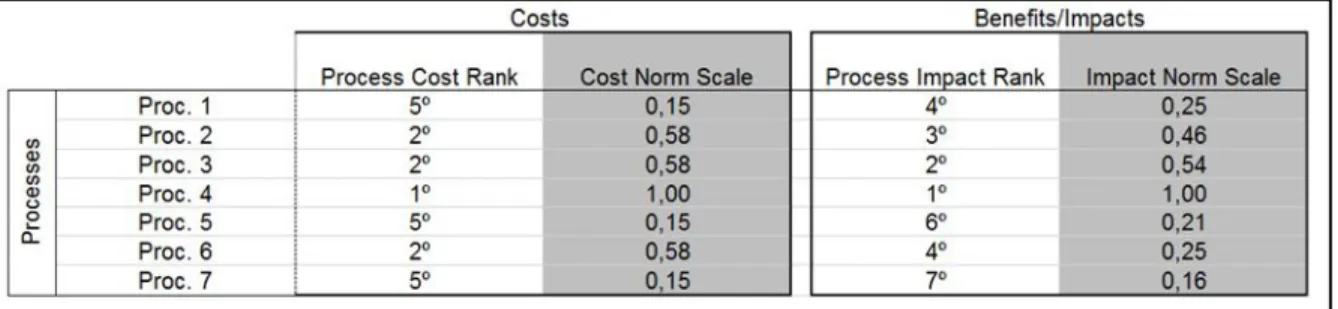
4.8.2. For the FIN Supporting Area:
Table 8: FIN's Cost and Impact Scale Source: Compiled by author
451
Vol 3 Issue 9 September, 2015
Figure 3: FIN's Cost/Benefit Diagram(Source: Compiled by author)From the figure above, it is possible to see that the majority of the processes are concentrated in “Evaluate” quadrant (with four processes out of eight), while the “Keep” and “Reduce” quadrants only have two processes each. From the outset, it is also possible to conclude that it is not necessary to eliminate processes.
Regarding the “Reduce” category, we have Process 1 and 4. Accordingly, these processes should be adjusted, as there may be other ways to reduce the costs being incurred by these two, especially on Process 4, as it is the most expensive one.
On the “Keep” category there are Process 2 and Process 6, which means that these two are the ones that should be maintained, as they are incurring in reasonable costs and considerable benefits (i.e., the impact on the company is relatively high).
On the “Evaluate” category there are the remaining processes (Process 3, 5, 7 and 8), which means that these are the ones that should be revaluated, in order to turn their impact more remarkable in the company.
4.8.3. For the GM Supporting Area:
Table 9: GM's Cost and Impact Scale Source: Compiled by author
Figure 4: GM's Cost/Benefit Diagram Source: Compiled by author
As one can see from the previous figure, this Office does not have any process that should clearly be maintained. Therefore, all the existing processes are classified in the categories of “Evaluate”, “Reduce” and “Eliminate”.
Regarding the “Eliminate” category, it is possible to see that Processes 2 and 6 are clearly the ones that should be removed, as they are incurring in the highest costs, and providing the lowest value (as they have the lowest impact on the company).
452
Vol 3 Issue 9 September, 2015
On the “Reduce” category there are Process 3 and 4, as they are providing a considerable value, but may be incurring in excessive costs, comparing to the rest of the processes (especially Process 4, as it is the most expensive one).Finally, regarding the “Evaluate” category, it is also possible to verify that Process 1, 5 and 7 are the ones that should be revaluated, as they are incurring in reasonable costs (also comparing to the remaining processes in this Office), but may not be providing the necessary value (as their impact on the company is relatively low).
4.8.4. For the HCO Supporting Area:
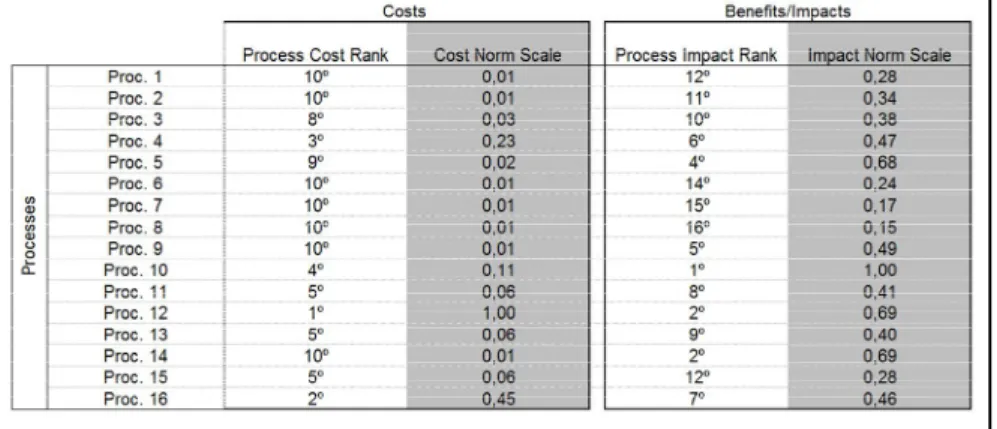
Table 10: HCO's Cost and Impact Scale Source: Compiled by author
Figure 5: HCO's Cost/Benefit Diagram Source: Compiled by author
As one can see from the previous figure, the large majority of the processes are included in the “Evaluate” quadrant. This means that all of these (Process 1, 2, 3, 4, 6, 7, 8, 9, 11, 13, 15 and 16) are incurring in relative reasonable costs, which is positive. However, the impact that these have on the company are less than 50% of the process with the highest impact. Therefore, they should be reconsidered in order to make them more valued to the company.
In the “Keep” category there are Process 5, 10 and 14, which means that these are the processes that are creating considerable value for the company and incurring in reasonable costs (in a relative way). Therefore, these are the ones that should be maintained.
In the “Reduce” category there is only Process 12. This means that, although this process is creating considerable value, it is the most expensive process in HCO (besides, there is a great discrepancy between this process and the rest of the processes). Therefore, and although this is the reference process (for having the highest cost), it should be reconsidered in order to turn it less expensive.
453
Vol 3 Issue 9 September, 2015
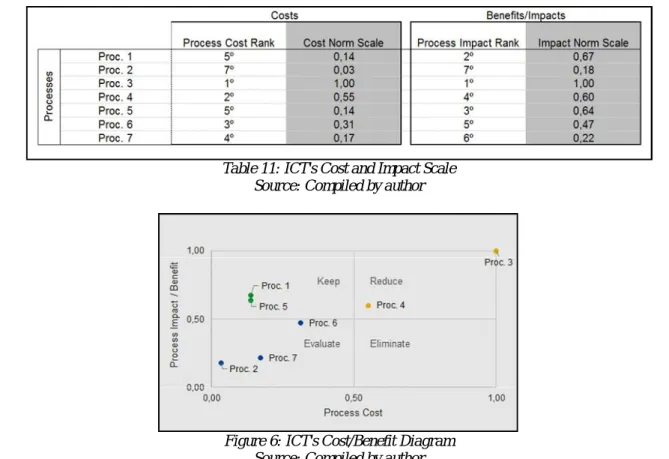
4.8.5. For the ICT Supporting Area:Table 11: ICT's Cost and Impact Scale Source: Compiled by author
Figure 6: ICT's Cost/Benefit Diagram Source: Compiled by author
From the previous figure, it is possible to verify that the eight processes of this Office are distributed among three quadrants: three processes on “Evaluate”, three on “Keep” and the remaining two on “Reduce”. In advance, it is also possible to see that no process will need to be eliminated.
Regarding Process 2, 6 and 7, in the “Evaluate” quadrant, these are the processes that will need to be revaluated, in order to try to increase their value to the company.
Regarding Process 1 and 5, in the “Keep” quadrant, these will be the processes that are incurring in relative reasonable costs, and creating considerable value for Winning. For this reason, these are the ones that should be kept.
Finally, regarding Process 3 and 4, in the “Reduce” category, these are the processes that, although they are creating relative considerable value for the company, they are also incurring in relative considerable costs. However, as Process 3 is the reference process (for having the highest cost), it may be inconclusive to make decisions for this process based on the figure. Nevertheless, as it is the most expensive process, the company should think about reducing its global costs. For this reason, both of these processes shall also be revaluated, in order to turn them less expensive and make them more efficient.
4.8.6. For the MKO Supporting Area:
Table 12: MKO's Cost and Impact Scale Source: Compiled by author
454
Vol 3 Issue 9 September, 2015
Figure 7: MKO’s Cost/Benefit DiagramSource: Compiled by author
As one may see, Process 1 and Process 3 are the reference processes – one, by having the highest cost, and the other for providing the highest impact/benefit for Winning. However, Process 1 is classified in the “Keep” category, which means that this is creating considerable value (the highest one), and incurring in very low costs. On the other hand, although Process 3 is having the highest cost, it is classified in the “Reduce” quadrant, which means that it is also creating considerable value. However, for this last one, it is important to analyze in which way the process (the management of the use of the corporative image) may be reduced in terms of costs, as it has a great discrepancy relatively to the remaining ones.
The remaining process (Process 2) is classified in the “Keep” category, which is quite positive, as it means that it is incurring in relative low costs, and creating relative considerable value for the company.
4.8.7. For the MS Supporting Area:
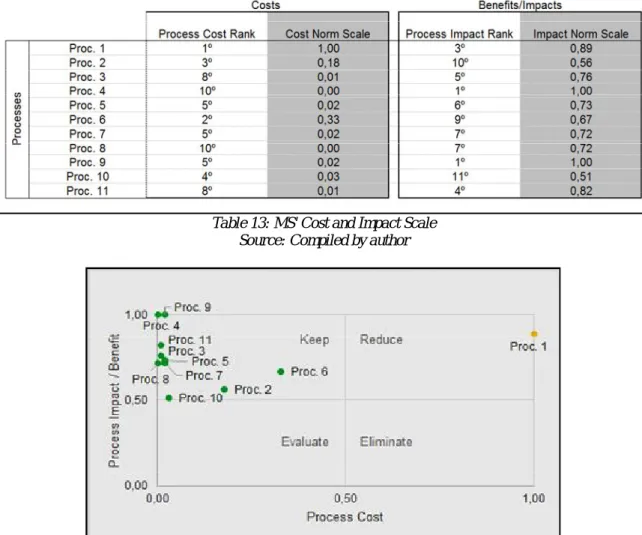
Table 13: MS' Cost and Impact Scale Source: Compiled by author
Figure 8: MS' Cost/Benefit Diagram Source: Compiled by author
455
Vol 3 Issue 9 September, 2015
As one can see from the previous figure, the great majority of the processes are concentrated in the “Keep” quadrant. This is very positive for this Office, as it means that around 90% of the processes are incurring in relative reasonable costs and creating considerable value (also in relative terms).Although Process 1 is classified in the “Reduce” category, it is the reference process (the one with the highest cost, will always be considered as having “1,00”). Although this cannot be seen as a negative fact, the company should reconsider about reducing its cost, as it is the most expensive one, in this area.
4.8.8. For the OM Supporting Area:
Table 14: OM's Cost and Impact Scale Source: Compiled by author
Figure 9: OM's Cost/Benefit Diagram Source: Compiled by author
According to the previous figures, one can see that the majority of this Office’s processes are more concentrated in the left side of the figure, in the quadrants “Keep” and “Evaluate”. This means that the great majority of the processes are incurring in low costs, in relation to the reference process (the one with the highest cost – Process 1).
Regarding Process 2, 3, 4, 5, 7 and 9 (included in the “Keep” quadrant), these are the ones that should be maintained, in the way that they are creating considerable value, and incurring in relative low costs (in relation to the reference process – Process 1).
Regarding Process 6 and 8 (included in the “Evaluate” category), these are the ones that should be revaluated, in the way that they are also incurring in relative low costs, but are not creating as much value as they could. Therefore, these should be “rethought”, in order to try to increase their impact on the company.
456
Vol 3 Issue 9 September, 2015
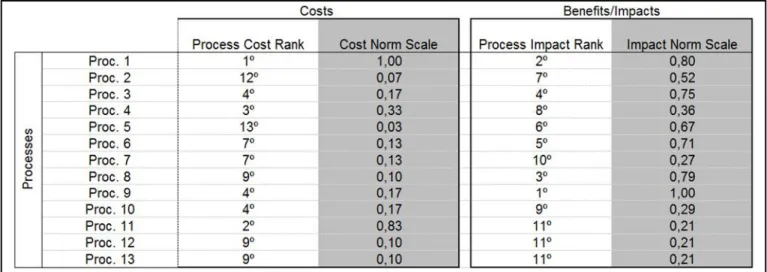
4.8.9. For the PMO Supporting Area:Table 15: PMO's Cost and Impact Scale Source: Compiled by author
Figure 10: PMO's Cost/Benefit Diagram (Source: Compiled by author)
According to the previous figure, it is possible to see that there are processes included in each quadrant. As one may see, Process 1 and Process 9 are the reference processes – one, by having the highest cost (Process 1), and the other for having the highest impact (Process 9). Process 1 is categorized in the “Reduce” category, which means that Winning should evaluate in which way it can attenuate its cost, in order to minimize the existing difference to the remaining ones. Process 9 is the one with the most impact on the company and also incurring in relative reasonable costs, which is positive (consequently, it is classified in the “Keep” quadrant). In addition, one can also see that the great majority of the processes are included in the “Keep” and “Evaluate” quadrants. This is quite good, as it means that there are many processes that are incurring in reasonable costs and creating considerable value for the company – those that are in the “Keep” quadrant (these are Process 2, 3, 5, 6, 8 and 9).
Regarding all the processes that are included in the “Evaluate” quadrant, it means that these processes are incurring in reasonable costs, however are also creating low value for the company. Therefore, these should be analyzed in order to turn them more valuable/with more impact (these are Process 4, 7, 10 and 13)
There is only one process that is classified in the “Eliminate” quadrant (Process 11), which means that this process has relative high costs, comparing to the impact that it has on the company.
457
Vol 3 Issue 9 September, 2015
4.8.10. For the QCO Supporting Area:Table 16: QCO's Cost and Impact Scale Source: Compiled by author
Figure 11: QCO's Cost/Benefit Diagram Source: Compiled by author
As one may see from the previous figure, the large majority of the processes are included in the “Keep” quadrant. This is positive in the way that it means that most of the processes are creating considerable value and incurring in reasonable costs.
The outliers are Process 2 and 7, as they are categorized in the “Evaluate” and “Reduce” quadrant, respectively.
Regarding Process 2, although it is quite close to the “Keep” quadrant, it means that it should be reconsidered in the way that it should be providing more value than it is currently providing.
Regarding Process 7, although it is the process with the highest impact on the company, it is also incurring in the highest costs. Therefore, these costs should be analyzed in order to turn the process less expensive.
5. Conclusions
From a global view, this project was able to prove that, in fact, and despite the need of making some adjustments, the answer to this dissertation’s title is yes: it is possible to apply the ABC model in a consulting company.
This conclusion was only possible due to the extended analysis that was developed based on the example of Winning Management Consulting. From this, it was possible to take the following conclusions:
5.1. From the ABC Model
Considering the Competency Centers that composed the company during the analysis period, one could see that the one that is contributing the most for the total costs, is the Project Management Competency Center, with around 59% of the total costs. This is followed by the Business Analysis Competency Center, by incurring in 35,8% of the total incurred costs. Lastly, the Benefits Management Competency Center is the one with the lowest costs, by incurring in only 5,2% of the total ones. Regarding the revenues for each ones, the order remains the same: Project Management Competency Center is the one that contributes the most for the global revenues of the company, with 64,61% of the total value, which is followed by the Business Analysis Competency Center, by contributing with 29,69% for the global revenues. The Benefits Management Competency Center is the one with the lowest revenues, by contributing with around 5,7% of the total ones.
However, after balancing the costs versus the benefits (revenues) for each of the referred Competency Centers, it was possible to conclude that the contribution is not as linear as it seemed to be: the center of Benefits Management, although it has the lowest revenue contribution, it has the highest Benefit-Cost Ratio, by providing Winning a return of 31 cents per each invested euro (BCR=1,31). It is followed by the center of Project Management, which is providing Winning a return of 30 cents per each invested euro (BCR=1,30). The last one is the center of Business Analysis, as it is providing a negative return per each invest euro (around 2 cents, as BCR=0,98).
458
Vol 3 Issue 9 September, 2015
5.2. From the Complementary AnalysisRegarding the second stage of the analysis, it was possible to conclude that, from the ninety-one existing processes, only three are classified in the “Eliminate” category, which means that these processes should be removed from the existing tasks, as they are incurring in too many costs, comparing to the impact/benefit that they are providing to the company. There are fourteen processes that are classified in the “Reduce” category, which means that the company should act upon these processes, because although these are creating considerable value for the company (contrary to the “Eliminate” category), they are the ones that are incurring in the relative highest costs (together with the “Eliminate” category). Regarding the “Evaluate” category, there are thirty-one processes classified in this group. This means that these processes should not be immediately eliminated, as they are not incurring in such high costs, but instead they should be revaluated, in order to turn them more valuable and with more impact to the company. Fortunately, the greatest majority of the processes are classified in the “Keep” category (which totalizes forty-three processes). This means that these are the processes that certainly shall be preserved, as they are incurring in relative low costs, and have a considerable impact in the company.
6. References
i. Kaličanin, D., & Knežević, V. (2013). Activity-based costing as an information basis for an efficient strategic management process. Economic Annals, 58(197), 95–120. doi:10.2298/EKA1397095K