UNIVERSIDADE DA BEIRA INTERIOR
Engenharia
Performance and Efficiency
Evaluation of Air Cargo Carriers
Cargolux and Lufthansa Cargo Case Studies
Duarte Jorge Matos Cachola
Dissertação para a obtenção do Grau de Mestre em
Engenharia Aeronáutica
(Ciclo de estudos integrado)
Orientador: Prof. Doutor Jorge Miguel dos Reis Silva
Co-orientador: Prof. Doutor Vasco Domingos Moreira Lopes Miranda dos Reis
iii
Dedicatory
To my mother and sister, for their encouragement, faith, patience, and affection, without which I could not have completed this course.
v
Acknowledgments
Here I would leave my sincere thanks to all who showed support and help to make this Master's Thesis.
First to my family, especially my mother, sister, grandparents, uncles, and cousins for their unmatched support, by the sacrifices we had to endure, and all understanding.
To Professor Jorge Miguel dos Reis Silva, who was my advisor in completing this dissertation, I sincerely thank all the sharing of knowledge, the competence and dedication, but mainly to the availability that led to this work.
Also, I thank Professor Vasco Reis, for all help, availability and valuable advice and suggestions.
I thank Maria Emília Baltazar, for all help, guidance, encouragement, and availability along with this work.
To all the Transportation Research Team (NIT) members for their help and companionship.
To the contacted entities and specialists, for their important support and information.
Finally, to my friends that with their support, accompanied me throughout this work, and showed all their friendship throughout all these academic years.
vii
Resumo
A indústria da carga aérea tem sofrido uma grande mudança, tornando-se hoje em dia uma indústria muito competitiva e dinâmica. As companhias aéreas tradicionais, que anteriormente se focavam apenas no transporte de passageiros já compreenderam a importância e a rentabilidade do segmento da carga aérea enquanto que as companhias aéreas que só transportam carga estão a crescer consideravelmente devido à elevada procura. A carga aérea é um dos maiores meios de transporte no mundo atualmente devido a diversos fatores, tais como, o crescimento do comércio mundial ou a elevada procura por entregas de bens a tempo.
De forma a compreender e melhorar o desempenho e a eficiência de companhias aéreas de carga num mercado complexo como o dos dias de hoje, foi criado um conjunto de áreas chave (KPAs) e indicadores chave (KPIs). Estes permitem estudar como as companhias aéreas de carga podem operar de uma forma mais eficiente para responder às necessidades do competitivo mercado da carga aérea e para ajudar os decisores a selecionar as melhores alternativas para garantir uma melhor avaliação em termos de desempenho e eficiência de diversas companhias aéreas.
Esta pesquisa avalia o desempenho e a eficiência da Cargolux e da Lufthansa Cargo, ao longo de dez anos (2006 – 2015). Para fazer tal avaliação, é usada uma ferramenta de análise multicritério de apoio à decisão (MCDA), mais especificamente, o MACBETH (Measuring
Attractiveness by a Categorical Based Evaluation Technique), usando pesos de critérios e
escalas de valor para cada KPA e cada KPI, derivados dos resultados de um inquérito aplicado a especialistas da indústria.
De acordo com os resultados dos inquéritos, este estudo conclui que a área chave mais relevante do caso de estudo do desempenho é a área operacional e para o caso de estudo da eficiência é a área da produtividade. Os resultados confirmam que a carga aérea é uma indústria complexa e volátil e que alguns eventos globais têm desafiado o crescimento desta indústria.
Palavras-chave
ix
Resumo Alargado
Introdução
Esta secção resume, em língua portuguesa, o trabalho de investigação desta dissertação. Primeiramente é apresentado o enquadramento da dissertação, de seguida são abordados os casos de estudo e são apresentadas as principais conclusões, terminando com as perspetivas de trabalhos futuros.
Enquadramento da Dissertação
A carga aérea era tradicionalmente considerada como um subproduto do transporte aéreo de passageiros; contudo, nos últimos anos, foi adotada uma nova estratégia de mercado pelas companhias de transporte de passageiros e mercadorias.
A indústria da carga aérea tem um grande impacto na economia global, isto porque é o principal meio de transporte de produtos perecíveis, de luxo e tecnológicos. As empresas de vendas
online dependem de um serviço de entregas rápidas e eficientes dos produtos aos seus clientes.
A rapidez, a segurança e a confiança são características do transporte aéreo e são fatores essenciais para o transporte de mercadorias na cadeia de abastecimento moderna. À medida que o serviço porta a porta se intensifica, os integradores de carga aérea desenvolveram-se e expandiram-se rapidamente ao longo dos últimos anos.
Com o transporte aéreo, os mais diversos países podem estar eficientemente ligados a mercados distantes e às cadeias globais de abastecimento, independentemente da sua localização. A carga aérea tem um importante papel na economia e é responsável pelo desenvolvimento económico e social de certas regiões. Este mercado está intimamente relacionado com o comércio internacional cuja expansão tem permitido a remoção de restrições e o aumento de oportunidades de negócio, através de melhores comunicações e contactos internacionais.
Apesar da limitada informação na literatura sobre a carga aérea e dos poucos dados revelados pela indústria, tem havido um aumento gradual do número de trabalhos científicos relativos a este tema. Devido ao aumento de produtos transportados por via aérea torna-se relevante estudar este assunto, abordando todas as áreas de atividade das companhias aéreas de carga. Com o aumento da concorrência e as constantes mudanças, no mercado do transporte aéreo, as companhias aéreas são desafiadas a gerir as suas operações mais eficientemente de forma a que possam adaptar-se e responder às necessidades do mercado cada vez mais competitivo. Assim, surge a necessidade de realizar uma avaliação do desempenho e eficiência das companhias de carga aérea, de forma a compreender como estas podem operar de uma forma mais eficiente.
Objetos e Objetivos
O objeto desta dissertação é contribuir para um maior desempenho e eficiência das companhias aéreas de carga; os objetivos são avaliar o desempenho e a eficiência, usando uma ferramenta de análise multicritério de apoio à decisão, e com duas finalidades: self-benchmarking e
peer-benchmarking.
Além disso, este trabalho apresenta três objetivos secundários, mais específicos, tal como indicado em seguida.
O primeiro é identificar as áreas e os indicadores de desempenho e selecionar quais são as áreas chave e os indicadores chave para avaliar o desempenho e a eficiência de companhias aéreas de carga.
O seguinte objetivo é criar uma base de dados para todos os indicadores chave para um período de dez anos (2006 a 2015) para a Cargolux e a Lufthansa Cargo de forma a implementar esses dados na ferramenta multicritério de apoio à decisão.
Por fim, o último objetivo é analisar e comparar os resultados dos casos de estudo, sendo que o primeiro consiste na análise do desempenho da Cargolux e o segundo na da eficiência da Cargolux e da Lufthansa Cargo.
Principais Conclusões
A indústria do transporte aéreo é complexa, dinâmica, e, ao mesmo tempo, vulnerável, sujeita a mudanças sazonais, ciclos económicos e eventos externos. Recentemente, o mercado da carga aérea passou por diversos desafios, tais como, ataques terroristas ou crises financeiras, que criaram a necessidade de realizar uma avaliação global da evolução do desempenho e eficiência das companhias aéreas de carga.
Os resultados desta dissertação evidenciam a importância deste tipo de avaliação de forma a compreender como as companhias de carga aérea lidam com os assuntos relacionados com o desempenho e a eficiência e como é possível obter melhores resultados no que diz respeito a esses itens. Com o modelo MACBETH é possível avaliar qualquer companhia aérea de carga, tendo em conta a sua particularidade e complexidade, e desde que os dados dos indicadores chave sejam disponibilizados.
De acordo com a opinião dos especialistas, este estudo mostra que a área operacional é a mais relevante e que a área ambiental é a menos relevante, no que diz respeito ao desempenho. Por outro lado, no que diz respeito à eficiência, a produtividade é a área mais relevante e a sustentabilidade é a menos relevante. Além disso, analisando as pontuações globais de eficiência obtidas através dos dados recolhidos é possível concluir que a Cargolux e a Lufthansa
xi Cargo seguiram a mesma tendência ao longo do período estudado. Relativamente aos resultados da análise de sensibilidade, 2015 foi o melhor ano para todos os indicadores chave do desempenho da Cargolux.
As maiores dificuldades deste estudo, surgiram na obtenção de dados para todos os indicadores chave, para os dez anos estudados, e para as companhias aéreas selecionadas. Contudo, pode dizer-se que os principais objetivos propostos inicialmente foram atingidos.
Perspetivas de Trabalhos Futuros
A indústria da carga aérea enfrenta alguns desafios. Este estudo permitiu identificar várias linhas de investigação para futuros trabalhos de pesquisa, que se deverão focar nos seguintes tópicos:
1. Desenvolver e implementar um outro modelo de análise, mais robusto e flexível; 2. Ampliar o estudo a mais companhias aéreas de carga;
3. Ampliar o conjunto de áreas e indicadores chave de desempenho e eficiência, implementando novas áreas de atividade, tais como, qualidade do serviço, pontualidade e segurança;
4. Aplicar a avaliação de desempenho e eficiência a todas as entidades envolvidas em todas as fases do transporte de mercadorias;
5. Desenvolver modelos de previsão da evolução do mercado da carga aérea de forma a que se possam tomar medidas de prevenção que garantam melhores resultados de desempenho e eficiência.
xiii
Abstract
The air cargo industry has been in a constant change becoming nowadays a very competitive and dynamic industry. Traditional airlines, that once only focused on the passenger transportation, already noticed the importance and profitability of the air cargo segment while the all-cargo carriers are considerably growing due to the high demand. Air cargo is one of the major means of transport in the world today due to several factors, such as the growing global trade or the high demand for timely deliveries.
To understand and improve the overall performance and efficiency of air cargo carriers in the today’s complex market it was created a set of the most relevant key performance areas (KPAs) and key performance indicators (KPIs). These allow studying how air cargo carriers can operate more efficiently to respond the needs of a globally competitive market, and to help decision makers to select the best alternatives to ensure the best assessment regarding performance and efficiency of several air cargo carriers.
This research evaluates the overall performance and efficiency of Cargolux and Lufthansa Cargo, over the course of ten years (2006 – 2015). Thus it was used a MCDA (Multi-Criteria Decision Analysis) tool, more specifically, MACBETH (Measuring Attractiveness by a Categorical Based Evaluation Technique), using criteria weights and value scales for each KPI and KPA, derived from the results of a survey applied to industry experts.
Based on the survey results, this study finds that the most relevant key performance area for the performance case study is the operational KPA and for the efficiency case study is the productivity KPA. The results confirm that the air cargo is a complex and vulnerable industry and that some global events have challenged the evolution of this industry.
Keywords
xv
Table of Contents
Dedicatory... iii Acknowledgments ... v Resumo ... vii Resumo Alargado ... ix Abstract... xiii Table of Contents ... xvList of Figures ... xvii
List of Tables ... xxi
List of Acronyms ... xxiii
Chapter 1 – Introduction ... 1
1.1. Motivation ... 1
1.2. Object and Objectives ... 2
1.3. Methodology and Structure ... 2
Chapter 2 – The Air Cargo Industry ... 5
2.1. Introduction ... 5
2.2. Evolution of Air Cargo ... 5
2.3. Air Cargo Business Models ... 8
2.3.1. All-Cargo Carriers ... 8
2.3.2. Combination Carriers ... 9
2.3.3. Integrators ... 10
2.4. The Main Players ... 11
2.5. Air Cargo Carriers Benchmarking ... 13
2.6. Conclusion ... 14
Chapter 3 – Performance and Efficiency Evaluation Methodologies ... 15
3.1. Introduction ... 15
3.2. Methodologies ... 15
3.3. Measuring Attractiveness through a Category Based Evaluation Technique (MACBETH) ... 17
3.3.1. Structuring ... 20
3.3.2. Survey and Meetings ... 23
3.3.4. Classification and Outputs ... 27
3.4. Conclusion ... 27
Chapter 4 – Case Studies ... 29
4.1. Introduction ... 29
4.2. Case Study 1 – Cargolux Performance ... 29
4.2.1. Key Performance Areas and Key Performance Indicators Weights ... 30
4.2.2. Air Cargo Carriers Performance Evaluation ... 34
4.2.3. MACBETH Outputs ... 36
4.3. Case Study 2 – Cargolux and Lufthansa Cargo Efficiency ... 43
4.3.1. Key Performance Areas and Key Performance Indicators Weights ... 44
4.3.2. Air Cargo Carriers Efficiency Evaluation ... 45
4.3.3. MACBETH Outputs ... 48
4.4. Conclusion ... 54
Chapter 5 – Conclusions... 57
5.1. Dissertation Synthesis ... 57
5.2. Concluding Remarks ... 58
5.3. Prospects for Future Work ... 59
References ... 61
Annex I – Survey Results ... 65
Annex II – Sensitivity Analysis ... 81
xvii
List of Figures
Figure 1-1: Total air freight and passenger volumes. ... 1
Figure 1-2: Dissertation structure and methodology. ... 3
Figure 2-1: World air cargo traffic evolution in RTKs. ... 6
Figure 2-2: Freight load-factor worldwide. ... 6
Figure 2-3: Air cargo operating costs. ... 7
Figure 2-4: Evolution of jet fuel and oil price per barrel. ... 8
Figure 2-5: Worldwide share of belly and dedicated freighters. ... 9
Figure 2-6: Passenger and cargo shares of revenues in 2013. ... 10
Figure 2-7: Air cargo supply chain. ... 12
Figure 3-1: Activities needed to perform an air cargo carriers evaluation. ... 19
Figure 3-2: Example of a MACBETH performance table for operational KPA. ... 22
Figure 3-3: Example of a KPI judgment matrix question. ... 24
Figure 3-4: Example of a MACBETH judgements matrix. ... 25
Figure 3-5: Building process of a decision conference. ... 26
Figure 3-6: Example of a criteria value function from MACBETH. ... 26
Figure 4-1: MACBETH value tree for the performance assessment. ... 30
Figure 4-2: Performance KPAs weights. ... 31
Figure 4-3: Operational KPIs weights. ... 31
Figure 4-4: Financial KPIs weights. ... 32
Figure 4-5: Fleet KPIs weights. ... 33
Figure 4-6: Personnel KPIs weights. ... 33
Figure 4-7: Environment KPIs weights. ... 34
Figure 4-8: Cargolux performance evolution. ... 35
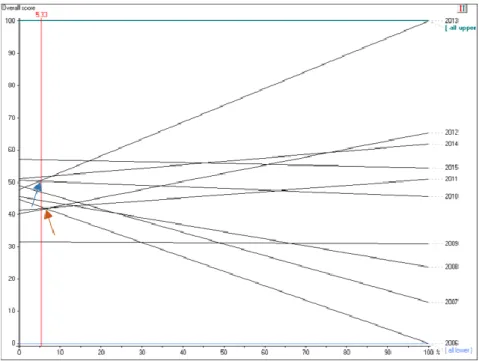
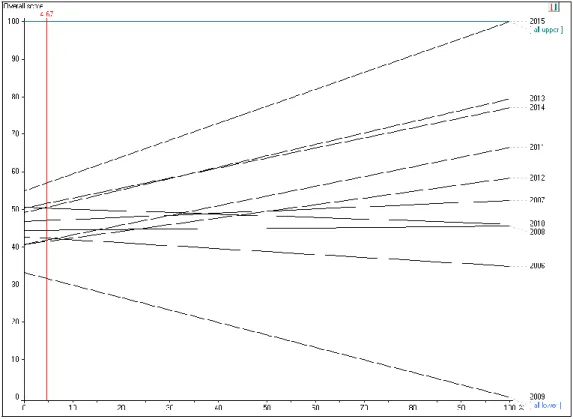
Figure 4-9: Sensitivity analysis on weight for load-factor KPI. ... 36
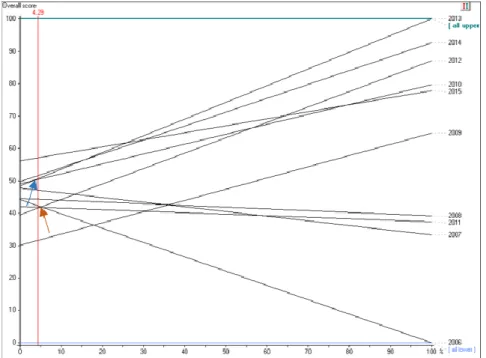
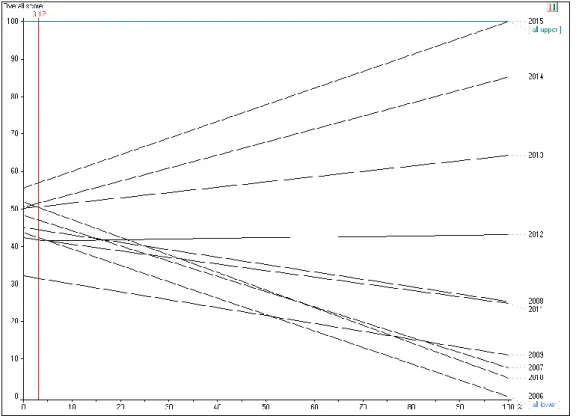
Figure 4-10: Sensitivity analysis on weight for operational costs KPI. ... 37
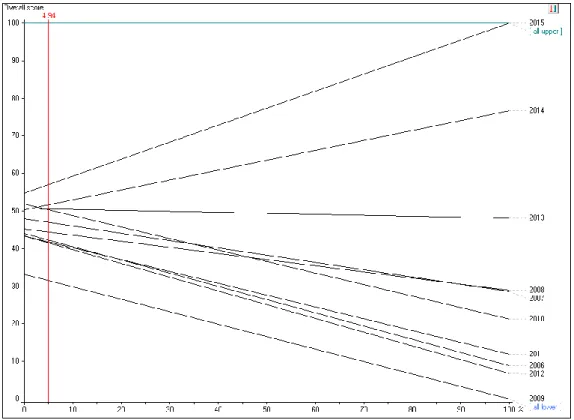
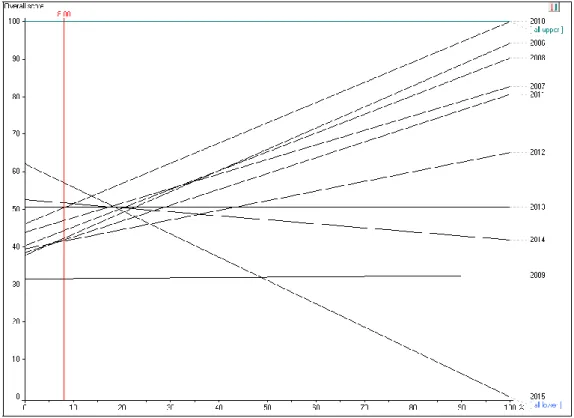
Figure 4-11: Sensitivity analysis on weight for average fleet age KPI. ... 38
Figure 4-12: Sensitivity analysis on weight for labour cost KPI. ... 38
Figure 4-13: Sensitivity analysis on weight for CO2 emissions per transported tonnes KPI. .... 39
Figure 4-14: Operational value profile for Cargolux. ... 40
Figure 4-15: Financial value profile for Cargolux. ... 41
Figure 4-16: Fleet value profile for Cargolux. ... 41
Figure 4-17: Personnel value profile for Cargolux. ... 42
Figure 4-18: Environment value profile for Cargolux. ... 42
Figure 4-19: MACBETH value tree for the efficiency assessment. ... 43
Figure 4-20: Efficiency KPAs weights. ... 44
Figure 4-22: Sustainability KPIs weights. ... 45
Figure 4-23: Cargolux and Lufthansa Cargo efficiency evolution. ... 48
Figure 4-24: Sensitivity analysis on weight for ATK per labour cost KPI (Cargolux). ... 49
Figure 4-25: Sensitivity analysis on weight for operational revenue per number of aircraft KPI (Lufthansa Cargo). ... 49
Figure 4-26: Productivity value profile for Cargolux. ... 50
Figure 4-27: Sustainability value profile for Cargolux... 51
Figure 4-28: Productivity value profile for Lufthansa Cargo. ... 52
Figure 4-29: Sustainability value profile for Lufthansa Cargo. ... 52
Figure 4-30: Cargolux and Lufthansa Cargo overall scores. ... 53
Figure II-1: Sensitivity analysis on weight for revenue tonne kilometres KPI. ... 83
Figure II-2: Sensitivity analysis on weight for available tonne kilometres KPI. ... 83
Figure II-3: Sensitivity analysis on weight for cargo and mail carried KPI. ... 84
Figure II-4: Sensitivity analysis on weight for operational revenue KPI. ... 84
Figure II-5: Sensitivity analysis on weight for operational profit (loss) KPI. ... 85
Figure II-6: Sensitivity analysis on weight for equity ratio KPI. ... 85
Figure II-7: Sensitivity analysis on weight for total assets KPI. ... 86
Figure II-8: Sensitivity analysis on weight for total liabilities KPI. ... 86
Figure II-9: Sensitivity analysis on weight for average aircraft utilisation KPI. ... 87
Figure II-10: Sensitivity analysis on weight for a number of freighter aircraft in the fleet KPI. ... 87
Figure II-11: Sensitivity analysis on weight for revenue per employee KPI. ... 88
Figure II-12: Sensitivity analysis on weight for a number of employees KPI. ... 88
Figure II-13: Sensitivity analysis on weight for injury rate KPI. ... 89
Figure II-14: Sensitivity analysis on weight for fuel used KPI. ... 89
Figure II-15: Sensitivity analysis on weight for fuel cost KPI. ... 90
Figure I-16: Sensitivity analysis on weight for CO2 emissions KPI. ... 90
Figure II-17: Sensitivity analysis on weight for load-factor KPI (Cargolux). ... 91
Figure II-18: Sensitivity analysis on weight for transported tonnes per number of aircraft KPI (Cargolux). ... 91
Figure II-19: Sensitivity analysis on weight for transported tonnes per ATK KPI (Cargolux). .. 92
Figure II-20: Sensitivity analysis on weight for RTK per labour cost KPI (Cargolux). ... 92
Figure II-21: Sensitivity analysis on weight for operational revenue per transported tonnes KPI (Cargolux). ... 93
Figure II-22: Sensitivity analysis on weight for operational revenue per RTK KPI (Cargolux). . 93
Figure II-23: Sensitivity analysis on weight for operational revenue per number of aircraft KPI (Cargolux). ... 94
Figure II-24: Sensitivity analysis on weight for operational revenue per ATK KPI (Cargolux). . 94
Figure II-25: Sensitivity analysis on weight for operational costs per ATK KPI (Cargolux). ... 95
xix Figure II-27: Sensitivity analysis on weight for transported tonnes per number of aircraft KPI (Lufthansa Cargo). ... 96 Figure II-28: Sensitivity analysis on weight for transported tonnes per ATK KPI (Lufthansa Cargo). ... 96 Figure II-29: Sensitivity analysis on weight for RTK per labour cost KPI (Lufthansa Cargo). ... 97 Figure II-30: Sensitivity analysis on weight for ATK per labour cost KPI (Lufthansa Cargo). ... 97 Figure II-31: Sensitivity analysis on weight for operational revenue per transported tonnes KPI (Lufthansa Cargo). ... 98 Figure II-32: Sensitivity analysis on weight for operational revenue per RTK KPI (Lufthansa Cargo). ... 98 Figure II-33: Sensitivity analysis on weight for operational revenue per ATK KPI (Lufthansa Cargo). ... 99 Figure II-34: Sensitivity analysis on weight for operational costs per ATK KPI (Lufthansa Cargo). ... 99
xxi
List of Tables
Table 2-1: Top 15 air cargo carriers in 2015. ... 11
Table 3-1: Methodologies to evaluate different air transportation actors. ... 15
Table 3-2: Significance of MACBETH semantic scales. ... 18
Table 3-3: Key performance areas and key performance indicators for air cargo carriers (performance). ... 21
Table 3-4: Key performance areas and key performance indicators for air cargo carriers (efficiency). ... 22
Table 3-5: Descriptors of performance structure. ... 23
Table 3-6: Ranking of the airlines KPAs. ... 25
Table 3-7: Ranking of all the KPIs in financial KPA. ... 25
Table 4-1: Cargolux performance table of scores. ... 34
Table 4-2: Cargolux efficiency table of scores. ... 46
Table 4-3: Lufthansa Cargo efficiency table of scores. ... 47
Table I-1: Ranking of performance KPAs. ... 67
Table I-2: Ranking of fleet KPIs. ... 67
Table I-3: Number of freighter aircraft in the fleet KPI variation. ... 67
Table I-4: Average fleet age KPI variation. ... 67
Table I-5: Average aircraft utilisation KPI variation. ... 68
Table I-6: Ranking of financial KPIs... 68
Table I-7: Operational revenue KPI variation. ... 68
Table I-8: Operational costs KPI variation. ... 69
Table I-9: Operational profit (loss) KPI variation. ... 69
Table I-10: Equity ratio KPI variation. ... 69
Table I-11: Total assets KPI variation. ... 70
Table I-12: Total liabilities KPI variation. ... 70
Table I-13: Ranking of operational KPIs. ... 70
Table I-14: Revenue tonne kilometres KPI variation. ... 71
Table I-15:Available tonne kilometres KPI variation. ... 71
Table I-16: Load-factor KPI variation. ... 71
Table I-17: Cargo and mail carried KPI variation. ... 71
Table I-18: Ranking of personnel KPIs. ... 72
Table I-19: Number of employees KPI variation. ... 72
Table I-20: Injury rate KPI variation. ... 72
Table I-21: Revenue per employee KPI variation. ... 73
Table I-22: Labour cost KPI variation... 73
Table I-24: CO2 emissions KPI variation. ... 74
Table I-25: CO2 emissions per transported tonne KPI variation. ... 74
Table I-26: Fuel used KPI variation. ... 74 Table I-27: Fuel cost KPI variation. ... 75 Table I-28: Ranking of productivity KPIs. ... 75 Table I-29: Load-factor KPI variation. ... 75 Table I-30: Transported tonnes per number of aircraft KPI variation. ... 75 Table I-31: Transported tonnes per ATK KPI variation. ... 76 Table I-32: ATK per labour cost KPI variation. ... 76 Table I-33: RTK per labour cost KPI variation. ... 76 Table I-34: Raking of sustainability KPIs. ... 77 Table I-35: Operational revenue per RTK KPI variation. ... 77 Table I-36: Operational revenue per ATK KPI variation. ... 77 Table I-37: Operational costs per ATK KPI variation. ... 78 Table I-38: Operational revenue per transported tonnes KPI variation. ... 78 Table I-39: Operational revenue per number of aircraft KPI variation. ... 78
xxiii
List of Acronyms
ACI-NA Airports Council International – North America ACMI Aircraft, Crew, Maintenance, and Insurance AFTK Available Freight Tonne Kilometre
AHP Analytic Hierarchy Process ATK Available Tonne Kilometre DEA Data Envelopment Analysis FTK Freight Tonne Kilometre GDP Gross Domestic Product
IATA International Air Transport Association
MACBETH Measuring Attractiveness by a Categorical Based Evaluation Technique MCDA Multi-Criteria Decision Analysis
KPA Key Performance Area KPI Key Performance Indicator RPK Revenue Passenger Kilometre RTK Revenue Tonne Kilometre SFA Stochastic Frontier Analysis TFP Total Factor Productivity
TOPSIS Technique for Order Preference by Similarity to Ideal Solution USD United States Dollar
1
Chapter 1 – Introduction
1.1. Motivation
Air cargo was traditionally considered as a by-product of passenger air transport, but in the last decade, a defined strategy for air cargo has gained an important position in the strategies of most combination airlines. Thus contributing to increasing the profit of these airlines [1] and allowing the development and growth of all-cargo carriers and integrators1.
Worldwide, air cargo transport grew about 50% faster than passenger air transport from 1995 to 2004 [2] and continued to grow considerably in recent years. According to Figure 1-1, in 2015, the volume of air freight had an average of 17 billion freight tonne kilometres (FTKs) flown per month, showing a recovery from the global financial crisis that began in 2007.
Figure 1-1: Total air freight and passenger volumes. Source: [3].
The air freight industry has a great impact on the global economy probably because it is the main mode of transport of perishable products, luxury goods or high-value products [4]. The e-commerce websites like Amazon or eBay depend on the express delivery services to send the products to their customers. Another example of an industry that relies on air transport speed and efficiency is the pharmaceutical industry in transporting high-value, time, and temperature sensitive cargo. Air cargo also plays a key role in the carriage of live animals over long distances and in humanitarian aid [5].
Although the air freight industry only covers a limited amount of world trade regarding tonnage, the share of air freight regarding value is substantial. In fact, according to [6], in 2014, airlines transported more than 35% of global trade by value but less than 1% of world trade by volume, which is equivalent to 6.8 trillion USD worth of goods transported annually.
Together, the speed and reliability necessary in the contemporary cargo supply chain made air cargo a dynamic industry. As the demand for door-to-door service rather than just airport to airport service increases, the integrators have developed and expanded quickly over the last years.
Despite the thinness of the air cargo literature and the limited data revealed by the industry, there has been a gradual shift of attention towards it in last years. The increase of goods transported by air makes relevant to study this subject addressing all the activity areas of air cargo carriers. With the constant changes and the increasing competition in the air transport market, the airlines are challenged to manage their operations efficiently to adapt and respond to the variations in the global competitive market creating the need to carry out a performance and efficiency evaluation to understand how air cargo carriers can operate more efficiently.
1.2. Object and Objectives
The object of this study is air cargo carriers performance and efficiency, and the objectives are to assess its performance and efficiency employing a Multi-Criteria Decision Analysis (MCDA) methodology to perform a self-benchmarking and a peer-benchmarking analysis.
Therefore, this work has three specific sub-objectives:
The first one is to identify the performance areas and the performance indicators and select which are the key performance areas and key performances indicators to evaluate the performance and efficiency of air cargo carriers.
The second one is to create a database for all the KPIs in a ten-year period (2006 to 2015) from Cargolux and Lufthansa Cargo which will be applied into the MCDA methodology.
The third one is to analyse the results from the performance case study of Cargolux and analyse and compare the results from the efficiency case study made to Cargolux and Lufthansa Cargo.
1.3. Methodology and Structure
This dissertation is structured into five chapters.
The first chapter presents the work introduction, the motivation, the object and the specific objectives, the methodology and the dissertation structure.
3 In chapter two is done a state of the art review concerning the airlines benchmarking and the air cargo industry in general, describing the evolution of air cargo, identifying the main players in the market and analysing the different business models adopted by the different type of carriers.
The third chapter consists of an analysis of the chosen MCDA tool, the MACBETH (Measuring Attractiveness by a Categorical Based Evaluation Technique) and its importance for this study, beginning with a state of the art review of the methodologies usually used by other authors to benchmark airline’s, including MCDA. Besides, operational details, strengths and limitations of MACBETH are explained to support the utilisation of this tool in the airline's performance and efficiency evaluation. This chapter also includes the identification of the key performance areas and key performance indicators to study the performance and efficiency of air cargo carriers.
Chapter four describes the case studies where is conducted a performance analysis of Cargolux and afterwards, an efficiency analysis of Cargolux and Lufthansa Cargo, using MACBETH. Then, the obtained results of the two case studies are analysed and discussed.
The fifth chapter presents the work conclusions, the dissertation synthesis, a few concluding remarks, and some insights and challenges for future research.
In Figure 1-2 is presented the methodology and structure of this dissertation.
Figure 1-2: Dissertation structure and methodology. Source: own composition.
Chapter 1
•Motivation •Objetives of the Research
Chapter 2
•Literature Review: Air Cargo Industry
•Overview of the Air Cargo Industry: Evolution, Main Actors and Bussiness Models
•Identification of Key Performance Areas and Key Performance Indicators
Chapter 3
•Literature Review: Performance and Efficiency Evaluation Methogologies •Methodology Adopted
Chapter 4
•Case Study 1: Performance Evaluation of Cargolux
•Case Study 2: Efficiency Evaluation of Cargolux and Lufthansa Cargo •Discussion of Results
Chapter 5
•Concluding Remarks •Prospects for Future Work
5
Chapter 2 – The Air Cargo Industry
2.1. Introduction
This chapter describes the state of the art review concerning the characteristics of the air cargo industry, including the historical development of the air cargo services over the years and the expected evolution, the different business models and the main players existing in the market. Moreover, the term benchmarking is defined and are summarised a few studies about benchmarking applied to airlines.
2.2. Evolution of Air Cargo
Air cargo, which is defined in this study as anything other than people or personal baggage transported by air in freighter aircraft or under the main deck (belly) of passenger aircraft, is a major mode of transport in the world today not only for mail anymore, but also for perishable products, luxury goods and high-value products. Over the years, the importance of air cargo has been underestimated, however, in the globalised world that we live in, is essential to the development of many countries, allowing air transportation to become the preferred mode of transport for many commodities (Button & Stough, 2000)2.
With air cargo, the most diverse countries, regardless of its location, can be efficiently connected to distant markets and to the global supply chains, having an advantage over those without such capability. Several authors concluded that freight transportation has a great impact on the economy and is responsible for the economic and social development of some areas [7]–[9]. Air cargo is closely linked to international trade whose expansion has been allowed by the removal of physical restrictions and growth of commercial opportunities through improved communications and international contacts [5].
The main traffic measure used by the aviation industry is the revenue (or freight) tonne kilometres (RTKs), which are preferred to transported tonnes because it aggregates both the weight and distance travelled. For instance, the capacity may be enough regarding weight but not regarding volume. These multiple dimensions are a key feature of freight, which renders both complexity and uncertainty to air cargo capacity management [10].
Figure 2-1 shows the evolution of the air freight transport from 1980 to 2012 worldwide. It is evident from this figure that there was an evident increase in air freight transportation – from about less than 50,000 million RTKs in 1980 to more than 200,000 million RTKs in 2012. According to [8], this growth is mainly due to the tonnes carried, which increase more than the
kilometres flown. Thus resulting from significant developments in demand and supply side of the air cargo market liberalisation; such as a growing world trade, technological progress, increasing value/weight rate of goods, downward pressure on air freight yields, changing production processes and strategic importance of e-services.
Figure 2-1: World air cargo traffic evolution in RTKs. Source: [11].
Due to the vulnerability of the air transport industry, some global events in the past years, as the September 11th, 2001 terrorist attacks or the financial and economic crisis that started in
2007, led to a downturn in the aviation markets, with the number of freight and passengers carried decline. These events can be easily identified in Figure 2-1, with a considerable decrease in the RTKs transported, especially, the recession from 2008. As a result, the load-factor also suffered a decrease, as shown in Figure 2-2, since the load-load-factor represents the RTKs as a percentage of the available tonne kilometres (ATKs).
Figure 2-2: Freight load-factor worldwide. Source: [12].
7 In fact, [13] verified that the freight market was impacted harder and quicker than the passenger market, while the first decreased 10% and the second only decreased 1% in 2009. Usually the cargo business is more vulnerable than the passenger business but, on the other hand, the cargo market recovers first.
Another factor that bounds the air transport development is that there are many direct and indirect costs involved as illustrated in Figure 2-3. These costs have a great impact on the economic structure of airlines. The direct costs are associated, for example, with the purchase/lease of aircraft, the maintenance of aircraft and own equipment, the staff or the fuel consumed. On the other hand, indirect costs are related, for example, to internal management and ground operations [14].
Figure 2-3: Air cargo operating costs. Source: [14].
Labour cost is one example of the costs that contribute to the airlines’ direct costs and represents those associated with the wages paid to workers and related taxes and benefits. Another example is the cost associated with the fuel used. Fuel price, and consequently, fuel cost have the highest impact on the airline’s direct costs [15].
Jet fuel is a major variable cost component in the airlines’ operations. Figure 2-4 shows that there were significant fluctuations in jet fuel prices, with a substantial increase between 2004 and 2008, followed by a fast decline to the 2004 price level again. Then the price rises again, until the end of 2014, when occurred a decrease in the price that remains until today. Thereat,
there have been continuous efforts of airlines and aircraft manufacturers to enhance operation and product efficiency to surpass the financial problems caused by the fluctuations in jet fuel prices (Air Transport Association, 2008)3.
Figure 2-4: Evolution of jet fuel and oil price per barrel. Source: [16].
Though, the industry seems now to have recovered from the global crisis started in 2007. Global forecasts indicate that with the global gross domestic product (GDP) and the world trade growth acceleration, air cargo traffic, measured in RTKs, will grow an average 4.7% per year over the next two decades [17].
2.3. Air Cargo Business Models
There are several business models in the air cargo market adopted by the three different types of air carriers [1], [18]: the all-cargo carriers, the combination carriers and the integrators. Each business model from each type of company will be described below.
2.3.1. All-Cargo Carriers
All-cargo carriers only operate dedicated freighters, which are passenger aircraft that have been altered for cargo operations. Freighters, for example, have no seats or windows and have larger doors than aircraft configured for passenger service and reinforced floors [18].
These carriers, instead of working directly with shippers, work with intermediaries called freight forwarders. All-cargo carriers often have long-term contracts with the forwarders, which provides some stability in demand for carriers. These long-term contracts provide
9 economies of scale for the airlines enabling them to enter into long-term contracts to lower purchasing price and hedge against price uncertainty [19].
Approximately 10% to 15% of world air cargo traffic is moved by all-cargo carriers [18]. Cargolux, AirBridgeCargo or Kalitta Air are some examples of all-cargo carriers.
2.3.2. Combination Carriers
This type of carriers focus mainly on passengers but use the spare space in the belly of the aeroplanes to transport cargo. Although, sometimes these carriers also operate freighters to complement their cargo capacity. Cathay Pacific, Korean Air, Emirates, Lufthansa, Air France and KLM are some examples of combination carriers that incorporated air freight in their overall business model.
Today, more than 50% of international air cargo is moved in the bellies of passenger aircraft and that value will increase to more than 60% in the next 20 years, according to Figure 2-5. On the other hand, the freight moved by dedicated freighters will also increase, in a considerable way, from 93 billion to 160 billion FTK’s, representing almost 40% of the transported cargo by 2035.
Figure 2-5: Worldwide share of belly and dedicated freighters. Source: [21].
Despite the growth in the air cargo segment worldwide, combination airlines usually treat cargo business as a complementary service of overall group’s revenue and the routes are based on the passenger business [20]. In fact, the revenue generated by cargo is much smaller than the revenue created by the transport of passengers, as seen in Figure 2-6. Note that for most of the airlines, the share of passenger and cargo revenues does not reach 100% because such airlines have other sources of revenue such as engineering, maintenance services or in-flight catering.
Figure 2-6: Passenger and cargo shares of revenues in 2013. Source: [22].
Although, combination carriers are now starting to recognise the importance of the air cargo business. Such reason is taking these carriers to expand their fleet by the incorporation of newly dedicated freighters, to offer more reliability, more predictability and more control over timing and routing. As a result, the number of dedicated freighters is expected to grow by more than 50%, from 1.720 aeroplanes in 2014 to 2.930 by 2034 [11].
Like all-cargo carriers, combination carriers do not own the end-costumer relationship, so they have to source the cargo through the forwarders to provide the pickup and delivery services [1].
2.3.3. Integrators
Integrators (or integrated carriers) can be defined as “vertically integrated express companies
that provide time-definite, door-to-door services and, for that purpose, perform their own pick-up and delivery services, operate their own fleet of aircraft and trucks and tie all together with advanced information and communication technologies” (Zondag, 2006)4. There are four
major integrators in the world today: FedEx, UPS, TNT and DHL.
In contrast with non-integrated carriers, integrators work directly with shippers, offering an integrated transportation chain with a door-to-door service, acting simultaneously as forwarders and carriers. The cost for these services are higher than for other modes of transportation, however, as mentioned above, integrated carriers usually operate their freighters and delivery vehicles, providing all the handling services themselves until the cargo reaches its final destination [19].
11 These companies have developed and expanded quickly over the last years, “responding to the
shippers’ need for guaranteed service with late pickup and early delivery, and with seamless door-to-door service all over the world to support the concept of just-in-time manufacturing logistics and supply chain management” [23] (p. 321).
Table 2-1 presents the biggest air carriers (all-cargo, combination and integrated carriers), regarding revenue tonne kilometres in 2015.
Table 2-1: Top 15 air cargo carriers in 2015.
Rank Airline RTK (million)
1 Federal Express 15,799
2 Emirates 12,157
3 United Parcel Service 10,807
4 Cathay Pacific Airways 9,935
5 Korean Air 7,761 6 Qatar Airways 7,660 7 Lufthansa 6,888 8 Cargolux 6,309 9 Singapore Airlines 6,083 10 Air China 5,718
11 China Southern Airlines 5,355
12 China Airlines 5,343
13 China Eastern Airlines 4,542
14 Etihad Airways 4,400
15 Polar Air Cargo 4,186
Total 112,943 Source: [24].
2.4. The Main Players
The air cargo transport chain involves a series of players, such as shippers, forwarders, carriers and a consignee (Derigs et al., 2009)5. The shipper is the one that has a product shipped from
one place to another. The forwarder arranges the door-to-door transport (air, road, sea, or rail) of the shipment and takes care of all the necessary documentation, acting as the intermediary between the shipper and the carriers. The carrier is responsible for the airport-to-airport transportation. For last, the consignee is the one that receives the product [4], [10].
However, if the integrators transport the good, all the phases of transportation are arranged by the integrated carrier, which provides a door-to-door service directly from the shipper to
the consignee. Integrated carriers sell capacity directly to shippers. Thus, the decision problems for integrated carriers are mostly centralised, and no games on pricing and capacity allocation are played between airlines and forwarders. This way, integrators have relatively simpler problems in the transportation of goods than the non-integrated carriers [10]. Both scenarios of integrated and non-integrated services in the cargo supply chain are illustrated in Figure 2-7.
Figure 2-7: Air cargo supply chain. Source: [18].
Air cargo carriers provide freight forwarders and shippers with services, such as, consultation, capacity booking, pickup, receiving, packaging, loading, transportation, dispatching, and cargo tracking. The cargo is classified into different levels according to the priority level required by the shipper and the type cargo, such as dangerous goods, live animals, perishable foods, and high-value items (Nobert & Roy, 1998)6.
13 At the airport, the air cargo carrier, responsible for the airport-to-airport transportation, receives the goods and the corresponding documentation. After, the cargo is inspected and loaded into the containers and pallets, which in turn are loaded into the aeroplane [18].
Finally, at the destination airport, the cargo is verified and moved to a warehouse, to deliver the cargo to the forwarder, which will deliver goods to the consignee, completing the supply chain process [10].
2.5. Air Cargo Carriers Benchmarking
Measuring airlines performance and efficiency is a key to success and efficient management of airlines. Benchmarking is the process of identifying best practices, understanding their meaning about business and adopting these practices to help airlines, and in this case, air cargo carriers, to improve their performance and efficiency. The comparison to a defined data set provides organisations with similar opportunities to establish performance goals with standards and measures that would be considered a performance benchmark. Over designated time frames, benchmarking can improve operating levels and lead to improved organisational efficiency and performance [19].
There are several related studies concerning the air transportation. Most of the studies focus on the passenger airlines, rather than the air cargo carriers. For example, [25] studied the efficiency and effectiveness of passenger airlines, using five key performance areas, namely, cost, productivity, service quality, price and management to help the airlines to identify its competitive advantages relative to another airline. Furthermore, [26] defined a set of key performance indicators, considering the financial ratios to have a more comprehensive study, and evaluated the performance of passenger airlines, dividing the total performance into three key performance areas: production, marketing and management. On the other hand, [27] defined a set of recommended key performance indicators to perform an operational and economic analysis of airlines.
Moreover, [28] analysed the impact of strategic management and fleet planning decisions on the efficiency of airlines focused on passengers, while [29] examined several passenger airlines in terms productivity, yield and cost competitiveness. Besides, [30] analysed the airlines regarding efficiency and instigated which factors account for differences in efficiency.
Although most of the studies focus on the passenger airlines and sometimes consider the cargo operations as a complementary service that enhances the group’s overall performance [20], there are some studies related to air cargo market and, more specifically, to air cargo carriers. For example, [23] evaluated the competitiveness of integrators, studying several service factors: promptness, accuracy, safety, convenience, economic efficiency and dependability while [31] identified the competitive service factors of cargo carriers. Furthermore, [13]
analysed the evolution and the key characteristics of the air cargo industry in order to better understand the impact of the cost structure on the strategic behaviour of integrators; while [1] investigated the strategies of all-cargo and combination carriers and defined a set of key performance indicators grouped into the product, market and network strategies.
As mentioned above, the literature focusses more on the passengers’ side than on the cargo market, and this research aims to fill this gap. Also, it will be investigated a larger range of key performance areas and key performance indicators which contribute to the overall performance and overall efficiency to create a competitive advantage for any air cargo carrier.
2.6. Conclusion
Air cargo transport is more complex than passenger one because it involves more players, more sophisticated processes, a wide combination of weight and volume, a complex integration and consolidation strategies and multiple itineraries of a network. Moreover, the air cargo has many players involved, and the role of intermediaries is crucial in the air cargo supply chain since each step in the process depends on the successful completion of the previous step.
The forecasts support a global economic growth which also leads to an improvement in air cargo. Nonetheless, there are concerning factors that could hinder the growth of the air cargo, like the rise of jet fuel prices, the turbulence in financial markets or the political uncertainty that could impair the overall development of the industry.
However, air cargo carriers can use benchmarking to measure their performance and efficiency to improve their operations and to reduce their vulnerability to the external factors mentioned above.
15
Chapter 3 – Performance and Efficiency
Evaluation Methodologies
3.1. Introduction
This chapter consists of an analysis of the MCDA tool and its importance for this study. It begins with a state of the art review of the methodologies usually adopted by other authors to benchmark airlines. Besides, there are explained operational details, strengths and limitations of the different methodologies, especially, the Measuring Attractiveness by a Categorical Based Evaluation Technique (MACBETH), to justify the use of this tool in the air cargo carriers’ performance and efficiency evaluation. Also, are presented and defined the key performance areas and indicators and briefly explained the steps needed to assess air cargo carriers performance and efficiency with the MACBETH approach.
3.2. Methodologies
Researches on the measurement of airlines performance and efficiency have used several techniques such as Data Envelopment Analysis (DEA), Total Factor Productivity (TFP) method, Analytic Hierarchy Process (AHP) or Technique for Order Preference by Similarity to Ideal Solution (TOPSIS). The studies reviewed in Section 2.5 applied a single or combination of the methods mentioned above. For instance, while [28] used the DEA and [29] the TFP, [30] applied both DEA and TFP. On the other hand, [25] and [26] used TOPSIS. Regarding the AHP, both [23] and [31] applied this process.
Some studies to evaluate the different air transportation actors (e.g. airlines and airports) often adopted quantitative methods, relying on numerical and secondary data. They also formulated production functions using econometric techniques and advanced efficiency analysis tools [32]. In Table 3-1, is given a theoretical overview of the main approaches used.
Table 3-1: Methodologies to evaluate different air transportation actors.
Methodology Description Weakness
Partial Measure
This method uses partial ratio data to carry out performance comparison of the target sample
in single dimension such as on financial and cost performance of
an airline.
This method only focuses on certain fields of the performance.
The evaluation result of this method would not be able to provide a more comprehensive
evaluation of an airline’s performance.
Methodology Description Weakness
Multi-Criteria Decision Analysis (MCDA)
One of the widely adopted methods. This method can be divided into two main steps: the
first step is to acquire relative weights, and the second step is to
rank the options. Firstly, it selects evaluation KPIs through expert survey or interview, and then chooses an optimal solution
based on those selected KPIs. (e.g. AHP, TOPSIS and MACBETH)
Because the selection of indicators is based on expert’s experience and their judgment,
the results may be affected by subjective factors. Fr onti er Ana ly si s: P a ra m etr ic a ppr oa ch Stochastic Frontier Analysis (SFA) Sometimes referred to as econometric frontier approach, is
one of the main parametric approaches used by researchers
to evaluate efficiency.
Although the parametric approaches take into account the
effect error, which is not considered in non-parametric
approach, the parametric methods still face challenges on
separating random error from efficiency. Fr onti er Ana ly si s: N on -pa ra m etr ic a ppr oa ch Total Factor Productivity (TFP) In economies, TFP is a variable which accounts for effects in total
output not caused by inputs. TFP allows for measuring cost efficiency and effectiveness and
for distinguishing productivity differences in airline performance. This approach can also be used for investigating the impact of variations of input and
output price on an airline’s performance.
TFP requires an aggregation of all outputs into a weighted output
index and all inputs into a weighted input index using
pre-defined weights which can be biased from different viewpoints.
Data Envelopment
Analysis (DEA)
This is an approach that requires no assumptions about the functional form and calculates a
maximal performance measure for each airline relative to all
other airlines.
The key drawback of this technique is that it does not allow
for random error in the data, assuming away measurement error and luck as factors affecting
the outcome, which implies that the measured inefficiency is likely
to be overstated. Source: [32], [33].
17 After a thorough analysis of the different tools shown in Table 3-1, [34] concluded that Measuring Attractiveness by a Categorical Based Evaluation Technique (MACBETH) complied with the requirements needed to assess air cargo carriers performance and efficiency.
Furthermore, [35] studied the impact of the low-cost carriers in the airport’s service quality and [36] studied the performance and efficiency of low-cost carriers and legacy carriers, both using the MACBETH approach. Also, [37] applied the Multi-Criteria Decision Analysis focusing on the airport benchmarking process and in the key performance area of safety. Thus, this dissertation will complement the research about the use of the MACBETH tool and apply this approach to the air cargo carriers benchmarking study.
3.3. Measuring Attractiveness through a Category Based
Evaluation Technique (MACBETH)
Measuring Attractiveness Through a Category-Based Evaluation Technique is a decision-aid approach to multi criteria value measurement with the goal of allowing measurement of the attractiveness or value options through non-numerical pairwise comparison questioning mode [38]. This methodology permits to evaluate options against multiple criteria. According to [38], MACBETH is a humanistic, interactive and constructive approach:
• Humanistic – it can help decision-makers ponder, communicate and discuss their value systems and preferences;
• Interactive – the reflection and learning process can best spread through socio-technical facilitation sustained by straightforward questioning-answering protocols;
• Constructive – it rests on the idea that full-bodied convictions about the kind of decisions to make that do not exist in the mind of the decision-maker, to help to form such convictions and to build robust preferences considering the different options to solve the problem.
The key factor that distinguishes MACBETH from other MCDA methods is that it needs only qualitative judgements about the difference of attractiveness between two elements at the time so that it can generate numerical scores for the options in each criterion and to weight the criteria [39]. The seven MACBETH semantic categories are described in Table 3-2.
Furthermore, [40] and [41] described the mathematical foundations of MACBETH. Consider 𝑋 (with #𝑋 = 𝑛 ≥ 2) be a finite set of elements (alternatives, choice options, courses of action) that an individual or a group, 𝐽, wants to compare in terms of their relative attractiveness (desirability, value).
Table 3-2: Significance of MACBETH semantic scales. Semantic
scale
Equivalent
numerical scale Significance
No 0 Indifference between alternatives.
Very Weak 1 An alternative is very weakly attractive over another.
Weak 2 An alternative is weakly attractive over another.
Moderate 3 An alternative is moderately attractive over another.
Strong 4 An alternative is strongly attractive over another.
Very Strong 5 An alternative is very strongly attractive over another.
Extreme 6 An alternative is extremely attractive over another.
Source: [42].
Ordinal value scales (defined on 𝑋) are quantitative representations of preferences that reflect, numerically, the order of attractiveness of the elements of 𝑋 for 𝐽. The construction of an ordinal value scale is a straightforward process, provided that 𝐽 is able to rank the elements of 𝑋 by order of attractiveness – either directly or through pairwise comparisons of the elements to determine their relative attractiveness. Once the ranking is defined, one needs only to assign a real number 𝑣(𝑥) to each element 𝑥 of 𝑋, in such a way that:
1. 𝑣(𝑥) = 𝑣(𝑦) if and only if 𝐽 judges the elements 𝑥 and 𝑦 to be equally attractive; 2. 𝑣(𝑥) > 𝑣(𝑦) if and only if 𝐽 judges 𝑥 to be more attractive than 𝑦.
A value difference scale (defined on 𝑋) is a quantitative representation of preferences that is used to reflect, not only the order of attractiveness of the elements of 𝑋 for 𝐽, but also the differences of their relative attractiveness, meaning, the strength of 𝐽’s preferences for one element over another.
Using MACBETH, 𝐽 is asked to provide preferential information about two elements of 𝑋 at a time, firstly by giving a judgement as to their relative attractiveness (ordinal judgement) and secondly, if the two elements are not deemed to be equally attractive, by expressing a qualitative judgement about the difference of attractiveness between the most attractive of the two elements and the other. Moreover, to ease the judgemental process, six semantic categories shown above, are offered to 𝐽 as possible answers.
By pairwise comparing the elements of 𝑋 a matrix of qualitative judgements is filled in, with either only a few pairs of elements, or with all of them (in which case 𝑛 ∗ (𝑛 − 1)/2 comparisons would be made by 𝐽).
19 It is necessary to obtain the maximum amount of data to develop a robust model. The next step is to create a value tree with nodes, or, in other words, a decision model. The nodes correspond to the key performance indicators that are going to be considered, and the decision makers define the attractiveness of each indicator. The next step is to fill the performance table of each indicator with the data collected [33].
The next step is where is defined the attractiveness of each indicator in the value tree. After considering the attractiveness of each node, the deciders must set the attractiveness difference between each pair of indicators in the model too. Subsequently to the introduction of these values for each node, it is possible to produce a robustness table still giving the opportunity to the decider to adjust the sensibility of the model [34].
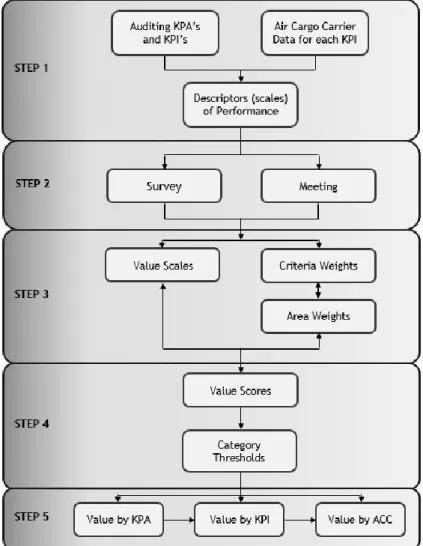
Briefly, this study to assess air cargo carriers’ performance and efficiency can be divided into six different steps (Figure 3-1): structuring (step 1); survey and meeting (step 2); evaluation (step 3); classification (step 4); and outputs (step 5). Although the sequence of the task is as shown, it is possible to redefine or adjust any task at any time.
Figure 3-1: Activities needed to perform an air cargo carriers evaluation. Source: [43]
3.3.1. Structuring
Structuring (step 1) consists of the definition of the value tree and in the data collection of Cargolux and Lufthansa Cargo to build the descriptors of performance consisting of a four-level scale for each key performance indicator.
In this step, it was necessary to define a set of KPA and KPI that could relate all the airline operations with the aim to evaluate all the different sectors of the company that influence the performance and efficiency. However, these set of KPA and KPI still was not defined by a recognized global organization. So to perform such evaluations, it was necessary to identify the most relevant indicators in the literature reviewed in Sections 2.4 and 3.2, in the annual reports of several air cargo carriers [44]–[62], from IATA [63] and in meetings and discussions with industry experts.
This study was divided into five KPAs for the performance case study and into two KPAs for the efficiency case study to obtain a more manageable set of KPIs. However, for each activity area were identified a significant number of performance indicators making the original set too large to be used, so it had to be narrowed down to reduce the number of performance indicators by understanding which are the ones more representative for each activity area. A meeting with several industry experts took place with the aim of obtaining a smaller set, which still represents each key performance area in a proper way. Though, due to some inconsistencies and lack of data in the air cargo industry, some airlines have been excluded from this evaluation.
Thus, it was created a set of five KPAs - fleet, financial, operational, personnel and environment, for the performance evaluation and a set of two KPAs - productivity and sustainability, for the efficiency evaluation. Each one of the KPA is composed with several KPI. The resulting sets of KPAs and KPIs are presented in Table 3-3 and Table 3-4, respectively.
After all the data collected, it was possible to fill the table of performance and to define the descriptors of performance of each key performance indicator. Only after the collection of all the data for all the years, it is possible to study the individual KPI. In Figure 3-2, it is possible to depict the data for all the KPIs of the operational KPA in the table of performance, from 2006 to 2015.
21 Table 3-3: Key performance areas and key performance indicators for air cargo carriers (performance).
Source: [64]. Key Performance
Areas (KPAs) Key Performance Indicators (KPIs) Units Description
Fleet: measures
relating to airline’s fleet and its utilisation.
Number of Freighter
Aircraft in Fleet [number] Number of freighter aircraft in the company's fleet. Average Fleet Age [years] Average age of the fleet.
Average Aircraft
Utilisation [hours]
Average hours each aircraft is used in each day (block hours).
Financial: measures
relating to company’s costs, revenues, assets and liabilities.
Operational Revenue [USD ‘000] Total operational revenue of the company. Operational Costs [USD ‘000] Total operational costs of the company.
Operational Profit (Loss) [USD ‘000] Profit earned from core business operations, also known as EBIT.
Equity Ratio [%] Ratio of shareholders’ equity to total assets. Total Assets [USD ‘000] Total amount of assets of the company.
Total Liabilities [USD ‘000] Total amount of financial obligations of the company.
Operational: measures
relating to all the cargo and mail carried by airline and its capacity.
Revenue Tonne Kilometres [millions] Traffic volume, measured in load tonnes from the carriage of cargo and mail multiplied by the kilometres flown. Available Tonne
Kilometres [millions]
Overall capacity, measured in tonnes available for the carriage of cargo/mail multiplied by the kilometres flown.
Load-Factor [%] Revenue tonne kilometres expressed as a percentage of available tonne kilometres.
Cargo and Mail Carried [tonnes] Total tonnes of cargo/mail carried by the company.
Personnel: measures
relating to personnel productivity.
Number of Employees [number] Total number of employees of the company. Injury Rate [%] Rate of injuries during working time.
Revenue per Employee [USD ‘000/ /employee]
Total operational revenue per total number of employees of the company.
Labour Cost [USD ‘000] The cost of wages and benefits paid to workers, plus related taxes.
Environmental:
measures relating to airline’s performance, regarding CO2 emissions
and fuel used.
CO2 emissions [tonnes]
Total tonnes of carbon dioxide emitted by all of the company's fleet.
CO2 emissions per
Transported Tonne [number]
Total tonnes of CO2 emissions divided per total tonnes of cargo/mail transported.
Fuel Used [tonnes] Total tonnes of jet fuel used.
Table 3-4: Key performance areas and key performance indicators for air cargo carriers (efficiency).
Source: [64].
Figure 3-2: Example of a MACBETH performance table for operational KPA. Source: own composition.
Descriptors of performance, presented in Table 3-5, are formed by four reference levels of accomplishment and allow the performance and efficiency assessment of each KPI by tracing the performance profile for each key performance area. For all the air cargo carriers descriptors were established two reference levels – the “good” and the “neutral” levels. These levels, which have a fundamental meaning for managers, were defined for each KPI. That is: the “good” level was established as the best level of performance in the ten year period of this study indicating that no improvement is required; the “neutral” level was established as the worst level of performance in the ten year period of this study stating that is neutral in terms
Key Performance
Areas (KPAs) Key Performance Indicators (KPIs) Units Description
Productivity:
measures relating to company’s efficiency taking into account the cargo transported or the fleet.
Load-Factor [%] Revenue tonne kilometres expressed as a
percentage of available tonne kilometres. Transported Tonnes per
Number of Aircraft [tonnes/aircraft] Total transported tonnes per number of aircraft. Transported Tonnes per ATK [tonnes] Total transported tonnes per total ATKs. ATK per Labour Cost [USD] Available tonne kilometres per labour cost. RTK per Labour Cost [USD] Revenue tonne kilometres per labour cost.
Sustainability:
measures relating to airline’s ability to support an activity over a long term.
Operational Revenue per RTK [USD] Total operational revenue per total RTKs. Operational Revenue per ATK [USD] Total operational revenue per total ATKs. Operational Costs per ATK [USD] Total operational costs per total ATKs. Operational Revenue per
Transported Tonnes [USD/tonnes]
Total operational revenue per total transported tonnes.
Operational Revenue per