UNIVERSIDADE DA BEIRA INTERIOR
Engenharias
Sequential Combustion in Aircraft Propulsion:
Inter-turbine Reheat in a Civilian High Bypass
Ratio Turbofan Engine
Pedro Miguel Baião Santos
Dissertação para obtenção do Grau de Mestre em
Engenharia Aeronáutica
(Ciclo de Estudos Integrado)
Orientador: Prof. Doutor Francisco Miguel Ribeiro Proença Brójo
Dedication
Acknowledgements
The author would like to thank Pr. Dr. Brójo, of the Department of Aerospace Sciences of the University of Beira Interior, for his guidance and help in the elaboration of this study. Without his encouragement, it would not be finished in time.
The author would also like to thank his friends and colleagues from the University. For the best part of the past 5 years, they were a constant source of help, entertaining and knowledge. I wish them a future as bright as the one I wish to myself.
To finish, I express particularly the appreciation to the Professors and colleagues that participated with me in the Air Cargo Challenge 2011 competition. Their work and skills were essential to our victory.
Resumo
Ao longo dos últimos 75 anos, avanços tecnológicos nas áreas dos materiais, aerodinâmica, propulsão, computadores, eletrónica e produção industrial, entre várias outras, assim como o apertado controlo de agências governamentais (FAA, EASA) tornaram o avião o meio de transporte mais seguro e fiável do mundo, tornando possível viagens a praticamente qualquer pessoa e possibilitando um rápido contacto com países distantes.
Entre os inúmeros desenvolvimentos tecnológicos que permitiram o desenvolvimento do avião como máquina indispensável da humanidade, está a área da propulsão. Alterações ao ciclo de Brayton, o ciclo térmico utilizado para turbinas de gás, permitiram poupanças de combustível (ciclos mais eficientes), redução de ruido e poluição, maximização do alcance e aumento da tração produzida, associadas às outras áreas já mencionadas. Uma das alterações mais importantes foi o conceito de Bypass, ar que circula o núcleo do motor, evitando a queima do combustível; outras já utilizadas, foram o conceito de intercooler e recuperação de calor.
Contudo, á medida que os aviões crescem em tamanho, também crescem os motores que os permitem voar. Uma alteração que tem sido estudada há alguns anos é o conceito de combustão sequencial: em vez de apenas uma câmara de combustão, entre os compressores e as turbinas, ter duas ou mais entre as várias fases de expansão dos produtos da combustão, levando a um aumento da energia extraída e possibilitando um aumento das dimensões dos componentes do motor, ao mesmo tempo reduzindo a temperatura de pico da combustão nas câmaras. O objetivo deste estudo é aplicar essa alteração ao ciclo de Brayton de um motor a jato atualmente usado no mercado civil e verificar a viabilidade do conceito, em relação ao consumo de combustível vs tração produzida.
Palavras-chave
Abstract
For the past 75 years, technological developments in the fields of materials, aerodynamics, propulsion, computers, electronics and manufacturing, amongst others, as well as the tight control and of government agencies (FAA, EASA) turned the airplane in the most secure and reliable transport in the world, making travel possible to nearly every person and a allowing a fast contact with distant countries.
Amongst the innumerous technological developments that allowed the development of the airplane as an indispensable machine for mankind, is the field of propulsion. Changes to the Brayton cycle, the thermic cycle used for gas turbines, allowed lower fuel consumption, less noise and pollution, wider range and increases in thrust, associated to the other fields already mentioned. One of the most important was the concept of Bypass, air that surrounds the core, avoiding the fuel combustion; others already in use were the concept of intercoolers and heat regenerators.
Still, as the airplanes grow in size, so do the engines that propel them. One change that has been studied for some years is the concept of sequential combustion: instead of one burner, between the compressors and the turbines, two or more are placed between the different expansion phases of the combustion products, increasing the energy extracted and allowing bigger dimensions for the engine’s components, at the same time reducing the peak combustion temperature. The objective of this study is to apply that change to the Brayton cycle of an existing aero-engine currently used in the civilian market and verify the viability of the concept, in the terms of fuel consumption and thrust.
Keywords
Contents
1 Introduction 1 1.1 Motivation 1 1.2 Objective 1 1.3 Contextualization 1 1.4 Thesis Structure 2 2 Literature review 5 2.1 Relevant studies 5 2.2 Aero-engine studies 52.3 ITB programs in development 9
3 Sequential combustion and aero-engines 11
3.1 Industrial turbines 11
3.2 Reheat effect in the Brayton cycle of an aero-engine 12
3.3 Bypass ratio importance in a civilian turbofan engine 12
3.4 Different turbofan engine configurations 14
4 Modelling of RR RB211 Trent 895-17EQ engine 17
4.1 Baseline engine background 17
4.1 Technical specifications of RR RB211 Trent 895-17 18
4.2 GasTurb12 parametric analysis 18
5 TCE thermodynamic cycle 23
5.1 Air flow thermodynamic properties 23
5.2 Fuel-to-air ratio calculation 25
5.3 Compressor and turbine isentropic efficiency 25
5.3 Baseline engine design point script 26
5.5 Two-combustor engine 32
6 TCE parametric analysis 35
6.1 Variable OPR 35
6.2 Constant OPR – FPR vs TET and BR vs TET 37
6.3 Constant TET and OPR – Variable FPR and BR 40
7 Conclusions 47
7.1 Future Work 48
References 49
Annex A: Cooling flow schematic 53
Annex B: Additional information about ITB studies 55
B.1 Liu and Sirignano [2,3] 55
B.2 Liew et al [10] 60
List of Figures
Figure 1: Layout of the 3-ITB turbojet engine (a) and thermodynamic cycle (b) [6].
Figure 2: The effects of the LPTET (i.e. Tt4.5) on the engine’s specific thrust with respect to the variations in the HPTET and flight Mach number [10].
Figure 3: Thrust vs SFC for conventional and ITB turbofan engine [16]. Figure 4: The first gas turbine implemented with an SCC [23].
Figure 5: GT24/26 Gas Turbine [24].
Figure 6: Thermodynamic cycles of a turbojet engine (conventional engine) and a turbojet engine with inter-turbine reheat (ITB engine) [1].
Figure 7: Airbus A350 - engines in wing mounted pods [27].
Figure 8: Future aircraft - engines above the fuselage in tail mounted pods [28]. Figure 9: PW1000G 2-spool geared TF [28].
Figure 10: RR Trent900 3-spool ungeared TF [29].
Figure 11: El Al Boeing 777-200ER, with RR Trent 895 engines [31].
Figure 12: Engine nomenclature, stations and secondary air flows provided by GasTurb12. Figure 13: Turbine NGV and blade (rotor) cooling flow requirements vs SOT [36] and equations for high-tech NGV and rotor cooling flow requirements [8].
Figure 14: TCE engine schematic.
Figure 15: Performance of the ITB engine vs OPR – variable FPR, all other engine parameters equal to the baseline engine.
Figure 16: Performance of the ITB engine with constant OPR vs FPR - variable IPC PR, all other parameters equal to the baseline engine.
Figure 17: Performance of the ITB engine vs BR, all other parameters equal to the baseline engine.
Figure 18: Performance of an ITB engine vs FPR and BR – TET = 1300 K, variable IPC PR, all other parameters equal to the baseline engine.
Figure 19: Performance of an ITB engine vs FPR and BR – TET = 1400 K, variable IPC PR, all other parameters equal to the baseline engine.
Figure 20: Performance of an ITB engine vs FPR and BR – TET = 1500 K, variable IPC PR, all other parameters equal to the baseline engine.
Figure 21: Performance of an ITB engine vs FPR and BR – TET = 1600 K, variable IPC PR, all other parameters equal to the baseline engine..
Figure 22: Cooling flow schematics for two-stage (a) and single-stage turbine (b) [1,37]. Figure 23: Performances of turbojet engines vs compressor pressure ratio at M1 = 2, T04 =
1500 K and T06 = 1900 K.
Figure 24: Performances of turbojet engines vs compressor pressure ratio at M = 0.87, T04 =
1500 K, and T06 = 1900 K.
Figure 25: Performances of turbofan engines vs compressor pressure ratio at M = 0.87. T04 =
1500 K, T06 = 1900 K, BR = 5, and FPR =1.65.
Figure 26: Performances of turbofan engines vs compressor pressure ratio at M = 0.87, T04 =
1500 K, T06 = 1900 K, BR = 8, and FPR = 1.65.
Figure 27: Performances of turbofan engines vs fan bypass ratio at M1 = 0.87, T04 = 1500 K, T06
= 1900 K, CPR = 40, and FPR = 1.65 (left) and Performances of turbofan engines vs fan pressure ratio at M = 0.87, T04 = 1500 K, T06 = 1900 K, CPR = 40, and BR = 8 (right).
Figure 28: Performances of turbofan engines vs flight Mach number: T04 = 1500 K, T06 = 1900
K, CPR = 40, BR = 8, and FPR = 1.65 (left) and Performances of turbofan engines vs turbine inlet temperature at M = 0.87, T06 = 1900 K, CPR = 40, BR = 8, and FPR = 1.65.
Figure 29: Station numbering of a turbofan engine with ITB. Figure 30: Engine layout with cooling airflow.
Figure 31: Performance comparison of base engines vs M, FPR = 1.3, CPR = 28.48, Tt4 = 1600 K
and BR = 4.0.
Figure 32: Performances of cooled turbofan engines vs Tt4 at M0 = 0.85, FPR = 1.3, CPR =
28.48 and BR = 4.0.
Figure 34: Performance of turbofan engine vs. FPR at H = 0 m, M = 0, Tt4 = 1800 K, BR = 8, IPC
PR = 2, HPC PR = 15, W = 2000 kg/s.
Figure 35: Performance of turbofan engine vs BR at H = 0 m, M = 0, Tt4 = 1800 K, FPR = 1.5,
List of Tables
Table 1: Comparison of chosen parameters which determine performance of classical and two combustors turbofan [17].
Table 2: GasTurb12 Basic Data inputs. Table 3: GasTurb12 Secondary Air System.
Table 4: Design Point of Trent 895C-17-EQ engine, obtained by GasTurb12.
Table 5: Polynomial constants for calculation of CP for a given static temperature TS [36] –
cold end gases (pre combustion).
Table 6: Polynomial constants for calculation of CP for a given static temperature TS [36] –
hot end gases (post combustion), FAR being the fuel-to-air ratio. Table 7: Gas constant calculation for several fuels based in FAR [36].
Table 8: FAR calculation [36] – T3 being the HPC exit temperature, T4 being the burner exit temperature and ETA34 being the combustor efficiency.
Table 9: Baseline engine performance (obtained by the Matlab script).
Table 10: Station flow, temperature and pressure obtained in the Matlab script.
Table 11: Thrust and SFC for the ITB engine (HPTET = LPTET) compared to the baseline engine.
List of Acronyms
TCE Two-Combustor Engine
ITB Interstage Turbine Burner
BR Bypass Ratio
FPR Fan Pressure Ratio
IFPR Inner Fan Pressure Ratio OFPR Outer Fan Pressure Ratio
MB Main Burner
IPC Intermediate Pressure Compressor
HPC High Pressure Compressor
HPT High Pressure Turbine
IPT Intermediate Pressure Turbine
LPT Low Pressure Turbine
TET Turbine Entry Temperature
HPTET High Pressure Turbine Entry Temperature LPTET Low Pressure Turbine Entry Temperature
TF Turbofan
CTT Constant Temperature Turbine SFC Specific Fuel Consumption TSFC Thrust Specific Fuel Consumption
PR Pressure Ratio
CPR Compressor Pressure Ratio
GE General Electric
PW Pratt & Whitney
RR Rolls Royce
SCC Sequential Combustion Cycle
FPT Free Power Turbine
PO Power Offtake
FHV Fuel Heating Value
FAR Fuel-to-Air Ratio
ER Expansion Ratio
ISA International Standard Atmosphere
NGV Nozzle Guiding Vanes
TC Thrust Coefficient
1 Introduction
1.1 Motivation
Over the past 65 years, several advances were made in order to improve the engine’s thrust-to-weight ratios, fuel consumption, efficiency and safety. However, the rate of improvements is slowing down, forcing engineers and designers to look for novel cycles or engines to reduce the aircraft’s pollution and noise signatures and, at the same time, meet the demanded requirements from the aircraft’s manufacturers. For civilian applications, where the majority of the thrust produced comes from the bypass flow, the main issue is to achieve bigger Bypass ratios (BR), which means a bigger engine, with higher efficiency and lower fuel consumption.
One of these novel cycles is the concept of two-combustor engine (TCE), which consists of one or more secondary combustion chambers located between the turbines, with the objective of reheating the expanded air, and therefore extract more work from the turbines. The possible advantages include higher net thrusts, lower NOx production, less
noise, lower peak combustion temperatures, smaller number of stages required to extract the necessary work in the turbines and, possibly, lower fuel consumption (higher efficiency engines). Based in this premises, the author made an extensive research on the theme and decided to apply the concept to a civilian high BR turbofan engine and evaluate the results in order to verify if the concept is viable or not when compared to an existing turbofan engine.
1.2 Objective
This study has the objective of evaluating the possible advantages of the Interstage Turbine Burner (ITB) concept to civilian turbofan engines, and determining if the concept is viable. In order to do that, a modern turbofan engine was selected and its performance evaluated, so that the TCE concept can be compared to one of the current engines used in long range commercial jetliners of today.
1.3 Contextualization
In a world where the concerns about the environment and the consequences of pollution (in which the commercial airlines have a large impact) are ever growing, the need for more fuel efficient engines is not only a concern of the authorities (e.g., EASA or FAA), but also from the engine’s manufacturers, even if for publicity and public opinion issues. As the aircraft grow in size, so do the engines that propel them. That places a problem, because the majority of the thrust produced in a civilian aircraft comes from the bypass flow, which
due to constraints from the manufacturer (such as the height from the engines to the ground or engine drag) doesn’t allow them to grow much more than the current values (high BR values are around 8-15 in the most modern civil engines). This means that the Fan Pressure Ratio (FPR) has to be higher, therefore increasing the speed of the air passing through the fan, which leads to an increase of the noise generated by the fan and a lower propulsive efficiency, which goes against the objectives and regulations.
Another problem is that, as the fan size grows, so does the necessary work that has to be extracted from the turbines. This is where the TCE concept can be quite effective: by reheating the expanded air between the turbines, more work can be extracted and therefore a bigger BR can be achieved, in theory. It is also theoretically possible to achieve a smaller TET, because it is not necessary to heat the air to such high temperatures in the main combustion chamber due to the expansion in the HP turbine, basically dividing the fuel burnt in two combustion chambers. So, in theory, a reduction in SFC can be achieved, although this premise is questionable.
So, in order to achieve higher BR at the expense of FPR, the TCE is studied and compared to the original engine in this study, in order to verify its possible application in the future generation of aircraft engines. The engine may also be referred to as ITB engine.
1.4 Thesis structure
In the 1st chapter of the Thesis, the author presents his motivation, objective and
contextualization of the study in today’s aeronautical propulsion challenges.
The 2nd chapter presents some relevant studies related to the theme of the thesis and
presents the known ITB engine programs in development.
The 3rd chapter introduces the reader to the sequential combustion concept in
industrial applications, and the reheat effect in aero-engines. It also states the importance of BR in TF engines and the reasons that constraint its growing and presents the different turbofan engine configurations used today in modern civilian aircraft.
The 4th chapter shows the reader the modelling of the baseline engine used later as
comparison to the ITB-engine’s performance. It is also an introduction to the GasTurb12 software.
The 5th chapter shows the mathematical modelling of the ITB-engine using Matlab
scripts. The aerothermodynamics are explained and the results obtained for the first simulations are summarized.
The 6th chapter shows the results of the parametric analysis conducted to the ITB
engine’s optimization, and its comparison the baseline engine.
The 7th and final chapter shows the author’s conclusions of the study and the viability
of the concept.
Annex A presents the schematic of the cooling flow used in the turbine sections, while Annex B presents extra information about the studies of ITB engines performed by other authors.
2 Literature review
2.1 Relevant studies
As the conventional thermodynamic cycle engines appear to reach their performance limits, novel engine cycles are being investigated in order to expand the flight envelops and/or increase performance [1]. One of these novel cycles is the concept of heat addition or combustion in the expansion process in the aeronautical industry, which is already implemented in the industrial sector. There are two processes to make use of this cycle:
Constant-temperature: In this process, fuel is added and burned in the turbine passage, maintaining a constant temperature during the expansion phase. The turbine with this process is referred to as Constant Temperature Turbine (CTT);
Constant-pressure: In this process, fuel is burnt in a secondary combustion chamber located between the high and low pressure turbines (HPT and LPT, respectively), at approximately the same pressure. This process is known as Interstage Turbine Burner (ITB).
According to Liu and Sirignano [2-3], an engine with sufficient number of ITB’s will tend to have similar performance to that of a CTT engine. Therefore [1], the performance of the CTT engine is considered to be the maximum achievable for that of the ITB engine. In this chapter, some relevant studies and applications of the ITB engine are presented. The CTT engine is too difficult to achieve it with today’s technology [1], although there are already case-projects about its implementation for industrial turbines [4].
2.2 Aero-engine studies
The first author to publish a study of an ITB engine was Vogeler [5]. The baseline engine for comparison was a two-spool turbofan engine with a bypass ratio of 5, with the exact cooling flow rate considered, and two configurations (two-spool and single-spool ITB-engines) were considered, with the ITB between the HP and LP turbines. Compared to the conventional baseline engine, the two-spool ITB supplied a higher thrust at the expense of higher SFC, while the single-spool ITB engine provided extra thrust with lower SFC. The results of the study are considered questionable by Soon [1].
Andriani et al published studies on the ITB applied to the aeronautical sector [6,7], focusing on the on-design performance of ITB turbojet engines. The results show an increase in engine operation flexibility and higher maximum specific thrust with minimal increase in SFC, compared to the conventional engine. In this study, several ITB’s in the turbine stages
contributed to create a CTT engine, as shown in figures 4(a) and 4(b). However, the amount of extra thrust produced was not stated and the approach was simplistic, leading to inaccurate benefits of the ITB [1].
Figure 1: Layout of the 3-ITB turbojet engine (a) and thermodynamic cycle (b) [6].
The first parametric studies about the performance of ITB in turbojet and turbofan engines (design point conditions) were conducted by Liu and Sirignano [2-3], and compared to the conventional engine’s performance. Apart from the LPTET, all the other parameters were kept constant. For the turbojet engines:
The ITB-engine’s performance is enhanced with higher values of OPR than that of a conventional engine. The improvement in thermal efficiency was, however, lower than the decrease in propulsive efficiency, which resulted in a higher SFC;
The ITB-engine is capable of operating at higher Mach flight numbers with higher specific thrusts, because of the extra fuel burned in the ITB.
An increase in TET benefits both the ITB and conventional engines, with regard to specific thrusts.
Turbine’s power-ratio (TPR) had a large influence in the ITB performance. With low TPR, the performance of the ITB is similar to that of the main burner (MB), so the ITB-engine behaves more like a conventional ITB-engine. At high TPR, the ITB performance is closer to an afterburner, so the ITB-engine’s performance is more similar to that of an engine with afterburner.
The same results were obtained for turbofan engines, and since the ITB allows the LPT to extract more energy, the ITB-turbofan engine has a better performance with higher BR and FPR, compared to the conventional engine. This revealed that the turbofan engine with ITB produced more thrust with a smaller increase in SFC compared to the turbojet engine with ITB. However, the methodology used was simplistic, especially the lack of cooling flow for the HPT, which means the results were probably overstated.
Liu and Sirignano were followed by Liew [8] and Liew et al [9-15], who used a more detailed methodology for their on-design and off-design parametric analysis of a two-spool, separate exhaust turbofan engine. Their results are similar to those published by Liu and Sirignano. Still, in order to avoid the complication of cooling flow bleed, Liew et al suggested that the LPTET should be maintained below 1300 K, the maximum allowable temperature the material could withstand over prolonged periods. This makes the results over-predicted, although the methodology is clearly superior to that of Liu and Sirignano.
Figure 2:The effects of the LPTET (i.e. Tt4.5) on the engine’s specific thrust with respect to the variations in the HPTET and flight Mach number [10].
Some more recent studies were performed by Shwin [16] and Jakubowski et al [17]. Shwin stated that an ITB-turbofan engine can produce more specific thrust with lower SFC, through the use of a lower HPTET and higher BR, when compared to the conventional engine. Its methodology suffers from using constant specific heats and the fact that the extra cooling flow for the ITB and LPT was not stated in the publication (even though its exit temperature is superior to 1300 K). Jakubowski et al considered cooling flow for the HP turbine but maintained the LPTET below 1300 K, so the results are similar to the ones of Liew et al, not providing new conclusions on the topic.
Figure 3: Thrust vs SFC for conventional and ITB turbofan engine with respect to LPTET [16]. Table 1: Comparison of chosen parameters which determine performance of classical and two
combustors turbofan [17].
Soon [1] provided the best study in ITB engines, studying both performance (thrust and SFC) and infrared signatures for a military low-BR TF engine with afterburner. The baseline engine had a performance equivalent to the Pratt & Whitney F100-PW229 engine used to power the F-16 Fighting Falcon (the equivalent engine was named F100-EQ in the study). The results obtained in his study are summarized:
An aircraft equipped with a TCE has a wider flight envelope and rate of turn than the conventional engine, but also a higher SFC (contrasting with the other presented studies);
For a conventional engine with afterburner, the TCE has higher cycle efficiency and lower SFC (with the afterburner on);
In subsonic cruise, the TCE has a higher SFC;
Soon concluded that the TCE does not surpass the conventional engine in all operational aspects, but a better supersonic cruise performance and wider flight envelope may be sufficient reasons for its future use in military fighter aircraft propulsion.
2.3 ITB programs in development
NASA is currently studying an ITB engine for supersonic business jets and UAVs in the Glenn Research Center [18], together with AFL and Williams International. The website states increased power during critical mission periods, reduced peak combustion temperature, reduction in NOx emissions and possible reduction in SFC. So far, the initial ITB flame holder
designs have been completed, CFD analysis showed results, and the design of the ITB test rig has been initiated. According to the website, there are no benefits of incorporating the ITB on a subsonic transport cruise.
The Department of Defense assigned in 2002 an award of $739,839.00 to Cfd Research Corp. for the study and integration of an ITB, in collaboration with Allison Advanced Development Corporation and Williams International [19]. No results have been published yet.
3 Sequential combustion and aero-engines
3.1 Industrial turbines
The first industrial gas turbine that made use of the ITB was created in 1948 by BBC Brown Boveri and was designated the Sequential Combustion Cycle (SCC) [1]. In the 1990’s, ABB Power Generation introduced the GT24/GT26 gas turbines [20-21], featuring an innovator SCC, which consisted in an ITB between the HPT that powers the compressor and the Free Power Turbine (FPT) which is connected to the generator. Dr. Franz Joos et al [20-21] state that the SCC in these gas turbines solves the problem of achieving a high efficiency with a high TET, at the expense of emissions and material and life cycle cost. They also state that this will achieve a higher efficiency in Combined Cycle (gas turbine combined with a steam turbine). According with Boyce [22], for an ITB gas turbine with FPTET equal to HPTET, reheat leads to additional 35% more shaft output power, but with lower cycle efficiency than the simple cycle.
Figure 4: The first gas turbine implemented with an SCC [23].
In the aeronautical industry, inter-turbine reheat is not yet applied, although it has been studied for more than 10 years. Reheat is only present in the form of an afterburner, in low-BR military TF engines used in fighters. The problem of the afterburner is that the air was already expanded in the turbines, which leads to a reduction in its temperature and pressure, and reheating the air in these conditions causes very low cycle efficiencies and leads to major increases in SFC (50% increase in thrust leads to 3x SFC [1]). The ITB concept can reduce this problem [1]. Military engines are not, however, the focus of these study. This study focus on the possible improvements that can arise from the use of ITBs in civilian high-BR TF engines.
3.2 Reheat effect in the Brayton cycle of an aero-engine
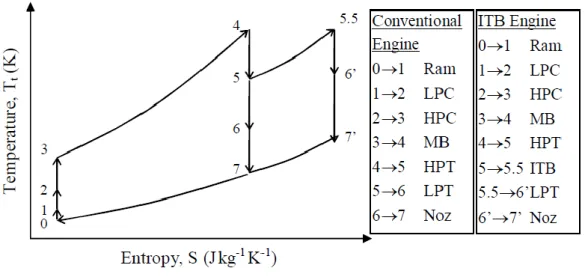
Figure 3 shows the effect of reheat in a regular turbojet aero-engine thermodynamic cycle. In a regular engine, the energy in the combustion chamber’s exit gas is extracted by the turbines and transmitted to the compressors via shafts, while the remaining energy is converted to thrust. In the ITB engine, the temperature of the gas entering the LPT is raised, which increases the entropy of the nozzle’s flow, generating more thrust and shaft power.
Figure 6: Thermodynamic cycles of a turbojet engine (conventional engine) and a turbojet engine with inter-turbine reheat (ITB engine) [1].
3.3 Bypass ratio importance in a civilian turbofan engine
In a basic turbojet engine, the air enters the nozzle, suffers a compression at the compressors, then heated (through the burn of fuel) in the combustion chamber, and then expanded in the turbines which extract the necessary power to the compressors, to finally be expelled in the nozzle. The problem of the turbojet engine is that all the air that enters the engine is heated, and this causes a high thrust, at the cost of a very high SFC. To a military fighter, that is acceptable, because higher speeds tend to be safer. But for a civilian engine,
the main worries are pollution, noise and SFC (reduced SFC improves range). To improve the turbojet performance in subsonic flight, a fan was added, which accelerates the air through an area around the core, the bypass. The higher the BR, the lower the SFC but also at the cost of lower thrust produced [25]. In military engines, the bypass is also utilized, but more with the purpose of creating a thin film of colder air between the combustion gases and the engine’s structure, to increase the engine’s life and reducing infrared emissions.
Civilian TF engines use a single-stage fan to minimize noise with a minimal pressure ratio of 1.5 [25], which represents the majority of the thrust produced. Thermodynamically speaking, a higher propulsive efficiency can be achieved propelling a large mass of air to a very small change in the air flow’s velocity than a small amount of air to a big change in its velocity. In practice, this is not achievable because:
High BR produce less thrust, which would require the use of more engines;
The bigger the BR, the heavier the engine becomes, needing a stronger structure, so the aircraft’s weight increases dramatically;
A higher frontal area also causes more drag;
The engine’s height to the ground is also a constraint;
And finally, the LPT that supplies the fan’s power will require more stages in order to extract the necessary work, leading to more weight.
So, the engine’s designers have to sacrifice efficiency (and consequently, SFC) to meet the demands - that means increasing the FPR for a lower BR (higher thermal efficiency but reduced propulsive efficiency). But, in order to meet the next demands of CO2, NOx and
noise emissions, a higher BR engine must be designed, with a lower FPR [26]. That will include changing the actual engine’s position in an aircraft, as seen in figure 7, to the engine’s position in figure 8:
Figure 8: Future aircraft - engines above the fuselage in tail mounted pods [28].
Figure 8 is a representation of a future aircraft. The tail mounted engines no longer have the limitation of the ground, being only restricted to weight and drag (both heavy constraints, none the least). However, there is a point where the savings in burnt fuel become unbearable because the engine gets bigger and heavier. Dividing the fuel burn in two combustion chambers might be the solution. Currently, the heated air leaves the combustion chamber at temperatures of up to 2000 K, too high for today’s materials resistance, making turbine cooling and coatings necessary. This reduces the cycle efficiency and increases the SFC, because the air is expanded in the first turbine, but it is still necessary to extract work in the others. This expansion causes a big drop in temperature, requiring high TETs in order to extract the necessary work in all turbines. Dividing the fuel burn in two or more combustion chambers, it is possible to reduce the peak combustion temperature in the main combustion chamber, reducing the amount of cooling flow necessary, and allowing for a more efficient cycle.
3.4 Different turbofan engine configurations
The three major civil aero-engine manufacturers are General Electric (GE), Rolls-Royce (RR) and Pratt & Whitney (PW). These companies have their unique designs and a small resume of their preferred engine schematic is made:
GE and PW favor a two-spool boosted TF, with the fan and IPC connected to the LPT and the HPC connected to the HPT via concentric shafts. RR also uses this configuration for low BR, mixed flow engines;
PW is working on a new model of the previous configuration: a two-spool, geared TF, with the fan, gearbox and IPC connected to LPT and the HPC connected to the HPT via concentric shafts. The gearbox is there to ensure that both the fan and the IPC/LPT sets spin with their optimal rpm, and it is represented in figure 9;
RR prefers a three-spool TF, with the fan connected to the LPT, the IPC connected to the IPT and the HPC connected to the HPT, each shaft running concentric to the others, as represented in figure 10. The newest models also feature a gearbox in the HP spool that makes the turbine spinning counterclockwise relative to its compressor.
Both configurations have their advantages and drawbacks, which are now highlighted:
The boosted engine has less shafts, but the diameter of high BR engines tend to reduce the IPC’s diameter, which reduces its tip speed and consequently, effectiveness, requiring more stages both for the compressor and turbine, both spinning at an inferior than optimum rpm because of the fan;
The geared TF solves this problem by reducing the fan rpm relative to the IPC/LPT set, allowing all the components to spin at their optimum rpm. However, the gearbox adds weight, complexity and mechanical losses. Another disadvantage is that the LPT still powers two compressors, imposing more work in the HPC and HPT to obtain high compression ratios;
The three-spool TF has more shafts, adding complexity, and the LPT spins very slowly, requiring several stages to power the fan. On the other hand, the IPC is not as limited as in the boosted TF, so its compression ratio can be higher, allowing for a smaller HPC and HPT. Generally, this configuration is lighter than the boosted engine.
Figure 9: PW1000G 2-spool geared TF [28].
The author’s intention is to study the effects of adding an ITB to the latter engine configuration, and determining the effects on the perspective of Thrust and SFC. Since every compressor is powered by its own turbine, it is easier to verify the results upon the modification of the compressor characteristics than when a turbine powers two compressors. Since the future passes by modifying BR and FPR, the ITB is to be placed between the IPT and the LPT. The objective is to modify the fan and bypass flow.
4 Modelling of RR RB211 Trent 895-17EQ engine
4.1 Baseline engine background
In order to analyze the effects of the ITB in an aero-engine, a baseline engine was evaluated using the GasTurb12 software. The selected engine was the Rolls-Royce Trent895C-17 that powers the Boeing 777-200ER aircraft [30]. Since the modelled engine may not have an entirely accurate performance of the real engine, it will be referred to as Trent 895C-17-EQ or simply baseline engine.
Figure 11: El Al Boeing 777-200ER, with RR Trent 895-17 engines [31].
The Boeing 777 is a family of long range, twin engine jets developed by Boeing Commercial Airplanes [31]. It’s the largest twinjet available in the market, able to carry 301-440 passengers up to distances of 14,305 km. It’s divided in 3 market segments:
A-market: 7800 km (4200 nm);
B-market: 12200 km (6600 nm);
C-market: 14400 km (7800 nm).
The 777-200 was the first model in the A-market, and the -200ER (Extended Range) is a B-market variant, with additional fuel capacity and an increased MTOW [31].
The Trent is a family of high BR, 3-spool turbofan engines developed by Rolls-Royce plc, with Thrust ranges of 240-420 kN, used in Boeing’s B777 and B787 and Airbus’s A330, A340, A380 and A350 families [32].
4.2 Technical specifications of RR RB211 Trent 895-17
The technical specifications for this engine were obtained from references [30-35]:
Bare engine Take-off Thrust (5 minutes): 419.6 kN (94,320 lbf);
Static Airflow: 1208.37 kg/s;
OPR (nominal, Sea-level ISA conditions): 40.7;
Static FPR: 1.81; Static BR: 5.79; Fan stages: 1; IPC stages: 8; HPC stages: 6; HPT stages: 1; IPT stages: 1; LPT stages: 5;
Combustion chamber: 1 annular with 24 fuel injectors;
Fan diameter: 2.79 m (110 in);
Maximum radius: 1.524 m (68 in);
Engine length: 4.568 m (178 in);
Engine weight: 6078 kg (13400 lb).
4.3 GasTurb12 parametric analysis
In order to obtain the most realistic performance simulation of the engine, GasTurb12 was used. This software, developed for academies and industry, allows the user a full analysis of gas turbines, both for thrust and power applications (turbojet/turbofan/ramjet or industrial/turboshaft), since simple classroom thermodynamic cycles and on-design performance to off-design analysis (flight envelopes, for example). The selected engine was a 3-spool, unmixed flow turbofan (no intercooler or recuperator) and the Engine Design – Performance (on-design) analysis was selected. The Basic Thermodynamics – Cycle Design alone does not include overboard and handling bleeds or cooling air, which are present in all of today’s modern TF engines, and the author wishes to be as realistic as possible.
After the selection of the engine and analysis, the author must introduce a series of inputs. The first series of inputs are referred to as Basic Data: it includes component pressure ratios, inter-component pressure losses, BR and burner characteristics, among others. The inlet, ducts and inter-component (compressors, turbines and burner) pressure ratios were obtained from reference [36], as well as the shafts mechanical and burner efficiencies. The BR and OFPR were obtained from [30], and the IFPR was assumed 80% of OFPR, as described
in [36]. The Burner Partload constant, Power Offtake (PO) and Fuel Heating Value (FHV) were assumed as the standard values provided by the software. The first is only important in off-design analysis, so its value to this study is not important; the second is the energy extracted in the HP shaft to power aircraft systems (hydraulics, air conditioning, etc) and the third is the amount of energy that can be obtained by burning a 1 kg of fuel.
Table 2: GasTurb12 Basic Data inputs.
Overboard bleed was ignored in this section, because, in this table, it is selected as kg/s of core flow. Since in reference [34] the overboard bleed for two engine normal operation is established as a percentage of the compressor flow (either HPC or IPC, depending on the thrust produced), its input was introduced in the Secondary Air System table, were we can control the location of extraction and the percentage of air flow bled. A small parametric analysis was conducted in order to obtain the IPC and HPC pressure ratios, using the Optimize tool, thus obtaining the Nominal overall Pressure Ratio at Sea Level ISA Conditions of reference [34], which is 40.7. The Inlet Corrected Flow W2Rstd was slightly increased, having in concern the engine nacelle, which removes some of the intake air, with the objective of acquiring the flow given in [30]. Another parametric analysis was conducted to obtain the Burner Exit Temperature using the Optimize tool, in order to obtain the correct Thrust, and also obtaining the HPT and IPT cooling flows so that the LPT entry Temperature is maintained below 1300 K, avoiding the need for cooling flow, as assumed by Liew et al [8-15].
The second table is the Secondary Air System. It covers handling bleeds, leakages, cooling flows and turbine stages, as well as the extraction locations. In reference [34], a table states that overboard bleed for normal engine operation in take-off thrust is 2.2% of IPC entry flow. In other thrusts, it is either removed after the HPC or a mix from both valves, in different percentages. The location of the valve is dictated by the Relative Enthalpy value (between 0 and 1, inclusive). The cooling flows were obtained as explained before. The cooling pump diameter was assumed as 0, the value issued by the program.
Table 3: GasTurb12 Secondary Air System.
The Relative Enthalpy works with values between 0 and 1, as such:
0 indicates the flow is extracted before the specified compressor;
Between 0 and 1, it is extracted in an intermediate stage. For example, if the flow is extracted from the 3rd stage of a 5 stage compressor, then the relative enthalpy is
3/5 = 0.6;
1 indicates the flow is extracted after the specified compressor.
The overboard bleed in take-off condition is extracted after the IPC [34], so its relative enthalpy value is 0 (the program does not allow the overboard bleed to be extracted immediately after the IPC, so the author extracted it before the HPC, with a minimal pressure loss – the IPC entry flow is equal to HPT entry flow). The IPT cooling flow was assumed to be
extracted before the HPC, so its relative enthalpy value is 0. It was also assumed that the cooling flows do not lose heat to bypass or other flows and equipment, so when the hot and cold flows are rejoined in the turbines, the cooling flow has the same temperature of when it was extracted, although it loses the pressure difference between its removal in the compressors and rejoining in the turbines. Leakages, recirculation and other handling bleeds were neglected. ISA conditions (0% relative humidity) were considered, as well as constant polytropic compressor and turbine efficiencies, stated in table 3. The nominal shaft rpm were taken from reference [34].
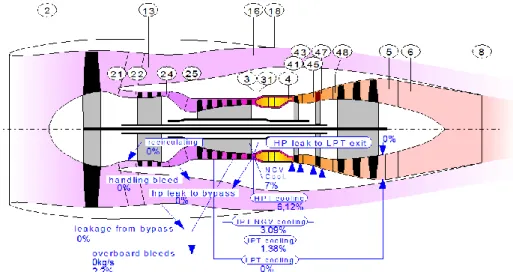
Figure 12: Engine nomenclature, stations and secondary air flows provided by GasTurb12. Table 4: Design Point of Trent 895C-17-EQ engine, obtained by GasTurb12.
5 TCE thermodynamic cycle
Since GasTurb12 does not have the option to analyze the TCE, a Matlab script was written based on the process described by Walsh and Peter [36]. First the script was modelled to obtain the results given by GasTurb12 with the purpose of achieving the best accuracy of leading performance parameters (Thrust and SFC). After the results obtained were considered satisfactory, the script was extended to house a secondary combustion chamber. The objective was to obtain results with similar accuracy if GasTurb12 could perform this kind of analysis in turbofan engines.
5.1 Air flow thermodynamic properties
The relevant thermodynamic properties for gas turbine analysis are the Specific Heat at Constant Pressure or Volume, CP and CV, respectively; the Gas Constant R and the Ratio of
Specific Heats γ (gamma). The first one is the amount of energy required to increase the gas temperature in 1º C at constant pressure or volume; the second relates pressure and temperature changes and is numerically equal to the difference between CP and CV; and the
third is the ratio of the specific heat at constant pressure over the specific heat at constant volume. The gas constant for kerosene doesn’t vary much up to fuel-to-air ratio stoichiometric value, but CP and γ do. These two properties are used in 3 ways to gas turbine
performance prediction:
Constant, standard values for CP and γ: this is used for classroom uses and crude estimates of component performance. It possesses an error of up to 5% [36]:
o
Cold end gas properties: CP = 1004.7 J/kg K, γ = 1.4;o Hot end gas properties: CP = 1156.9 J/kg K, γ = 1.33.
Values based on mean temperatures: this iterative method is more accurate, and can be used both for dry air and combustion products of kerosene with an accuracy of 1.5% [36]. The mean temperature throughout the component is evaluated and CP and
γ are obtained from that value.
Specific enthalpy and entropy: this method evaluates the enthalpy and entropy in the components, through polynomials of specific enthalpy and entropy obtained from the standard polynomials for specific heat. It is the most accurate, with 0.25% accuracy to all pressure ratios [36].
Table 5: Polynomial constants for calculation of CP for a given static temperature TS [36] – cold end
gases (pre combustion).
Table 6: Polynomial constants for calculation of CP for a given static temperature TS [36] – hot end gases
(post combustion), FAR being the fuel-to-air ratio.
5.2 Fuel-to-air ratio calculation
Fuel-to-air ratio calculation is also based on an empirical formula stated in [36]. It is dependent on combustion chamber inlet and exit temperatures and the efficiency of the combustion:
Table 8: FAR calculation [36] – T3 being the HPC exit temperature, T4 being the burner exit temperature and ETA34 being the combustor efficiency.
5.3 Compressor and turbine isentropic efficiency
Isentropic efficiency is the ideal specific work input, or total temperature rise, divided by the actual for a given pressure ratio and it is sometimes wrongly referred as adiabatic efficiency. Isentropic means both adiabatic and reversible, which means it is the efficiency of the process without heat transfer and friction [36].
Polytropic efficiency is defined as the as the isentropic efficiency of an infinitesimally small step in the compression process, such that its magnitude would be constant throughout. It accounts for the fact that the inlet temperature of the stages of a compressor or turbine is not constant throughout the process of compression or expansion [36].
For this reason, polytropic efficiency was used, although for design point calculations, isentropic efficiencies for both compressor and turbines have to be calculated according to the next formulas:
1 1 *
1
1
polytropic isentropicPR
PR
(1)Compressor isentropic efficiency calculation.
1 * 1
1
1
polytropic isentropicER
ER
(2)5.4 Baseline engine design point script
Since the conditions are for ambient take-off at ISA conditions and Mach = 0, then the ambient static temperature and pressure are equal to the total temperature and pressure. In the intake, there is no change in temperature but a slight pressure drop:
2 2
*
amb ambT
T
P
P
IntakePR
(3)After the intake, there is the first stage of compression at the fan. First, the core and bypass flows (W21 and W13, respectively) are calculated:
2 21 13 2 21
1
W
W
BR
W
W
W
(4)
Then, we proceed to the first stage of compression at the fan. Here, we have the OFPR that is applied to the bypass flow and the IFPR applied to the core flow, which is assumed as 80% of OFPR as suggested by Walsh and Peter [36]. The procedure below is the standard for all compressors, highlighted for the outer fan. Any differences in the procedure (because of cooling flow or customer bleed extraction, for example) will be shown. The first step is to calculate the outer fan exit pressure:
13 2
*
P
P OFPR
(5)
Then, the isentropic efficiency of the component is obtained for inlet γ,
1 1 *
1
1
polytropic isentropicOFPR
OFPR
(6)Which is used to obtain the outer fan exit temperature with inlet γ.
1 13 2 2
1
*
isentropicOFPR
T
T
T
(7)Based in inlet and exit temperatures, the mean temperature throughout the outer fan is obtained:
13 2
2
mean
T
T
T
(8)CP and γ for this Tmean are obtained as shown before. These properties are then used
to calculate the new isentropic efficiency and exit temperature, to obtain a new Tmean. This
iterative method stops when the difference between the previously calculated Tmean and the
current Tmean is minimal:
0.00005
mean meanprevious
T
T
(9)13
2*
mean 2T
T
T
(10)When this objective is achieved, CP, γ, isentropic efficiency and exit temperature for
the outer fan are obtained. This procedure was repeated for the inner fan.
We can then calculate the necessary power to compress the air at the fan, which is the power that the LPT must extract:
13
*
*(T
13 2)
21*
*(T
21 2)
fan P OFmeanT P IFmeanT
W
W
C
T
W
C
T
(11)After the fan, there are the bypass duct and core inlet. Like in the intake, there are no temperature drops, only slight pressure drops. Then the procedures above are repeated for the IPC and HPC. The difference is the IPT cooling flow and customer bleed extraction in the HPC inlet and the HPT cooling flow extraction in the HPC exit (pre combustion chamber):
25 25 25 3 25
*
*
* W
W
IPT NGV NGV CFpercentageIPT Rotor Rotor CFpercentage
bleed percentage
bleed IPT Rotor IPT NGV
W
IPT
W
W
IPT
W
W
CustomerBleed
W
W
W
W
(12) 25 25 31 3*
*
W
HPT NGV NGV CFpercentageHPT Rotor Rotor CFpercentage
HPT Rotor HPT NGV
W
HPT
W
W
HPT
W
W
W
W
(13)W3 and W31 being the air flow in the HPC exit and combustion chamber entry,
based on their temperature. The schematic for cooling flow of a single stage turbine is explained in Annex A.
With the burner exit temperature obtained from the software, we can calculate the fuel-to-air ratio (FAR) and the fuel flow. The pressure at the combustor’s exit is obtained as in the ducts and FAR is obtained as in section 5.2, from which we obtain the fuel flow:
31
*
fuelW
FAR W
(14) 4 31 fuel
W
W
W
(15)
After this point, the thermodynamic properties have to be calculated based on combustion products of kerosene presented before in 5.1. Before the HPT, we have the first cooling flow addiction. The first step is to obtain an average CP based in the cooling flow and
burner exit flow W4:
41 4 3 4 4 41 41
*
*
HPT NGV HPT NGV P P P estimativeW
W
W
W
C
W
C
C
W
(16)Then, this CP is used to equalize the sum of cooling flow and burner exit flow to the
mixed flow. This gives an estimated temperature:
41
*
P41 estimative*
41 HPT NGV*
P 3*
3 4*
P 4*
4W
C
T
W
C
T
W
C
T
(17)Again, CP is calculated for this temperature, and used in the same equation to obtain the correct temperature. The iterative process ends when the same accuracy target for the compressors is obtained.
Now, the turbines. The first step is to obtain the necessary power extraction based in compressor required power, shaft mechanical efficiency and, for the HPT, the power offtake (PO): HPC HPT HP spool
W
PO
W
(
18)41
*
41*(T
41 42)
HPT P
W
W
C
T
(19)
We again calculate thermodynamic properties and proceed to obtain the turbine isentropic efficiency. Since the expansion ratio is not known, we assume an initial value of 4, which according to GasTurb12, is an acceptable value for a single-stage turbine:
1 * 1
1
1
HPTpolytropic HPTisentropicHPTER
HPTER
(20)This efficiency is used to obtain the actual expansion ratio:
41 42 41 1
1
*
* 1
HPTisentropicT
T
T
HPTER
(21)
This generates another iterative process with the same target accuracy as before. Finally, the pressure in the turbine exit can be obtained:
41 42
P
P
HPTER
(22)
This procedure is repeated for the HPT rotor cooling flow, IPT NGV and rotor cooling flows and IPT and LPT, having in account the pressure drops in the ducts. For the nozzles, we begin by calculating the ratio of nozzle pressure over ambient and obtaining the exit Mach number.
If the value of P/PS results in a Mach number superior to 1, then the nozzle is choked and the jet speed is equal to Mach 1; if not, the nozzle is not choked, and there are no chock waves in the nozzle, so the jet speed is the Mach value times the speed of sound for the nozzle static temperature. For brevity, only the cold nozzle is demonstrated here:
1 16 18 2 16 18 18
2
*
1
1
1
1
* M
2
cold cold cold amb cold staticP
M
P
T
T
(23)
In order to obtain the nozzle area, the choking value Q must be obtained: 1 2 16 16
2*
1000*
*
* 1
(
1) *
cold cold cold coldcold amb amb
P
P
Q
R
P
P
(24)Then, the choking value Q is used to obtain the nozzle area and the nozzle thrust coefficient (TC) to obtain the effective area:
16 16 16 .
*
*
cold cold cold eff coldT
Q
W
A
P
A
A
TC
(25)
With the thermodynamic properties of static temperature at the nozzle, the speed of sound is obtained, which will allow to obtain the jet velocity:
18
* *
Cold cold static
a
R T
(26)
*
cold cold cold
V
M
a
(27)
Then, the nozzle thrust can be obtained:
16
*
.*(
18)
cold cold eff cold static amb
T
W
V
A
P
P
(28)
After both the hot and cold thrusts are obtained, the net thrust and SFC can be calculated:
net cold hot
fuel net
T
T
T
W
TSFC
T
(29)Table 9: Baseline engine performance (obtained by the Matlab script).
Baseline Engine
TET = 1855,12 K T [kN] 419.4654 TSFC [g/kN.s] 10.1708
This script has an accuracy of 2.2% for the SFC and 0.03% for the Thrust. It produces less thrust with more fuel, but these are the values with which the ITB engine will be compared to. The next table shows the flow, temperature and pressure for the same stations of table 4 in order to compare the results:
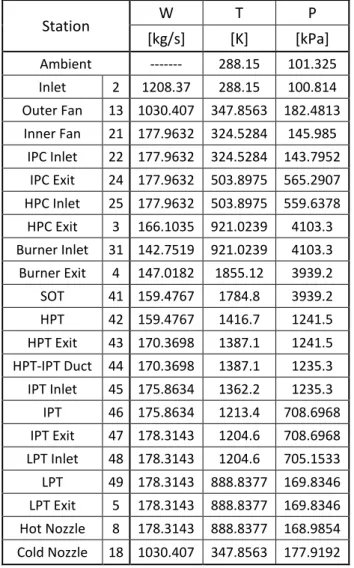
Table 10: Station flow, temperature and pressure obtained in the Matlab script.
Station
W
T
P
[kg/s]
[K]
[kPa]
Ambient --- 288.15 101.325 Inlet 2 1208.37 288.15 100.814 Outer Fan 13 1030.407 347.8563 182.4813 Inner Fan 21 177.9632 324.5284 145.985 IPC Inlet 22 177.9632 324.5284 143.7952 IPC Exit 24 177.9632 503.8975 565.2907 HPC Inlet 25 177.9632 503.8975 559.6378 HPC Exit 3 166.1035 921.0239 4103.3 Burner Inlet 31 142.7519 921.0239 4103.3 Burner Exit 4 147.0182 1855.12 3939.2 SOT 41 159.4767 1784.8 3939.2 HPT 42 159.4767 1416.7 1241.5 HPT Exit 43 170.3698 1387.1 1241.5 HPT-IPT Duct 44 170.3698 1387.1 1235.3 IPT Inlet 45 175.8634 1362.2 1235.3 IPT 46 175.8634 1213.4 708.6968 IPT Exit 47 178.3143 1204.6 708.6968 LPT Inlet 48 178.3143 1204.6 705.1533 LPT 49 178.3143 888.8377 169.8346 LPT Exit 5 178.3143 888.8377 169.8346 Hot Nozzle 8 178.3143 888.8377 168.9854 Cold Nozzle 18 1030.407 347.8563 177.9192This script has a very high accuracy until the HPC’s exit: the difference between the GasTurb12 and the script is inferior to 2 degrees. However, in the turbines the script loses
accuracy, to the point in which the LPT temperature is around 14 degrees superior in the script results. For the pressure and the flow, the script does provide a high accuracy. This loss in temperature accuracy is because of the mean temperature method used in the script, while GasTurb12 uses enthalpy and entropy polynomials.
5.5 Two-combustor engine
The methodology applied to the baseline engine was repeated to the two combustor engine. The ITB was assumed as a normal combustor, and the cooling flow methodology was adapted from Walsh and Fletcher [44]:
0.0167
19.97[%]
0.0343
43.362[%]
cfrequired cfrequiredNGV
SOT
Rotor
SOT
(30)Figure 13: Turbine NGV and blade (rotor) cooling flow requirements vs SOT [36] and equations for high-tech NGV and rotor cooling flow requirements [8].
The ITB was taken as a normal combustor with a pressure drop of 4% and exit temperature equal to that of the main burner. The analysis was conducted with burner exit temperature (or SOT) of 1250 to 1500 K (with an interval of 25 K), and for all these temperatures, no cooling flow for the IPT was necessary because its temperatures were always below 1100 K.
Despite the reduced cooling requirements expected, the engine does have three disadvantages: the first one being a bigger pressure drop in the ITB compared to the baseline
engine; the low temperature after the IPT expansion; and the cooling flow requirement for the LPT. Based in these preliminary results and gas turbine theory, the author expects a less efficient cycle (meaning a higher SFC) but with similar levels of thrust at much lower TET’s.
Table 11: Thrust and SFC for the ITB engine (HPTET = LPTET) compared to the baseline engine.
Baseline Engine
TET = 1855,12 K T [kN] 419,4654 TSFC [g/kN.s] 10,1708ITB engine
TET = 1250 K T [kN] 418,5946 TSFC [g/kN.s] 10,1412 TET = 1275 K T [kN] 419,6811 TSFC [g/kN.s] 10,3627 TET = 1300 K T [kN] 420,5723 TSFC [g/kN.s] 10,5417 TET = 1325 K T [kN] 421,4354 TSFC [g/kN.s] 10,7157 TET = 1350 K T [kN] 422,2712 TSFC [g/kN.s] 10,8846 TET = 1375 K T [kN] 423,0803 TSFC [g/kN.s] 11,0485 TET = 1400 K T [kN] 423,8632 TSFC [g/kN.s] 11,2072 TET = 1425 K T [kN] 424,6205 TSFC [g/kN.s] 11,3608 TET = 1450 K T [kN] 425,3528 TSFC [g/kN.s] 11,5093 TET = 1475 K T [kN] 426,0603 TSFC [g/kN.s] 11,6526 TET = 1500 K T [kN] 426,7435 TSFC [g/kN.s] 11,7907The results confirm the author’s predicted conclusions: the ITB engine does offer similar levels of Thrust at lower TET’s (580,12 K lower) but at the expense of a higher SFC. This higher SFC can make this concept’s use for civilian applications complicated, because SFC is proportional to range. But the very low TET’s can indeed be compensating: lower maintenance and part’s removals and substitution might be an attractive for airlines who not wish to extend their flight to the maximum range of aircraft. Plus, the mechanical design and reduced cooling flow and turbine coating requirements can reduce costs for the manufacturer, both for project and manufacturing.
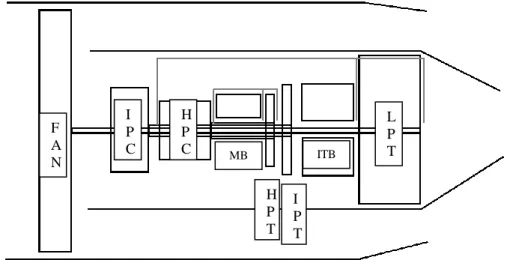
Figure 14: TCE engine schematic.
A second simulation was performed, this time using different TET’s: the flow in the main burner is heated at higher temperatures than in the ITB, except in the first run, when the LPTET hits its maximum and HPTET its minimum (1300 K). The objective was to reduce the fuel burn in the ITB. This simulation did not improve the results, giving only slight increases in Thrust and TSFC (bigger for the latter). For this fact, it was no longer considered in this study.
A third simulation was performed with a CTT engine, composed of a baseline engine with 2 ITBs: one between the HPT and IPT and the other between the IPT and LPT (all the TET’s had the same value). It was carried out in order to see if the CTT engine could improve the results of the TCE. It did not. In order to achieve the same Thrust of the TCE engine, the CTT requires a TET 100 K superior (1375 K). As the second simulation, this one was also ignored. The first simulation was the only one worth improving.
So, in order to fully verify if the concept is (or not) viable for civilian use, a parametric analysis to the FPR and BR of the ITB engine with equal burner exit temperatures was performed based in its TET’s. The results are shown in the next chapter.
F A N I P C H P C MB H P T I P T ITB L P T
6 ITB engine parametric analysis
Three analysis were made to the ITB engine. First, FPR was analyzed vs TET, keeping the other engine component properties constant. This resulted in a variable OPR. Second, the FPR and BR were analyzed vs TET, keeping a constant OPR of 40.7. In order to maintain this value constant, the IPC pressure ratio was changed according to the values of FPR. It was decided that the extra work necessary would be carried out by the IPC because the HPC already powers auxiliary systems (Power Offtake). The third and last simulation was to analyze, for constant TET, different FPR and BR values. The objective is to obtain a design point which produces equal or superior thrust with inferior fuel consumption, with the directives of Hughes – reducing the FPR value and increasing the BR.
6.1 Variable OPR – FPR vs TET
The OFPR was analyzed from 1.3 to 1.9, with the IFPR values equal to 80% of that value. The change in FPR leads directly to a change in OPR:
(b)
(c)
Figure 15: Performance of the ITB engine vs OPR – variable FPR, all other engine parameters equal to the baseline engine.
Increasing FPR leads to a better thermal efficiency, which reduces the fuel consumption and increases the thrust produced. However, the objective is to reduce FPR, and even at the lowest TET, we have lower thrust and higher TSFC. Consequently, the first simulation is unsuccessful.
6.2 Constant OPR – FPR vs TET and BR vs TET
In this simulation, the IPC pressure ratio varies with OFPR for the first graphs, in order to keep a constant OPR of 40.7. Then, the BR is varied for an OFPR of 1.81, such as in the baseline engine. All other parameters are equal to the baseline engine:
(b)
(c)
Figure 16: Performance of the ITB engine with constant OPR vs FPR - variable IPC PR, all other parameters equal to the baseline engine.
As in the first simulation, thrust increases and TSFC diminishes, although keeping the OPR constant does diminish the interval in which the results are contained. Still, the same
conclusion from the previous parametric analysis is maintained. The TCE does not surpass the baseline engine just by modifying the FPR.
(a)
(b)
![Figure 3: Thrust vs SFC for conventional and ITB turbofan engine with respect to LPTET [16]](https://thumb-eu.123doks.com/thumbv2/123dok_br/18942165.939714/26.892.219.640.111.445/figure-thrust-sfc-conventional-turbofan-engine-respect-lptet.webp)
![Figure 7: Airbus A350 - engines in wing mounted pods [27].](https://thumb-eu.123doks.com/thumbv2/123dok_br/18942165.939714/31.892.299.690.788.1064/figure-airbus-a-engines-wing-mounted-pods.webp)
![Figure 8: Future aircraft - engines above the fuselage in tail mounted pods [28].](https://thumb-eu.123doks.com/thumbv2/123dok_br/18942165.939714/32.892.174.731.107.245/figure-future-aircraft-engines-fuselage-tail-mounted-pods.webp)
![Figure 11: El Al Boeing 777-200ER, with RR Trent 895-17 engines [31].](https://thumb-eu.123doks.com/thumbv2/123dok_br/18942165.939714/35.892.207.796.390.590/figure-el-al-boeing-er-with-trent-engines.webp)
![Table 5: Polynomial constants for calculation of C P for a given static temperature TS [36] – cold end gases (pre combustion)](https://thumb-eu.123doks.com/thumbv2/123dok_br/18942165.939714/42.892.190.686.243.483/table-polynomial-constants-calculation-given-static-temperature-combustion.webp)
![Figure 13: Turbine NGV and blade (rotor) cooling flow requirements vs SOT [36] and equations for high-tech NGV and rotor cooling flow requirements [8]](https://thumb-eu.123doks.com/thumbv2/123dok_br/18942165.939714/50.892.156.586.420.830/figure-turbine-blade-cooling-requirements-equations-cooling-requirements.webp)