UNIVERSIDADE DE LISBOA
Faculdade de Medicina Veterinária
BURDEN OF DISEASE OF FOUR FOODBORNE PATHOGENS: A HARMONIZED APPROACH IN DENMARK
JOANA CATARINA CARDOSO PESSOA
CONSTITUIÇÃO DO JÚRI ORIENTADORA
Doutora Maria Gabriela Lopes Veloso Doutora Sara Neves da Costa Monteiro Pires Doutora Maria João dos Ramos Fraqueza CO-ORIENTADOR Mestre Telmo Renato Landeiro
Raposo Pina Nunes
Mestre Telmo Renato
Landeiro Raposo Pina Nunes
2018 LISBOA
UNIVERSIDADE DE LISBOA
Faculdade de Medicina Veterinária
BURDEN OF DISEASE OF FOUR FOODBORNE PATHOGENS: A HARMONIZED APPROACH IN DENMARK
JOANA CATARINA CARDOSO PESSOA
DISSERTAÇÃO DE MESTRADO INTEGRADO EM MEDICINA VETERINÁRIA
2018 LISBOA
CONSTITUIÇÃO DO JÚRI ORIENTADORA
Doutora Maria Gabriela Lopes Veloso Doutora Sara Neves da Costa Monteiro Pires Doutora Maria João dos Ramos Fraqueza CO-ORIENTADOR Mestre Telmo Renato Landeiro
Raposo Pina Nunes
Mestre Telmo Renato
i
DECLARAÇÃO
Nome ____________________________________________________________________________
Endereço eletrónico ____________________________________Telefone __________/__________
Número do Bilhete de Identidade__________________________
Título: Dissertação Tese
_________________________________________________________________________________
_________________________________________________________________________________
Orientador(es)
_________________________________________________________________________________
_______________________________________________________Ano de conclusão____________
Designação do Mestrado
_________________________________________________________________________________
Nos exemplares das teses de doutoramento ou dissertações de mestrado entregues para a prestação
de provas na Universidade e dos quais é obrigatoriamente enviado um exemplar para depósito legal na
Biblioteca Nacional e pelo menos outro para a Biblioteca da FMV-ULISBOA deve constar uma das
seguintes declarações:
1. É AUTORIZADA A REPRODUÇÃO INTEGRAL DESTA TESE/TRABALHO APENAS PARA
EFEITOS DE INVESTIGAÇÃO, MEDIANTE DECLARAÇÃO ESCRITA DO INTERESSADO,
QUE A TAL SE COMPROMETE.
Faculdade de Medicina Veterinária da ULisboa, _____ de _____________________ de 20__
(indicar a data da realização das provas públicas)ii Acknowledgements
I would like to thank, firstly, to Professor Telmo for introducing me to Epidemiology, risk analysis, R and, finally, to Sara. For making it possible for me to undertake an interns
To Sara for being the best supervisor one could wish for. For receiving me in Copenhagen with friendship, making it feel like home. And for being such an inspiration as a researcher. Thank you for all the knowledge and all the time you spent making me a more enlightened person.
To all the Risk Benefit Group at DTU for a warm welcome and for the sharing of knowledge. A special thank you to Maarten for accepting me in his risk assessment course and for being such a great teacher.
To Steen Ethelberg at SSI for helping me gather sound information to develop this study. To Letícia for all the good times spent throughout Copenhagen. For sharing our Portuguese/Brazilian office. I, Sara and Letícia made Portuguese the most spoken language at DTU! Essentially, for making Copenhagen such a warm place with her Brazilian ways. Thank you also to Michael, Jan, Miguel and João for the fun times.
I will always be thankful for all the friendships college brought me. To Fábio for being there in the best and worst of times. For all the time spent roaming through college and through Lisbon, the best adventures ever. To Ingrid for teaching me the word “proactivity” and for being such a great example of it. To Lara, Chambel, Adriana, Bia, Neves and Patrícia for making college worthwhile.
To my Podin friend, Joana, for being the amazing person she is. For the shared love of Ireland, Star Wars, travelling, “things that are so bad it kind of make them good” and our annual little visits to each other. Thank you for all the fun, mostly fun, we had in the last… Let’s say couple of years so we do not sound old.
To Rosário for being my friend since middle school, for the shared love of books, all the great times and also for always making me see reason.
To my childhood friends: Marina, Ana, Salomé, Joana, Inês, Daniela e Patrícia. If you are still here, I must have been doing something right!
Now, for the most important people in my life, my family, I am afraid I am not a good enough writer to give thanks, but I will try.
To my amazing parents for being the most incredible human beings, for supporting me, always, and for giving me everything I needed (even if I thought I did not). The biggest thank you the world has ever seen.
To my sister, Teresa, for being like a second mom, I know I am a high maintenance baby! To my brother, Afonso, for teaching me the meaning of patience (he will love this one) and being a more or less bearable big brother. To Filipa, the new addition to the family, my sister in law. Thank you for all the support and for being a true sister (also, for putting up with my brother!). To my grandmother, Maria, for being the best example of a woman I could possibly have had. To all my other grandparents, I had an amazing childhood and I miss you all. To my aunt for always being there.
And finally, to my four-legged family: Pastor, Larbos and Fusca. Love is not even enough to describe it.
iii Abstract
Burden of disease of four foodborne pathogens: a harmonized approach in Denmark
Consumption of contaminated food products and exposure to a variety of health hazards can lead to a wide spectrum of foodborne diseases (FBD). The true impact of these diseases is still unknown worldwide. Burden of illness (BoI) and burden of disease (BoD) studies can be developed in order to help decision makers implement intervention and control measures to improve food safety systems.
This thesis describes an integrated model to estimate the public health impact of four zoonotic foodborne pathogens in Denmark in 2016 – Campylobacter spp., Salmonella spp.,
Yersinia enterocolitica and verocytotoxin-producing Escherichia coli (VTEC).
The applied model consisted of two general components: a BoI study, which was applied to estimate total incidence of these pathogens in the Danish population, accounting for underdiagnosis and under-reporting; and a BoD study, which built on the first and estimated disease burden in terms of the disability adjusted life year metric (DALYs). It also describes the model developed to estimate the BoD of yersiniosis – the first developed in Denmark and in Europe.
Total incidence estimates point to 66,202 cases of illness, with Campylobacter contributing the most (51,225 cases), and Yersinia the least (1,860 cases). The total BoD is 2,290 DALYs. Ranking in first place with the highest burden is campylobacteriosis, followed by salmonellosis, yersiniosis and VTEC infections, with 30, 8, 1 and 0.8 DALYs per 100,000 inhabitants, respectively. Gastroenteritis was the sequela which born the highest burden, when compared to long-term sequelea.
Total incidence estimates for all four pathogens show that children under five years old have the highest incidence when compared to other age groups, while BoD estimates regarding
Campylobacter and Salmonella show the highest burden on elderly people, which can be
explained by the high number of fatal cases estimated for that age group. Still, those two diseases have a considerable high burden on young children, as does yersiniosis and VTEC infections.
Differences in methodological approach used to estimate total incidence and the BoD makes comparison among countries difficult. The burden of these preventable diseases is still considerable, even in developed countries like Denmark. Understanding the contribution of each cause to the burden of FBD and incorporating estimates into policy development worldwide will enable efficient and effective interventions and improvements throughout all the food chain.
Keywords: Burden of Illness, Burden of Disease, DALYs, Y. enterocolitica, Campylobacter, Salmonella, VTEC.
iv Resumo
Impacto na saúde pública de quatro agentes patogénicos de origem alimentar: uma abordagem harmonizada na Dinamarca
O consumo de alimentos contaminados e a exposição a fatores de risco pode causar um alargado espectro de doenças de origem alimentar. O verdadeiro impacto destas doenças é ainda desconhecido. Estudos de burden of illness (BoI) e burden of disease (BoD) podem ser desenvolvidos, facilitando a implementação de medidas de intervenção e controlo por parte das autoridades, com o intuito de melhorar os sistemas de segurança dos alimentos. Esta tese descreve um modelo integrado para estimar o impacto na saúde pública de quatro agentes zoonóticos transmitidos por alimentos – Campylobacter spp., Salmonella spp.,
Yersinia enterocolitica e Escherichia coli verocitotoxinogénica (VTEC).
O modelo aplicado é composto por duas componentes: um estudo de BoI para estimar a incidência total destes agentes patogénicos na população dinamarquesa, tendo em conta o grau de sub-diagnóstico e sub-notificação; e um estudo de BoD que contabiliza o impacto destas doenças utilizando uma medida universal designada: disability adjusted life year (DALYs). Também está descrito o modelo concebido para estimar o impacto da yersiniose – o primeiro a ser desenvolvido quer na Dinamarca, quer na Europa.
A incidência total estimada aponta para 66,202 casos de doença; com Campylobacter dando um maior contributo (51,225 casos) e Yersinia o menor (1,860 casos). A totalidade do impacto destas quatro doenças foi de 2,290 DALYs. O maior impacto na saúde pública é causado por campilobacteriose, seguida de salmonelose, yersiniose e infeções por VTEC, com 30, 8, 1 e 0.8 DALYs por 100,000 habitantes, respetivamente. A gastroenterite foi a sequela com maior impacto, quando comparada com sequelas de longa duração.
As estimativas de incidência total para os quatro agentes patogénicos mostram que crianças com menos de cinco anos têm uma maior incidência, comparando com outras faixas etárias, enquanto as estimativas de BoD para Campylobacter e Salmonella mostram um maior impacto em idosos. Ainda assim, essas duas doenças têm um considerável impacto em crianças, como o têm a yersiniose e as infeções VTEC.
As diferenças na abordagem metodológica utilizada para estimar a incidência total e o BoD dificultam a comparação entre países. O impacto dessas doenças evitáveis é ainda considerável, mesmo em países desenvolvidos como a Dinamarca. Compreender a contribuição de cada causa para o peso das doenças transmitidas por alimentos e incorporar estimativas no desenvolvimento de políticas em todo o mundo permitirá intervenções e melhorias eficientes e efetivas em toda a cadeia alimentar.
Palavras-chave: Peso de Doença, Peso Global de Doença, DALYs, Y. enterocolitica, Campylobacter, Salmonella, VTEC
v Table of contents
Internship Report ... 1
I. Literature review ... 2
1. Introduction ... 2
2. Estimating total incidence of foodborne pathogens ... 3
2.1. Surveillance of human disease in Denmark ... 4
2.2. Population, Physician and Laboratory surveys ... 6
2.3. Burden of foodborne illness studies ... 7
3. Burden of Disease studies ... 9
3.1. Foodborne disease model ... 10
3.2 Disability weights ... 11
3.3 Social weighting ... 12
4. Yersiniosis ... 13
4.1. Yersinia spp. ... 13
4.2. Yersinia enterocolitica ... 13
4.2.1. Epidemiology of Yersinia enterocolitica ... 14
4.2.2. Control of Y. enterocolitica in the food chain ... 15
4.3. Clinical manifestations of yersiniosis ... 17
4.4. Yersiniosis in the European Union and Denmark ... 18
II. Objectives ... 21
III. Material and methods ... 22
1. Estimating the incidence of four foodborne pathogens ... 22
1.1 Public health surveillance data ... 22
1.2. Modelling approach ... 22
1.1.1. Non-pathogen specific parameters ... 23
1.1.2. Pathogen-specific parameters ... 25
1.1.3. Model for re-constructing the surveillance pyramid ... 28
1.3. Sensitivity analysis ... 29
1.4. Scenario Analysis ... 30
2. Estimating the burden of disease of four foodborne pathogens ... 32
2.1. Health-outcomes of four foodborne pathogens ... 33
2.2. Disability weights and duration of health-outcomes ... 40
2.3. Life expectancy ... 42
2.4. The Disability Adjusted Life Year model ... 43
IV. Results ... 44
1. Burden of disease of four foodborne pathogens ... 44
1.1. Total incidence of disease by four foodborne pathogens... 44
1.1.2. Sensitivity analysis ... 49
1.1.3. Scenario Analysis ... 52
1.2. Disability Adjusted Life Years for four foodborne pathogens ... 55
V. Discussion ... 62
1. Burden of Illness of four foodborne pathogens ... 62
1.1. Limitations of the modelling approach ... 62
1.1.1. Surveillance system... 62
1.1.2. Non-pathogen and pathogen specific parameters ... 63
1.2. Scenario analysis ... 64
1.3. Comparability with other studies ... 64
2. Burden of disease of four foodborne pathogens ... 66
2.1. Health-outcome trees ... 67
2.2. Disability weights ... 67
2.3. Comparability with other studies ... 67
3. Age and gender distribution of the burden of foodborne illness and disease ... 69
VI. Conclusion... 71
vi
VIII. Annexes ... 82 Annex I ... 82 Annex II ... 83
vii List of figures
Figure 1- The foodborne diseases’ surveillance pyramid. The tip of the pyramid represents pathogen-specific cases reported to public health surveillance, whereas the base represents all cases caused by that pathogen occurring in the country in a
given year………. 3
Figure 2 - Overview of the monitoring and outbreak investigation network for reporting infectious pathogens in humans, animals, foodstuffs and feed-stuffs in Denmark,
2016……… 5
Figure 3 - Foodborne disease model depicting the three possible approaches: Risk factor-based, Hazard-based and Outcome-based………. 10 Figure 4 - Reported numbers of confirmed human zoonoses cases in the EU, 2015….. 17 Figure 5 - Age-specific cases of yersiniosis per 100,000 population in Denmark, 2010 - 2017. Cases from 2017 are from January to August……….. 19 Figure 6 - Schematic of the modelling approach to estimate the total incidence of
foodborne pathogens in Denmark………. 22
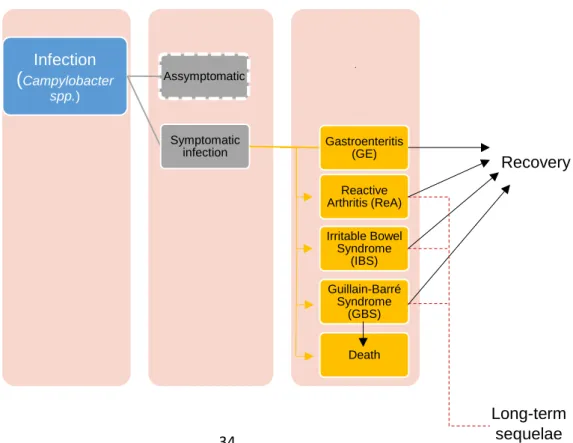
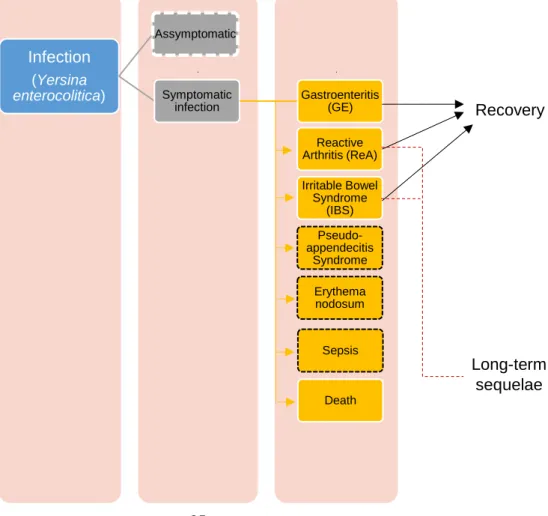
Figure 7 - Theoretical example of disability adjusted life years (DALYs)……… 32 Figure 8 - Outcome tree for Campylobacter spp. Outcomes with dashed white lines are currently not considered in the model……… 33 Figure 9 - Outcome tree for non-typhoidal Salmonella spp. Outcomes with dashed white and black lines are currently not considered in the model……….. 34 Figure 10 - Outcome tree for Y. enterocolitica. Outcomes with dashed white and black lines are currently not considered in the model……….. 34 Figure 11 - Outcome tree for VTEC. Outcomes with dashed white and black lines are currently not considered in the model……….. 35 Figure 12 - Estimated incidence of campylobacteriosis per 100,000 population aggregated by gender and age group, Denmark, 2016………. 45 Figure 13 - Estimated incidence of salmonellosis per 100,000 population aggregated by gender and age group, Denmark, 2016……….. 46 Figure 14 - Estimated incidence of yersiniosis per 100,000 population, aggregated by gender and age group, Denmark, 2016………... 46 Figure 15 - Estimated incidence of VTEC per 100,000 population, segregated by gender and age group, Denmark, 2016………... 47 Figure 16 – Sensitivity analyses of Campylobacter spp.’s disease model illustrated in a “tornado” type of graph, showing the main sources of the model’s uncertainty. The abbreviations of the input variables are on the vertical axis………. 48 Figure 17 – Sensitivity analyses of Salmonella spp.’s disease model illustrated in a “tornado” type of graph, showing the main sources of the model’s uncertainty. The abbreviations of the input variables are on the vertical axis………. 49 Figure 18 – Sensitivity analyses of Y. enterocolitica’s disease model illustrated in a “tornado” type of graph, showing the main sources of the model’s uncertainty. The abbreviations of the input variables are on the vertical axis………. 49 Figure 19 – Sensitivity analyses of VTEC’s disease model illustrated in a “tornado”
type of graph, showing the main sources of the model’s uncertainty. The abbreviations of the input variables are on the vertical axis……….. 50 Figure 20 – Empirical cumulative distribution function of Campylobacteriosis’ multiplier (blue) and the first (pink), second (green), third (red) and fourth (orange) scenarios….. 52 Figure 21 – Empirical cumulative distribution function of salmonellosis’ multiplier (blue) and the first (pink), second (green), third (red) and fourth (orange) scenarios………….. 52 Figure 22 – Empirical cumulative distribution function of yersiniosis’ multiplier (blue) and the first (pink), second (green), third (red) and fourth (orange) scenarios…………. 53 Figure 23 – Empirical cumulative distribution function of VTEC’s multiplier (blue) and the first (pink), second (green), third (red) and fourth (orange) scenarios……….. 53 Figure 24 - Disease burden of four foodborne pathogens in Denmark for the year 2016. YLL and YLD components are shown separately………... 55 Figure 25 – Relative contribution of DALYs caused by different health-outcomes to the
viii
total burden of campylobacteriosis, salmonelosis, yersiniosis and VTEC infections in
Denmark, 2016………. 57
Figure 26 - Distribution of total burden of campylobacteriosis in age groups and sex in Denmark, 2016 (total DALYs per 100,000 population)……….. 58 Figure 27 - Distribution of total burden of salmonellosis in age groups and sex in Denmark, 2016 (total DALYs per 100,000 population)……….. 58 Figure 28 - Distribution of total burden of yersiniosis in age groups and sex in Denmark, 2016 (total DALYs per 100,000 population)……….. 58 Figure 29 - Distribution of total burden of VTEC infections in age groups and sex in Denmark, 2016 (total DALYs per 100,000 population)……….. 59
ix List of Tables
Table 1 - Burden of illness studies by country, number of studied pathogens and
estimated incidence per 100,000 population……….. 7 Table 2 - Estimated incidence of Campylobacter spp., Salmonella spp., VTEC and Y.
enterocolitica and their ordinal position among other foodborne pathogens by country.. 8 Table 3 - Pathogenic potential of Y. enterocolitica associated with bio and serotype
(Adapted from EFSA, 2007)……….. 13
Table 4 - Reported cases of yersiniosis and notification rates in the EU/EEA, by
country and year, 2011–2015 (Adapted from EFSA, 2016)………. 18 Table 5 - Non-pathogen specific parameters used to estimate the true incidence of
Campylobacteriosis, Salmonelosis, VTEC infections and yersiniosis in Denmark……... 24 Table 6 - Pathogen-specific parameters used to estimate the true incidence of
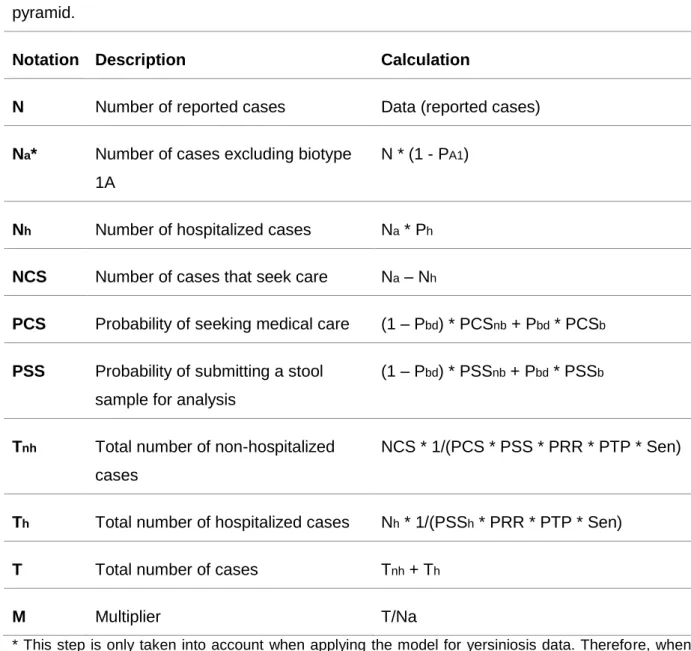
Campylobacteriosis, Salmonelosis, VTEC infections and yersiniosis in Denmark……... 26 Table 7 - Variables and calculations to re-construct the foodborne pathogens'
surveillance pyramid……… 28
Table 8 - Variables and calculations to re-construct the foodborne pathogens'
surveillance pyramid, accounting only for under-reporting………... 36 Table 9 - Description of Reactive arthritis' input and data sources………. 37 Table 10 - Description of health-outcomes' input and data sources……… 39 Table 11 - Duration and disability weights for Campylobacter spp. health-outcomes….. 40 Table 12 - Duration and disability weights for Salmonella spp. health-outcomes………. 40 Table 13 - Duration and disability weights for Y. enterocolitica’s health-outcomes…….. 41 Table 14 - Duration and disability weights for VTEC’s health-outcomes……… 41 Table 15 - Estimated incidence due to Campylobacter spp. infections in Denmark,
2016 (cases per 100,000 population)………... 43 Table 16 - Estimated incidence due to Salmonella spp. infections in Denmark, 2016
(cases per 100,000 population)……….……… 44
Table 17 - Estimated incidence due to Yersinia enterocolitica infections in Denmark,
2016 (cases per 100,000 population)………... 44 Table 18 - Estimated incidence due to VTEC infections in Denmark, 2016 (cases per
100,000 population)………. 45
Table 19 – Median and 95% confidence intervals (95% CI) for the multiplier and each
of the four scenarios of each foodborne pathogen’s disease model………... 51 Table 20 - Estimated total DALYs, YLL and YLD for Campylobacter spp., Salmonella spp., Y. enterocolitica and VTEC in Denmark, 2016………. 54 Table 21 - Estimated total DALYs, YLL and YLD associated with different
health-outcomes of Campylobacter spp. infection in Denmark, 2016………. 55 Table 22 - Estimated total DALYs, YLL and YLD associated with different
health-outcomes of Salmonella spp. infection in Denmark, 2016……… 56 Table 23 - Estimated total DALYs, YLL and YLD associated with different
health-outcomes of Y. enterocolitica infection in Denmark, 2016……… 56 Table 24 - Estimated total DALYs, YLL and YLD associated with different
health-outcomes of VTEC infection in Denmark, 2016……….. 56 Table 25 – Estimated total DALYs, YLLs, YLDs, total cases and deaths associated
with Campylobacter spp. infections in Denmark, 2016 by age group and sex………….. 59 Table 26 – Estimated total DALYs, YLLs, YLDs, total cases and deaths associated
with Salmonella spp. infections in Denmark, 2016 by age group and sex………. 59 Table 27 – Estimated total DALYs, YLLs, YLDs, total cases and deaths associated
with Y. enterocolitica infections in Denmark, 2016 by age group and sex………. 60 Table 28 – Estimated total DALYs, YLLs, YLDs, total cases and deaths associated
with VTEC infections in Denmark, 2016 by age group and sex………... 60 Table 29 – Overview of multiplying factors estimated to correct for under-reporting and
underdiagnosis of Campylobacter spp., Salmonella spp., Y. enterocolitica and VTEC infections in different countries worldwide………... 66 Table 30 – Comparison of burden of disease estimates for Denmark 2016 and other
x
Table 31 – Reported cases of campylobacteriosis in Denmark, 2016, aggregated by
sex and age group... 81 Table 32 – Reported cases of salmonellosis in Denmark, 2016, aggregated by sex
and age group……….. 81
Table 33 – Reported cases of VTEC in Denmark, 2016, aggregated by sex and age
group……….. 81
Table 34 – Reported cases of Yersinia enterocolitica in Denmark, 2016 aggregated by
sex and age group……….. 82
Table 35 – Danish Population in 2016, aggregated by sex and age group………... 82 Table 36 - Probability of developing Guillain-Barré syndrome for each age group…….. 82 Table 37 – Reported cases of hemolytic uremic syndrome in Denmark, 2016,
aggregated by sex and age group……… 83
Table 38 – Age-specific mortality risk by all causes in the Netherlands, 2012………….. 83 Table 39 – Danish average life expectancy table for the years 2015-2016 (Adapted
from Danish statistics)………. 84
Table 40 – World Health Organization’ life table for calculating years of life lost (YLL)
xi List of abbreviations
BoI – Burden of illness
DALY – Disability adjusted life year DTU – Denmark Technical University DW – Disability weight
EEA – European Economic Area
EFSA – European Food Safety Authority EU – European Union
FBD – Foodborne diseases GBD – Global Burden of Disease GBS – Guillain-Barré Syndrome GE – Gastroenteritis
GP – General practitioner
IBD – Inflammatory bowel disease IBS – Irritable bowel syndrome
MiBa – Danish Microbiological Database Pbd – Proportion of bloody diarrhea cases
PCSb – Probability of seeking medical care for bloody diarrhea patients PCSnb – Probability of seeking medical care for non-bloody diarrhea patients Ph – Proportion of hospitalized cases
PRR –Probability of reporting a positive laboratory result
PSSb – Probability of submitting a stool sample for analysis for bloody diarrhea cases PSSh – Probability of submitting a stool sample for analysis for hospitalized patients
PSSnb – Probability of submitting a stool sample for analysis for non-bloody diarrhea cases PTP – Probality of testing for pathogen in the sample
ReA – Reactive arthritis
Sen – Sensitivity of laboratory analysis SSI – Statens Serum Institute
US – United States of America
VTEC – verocytotoxin-producing E. coli WHO – World Health Organization YLD – Years lived with disability YLL – Years of life lost
1 Internship Report
As part of the Integrated Master’s Degree in Veterinary Medicine from the Faculty of Veterinary Medicine (FMV), University of Lisbon, I completed two internships with a total duration of nine months.
The first internship took place at the FMV, from mid-September to January. I was supervised by Professor Telmo Nunes and acquired skills that were essential to prepare for my second internship in Denmark. I learned how to perform statistical data analysis in R and did literature research on Burden of Illness and Burden of Disease studies, as well as on Yersinia. Still in Lisbon, I started adapting a BoI model to R, which enabled me to extend my initial designated tasks for my second internship.
In Denmark I spent five months at the National Food Institute, Technical University of Denmark (DTU-Food), where I developed a model to estimate the burden of disease of yersiniosis and adapted previously developed models concerning other three diseases (which was only possible due to the work I developed under the supervision of Professor Telmo Nunes).
Under the supervision of Dr. Sara Monteiro Pires, I learned how stochastic disease models are built to estimate the true incidence of foodborne diseases and learned how to apply the Disability Adjusted Life Years metric to estimate the Burden of foodborne pathogens. I worked with R and adapted previously built models in @Risk to C language. I also had the opportunity of contributing to the Annual Report on Zoonoses in Denmark, writing an article on the Disease Burden of Yersiniosis in the country.
I was able to interact with a wide range of researchers from different backgrounds, learn about their projects and be inspired by different ways of accessing problems.
I enrolled in a three week PhD course, taught by Dr. Maarten Nauta and Dr. Sofia Duarte, on Quantitative Microbiological Risk Assessment, where I learned about food pathways and how to apply deterministic and stochastic models regarding growth, inactivation and cross contamination of foodborne pathogens, using Excel and @Risk.
While in Denmark, I also had the opportunity to interact with an expert on Epidemiology from Statens Serum Institut, Dr. Steen Ethelberg, who helped me gather information to inform my yersiniosis’ model and enlightened me on how the surveillance of human zoonotic diseases was performed in Denmark.
Another enriching experience was doing a presentation to another expert, this time on Yersinia, from the Danish Agriculture and Food Council. I met with Dr. Marianne Sandberg, first to present my ideas regarding yersiniosis’ model and second to try and gather data to develop a source attribution model for this disease. Although there was no data available, I left this meeting with new knowledge and ideas.
Lastly, I had the opportunity to attend to several meetings of the Toxoplasma Group, which gathered experts from all Nordic countries, in order to understand how to tackle this parasitic disease, where I witnessed a true One Health approach, meeting researchers from all backgrounds.
At the end of my internship I presented my work on Yersinia to everyone at the Risk Benefit Group, which enabled me to practice my oral presentation skills, as well as to think critically in order to answer all the questions related to the study developed.
2 I. Literature review
1. Introduction
In the United Nations Agenda for Sustainable Development, the second goal to achieve by the year 2030 is to “End hunger, achieve food security and improved nutrition and promote sustainable agriculture”. Ensuring that all people have access to safe, nutritious and sufficient food is the first step to accomplish that goal. This dissertation will focus on foodborne diseases, which is a main obstacle in the road towards achieving food safety. Foodborne diseases (FBD) have long posed a threat to public health. In this changing World, the types, severity and impact of these illnesses have been in constant mutation, varying between individuals, communities, countries and regions (World Health Organization [WHO], 2015).
Through the consumption of contaminated foods, people are exposed to a variety of foodborne health hazards and can acquire a wide spectrum of illnesses, caused by a range of agents of bacterial, viral, parasitic, prionic or chemical nature (WHO, 2015; Tauxe, Doyle, Kuchenmüller, Schlundt, & Stein, 2010; Tauxe, 2002). These illnesses are often acute and self-limiting (diarrhea and vomiting), but can also be severe and chronic, such as kidney and liver failure, neurological disorders, and non-communicable diseases, like cancer, reproductive and immunological problems (WHO, 2014) .
Many foodborne pathogens have animals as main reservoirs, thus enabling transmission to humans through various exposure routes, including environmental from primary production sources, and foodborne transmission due to contamination at different points in the food chain (Pires, 2014).
To join the multitude of current foodborne agents, new and re-emerging hazards, with different sources of contamination, have brought new challenges to food safety in the last decade (WHO, 2014).
With the globalization of food trade, people expect a wider variety of foods, which led to a modification in the food production, distribution and consumption. With this, contaminated food products can reach people living in different countries throughout the world, spreading more easily and reaching global consequences (WHO, 2014). Another reason for this accelerated spread is the growing easiness for travelling long distances (Tauxe, 2010). As expected, FBD not only influence people’s health, but have also a negative impact on economy. The burden on the health-care systems, trade and tourism, food and agricultural sectors, brings significantly high damages to economic productivity and threatens the livelihood of people (Food and Agriculture Organization [FAO], World Organization for Animal Health [OIE], & WHO, 2010).
Veterinary doctors play a key part on the implementation of preventive and control measures, either concerning animal diseases, zoonoses or food hygiene and safety.
3
Therefore, on September 29, 2004 the Wildlife Conservation Society gathered a group of health experts from around the world for a symposium on the current and potential movements of diseases among human, domestic animal, and wildlife populations. With this event, the “One World, One Health” initiative was born, proposing 12 recommendations, The Manhattan Principles, for the application of a more holistic approach for the prevention of epidemic/epizootic disease and the maintenance of ecosystems integrity (FAO, OIE, WHO, United Nations System Influenza Coordination, United Nations Children’s Fund [Unicef], The World Bank, 2008).
They concluded that, to overcome all the hardships caused by zoonoses and animal diseases, while trying to ensure the biological integrity of the Earth for future generations, it would require interdisciplinary and cross-sectoral approaches to disease prevention, surveillance, monitoring, control and mitigation, as well as to environmental conservation (FAO, OIE, WHO, United Nations System Influenza Coordination, Unicef, The World Bank, 2008).
With this vision, cooperation and strong partnership is expected between human and veterinary medicine, among other scientific-health and environmentally related disciplines.
2. Estimating total incidence of foodborne pathogens
To help decision makers implement prevention, intervention and control measures in order to improve food safety systems, ranking FBD’ impact is essential (WHO, 2015).
Although the importance of FBD is recognized globally, accurate data on its epidemiology, causative agents and its relative impact on public health is lacking (WHO, 2015). In order to give good guidance for the development and implementation of food safety policies, to achieve effective and efficient food safety systems and thereby protect consumers and improve public health, the first step is to estimate the total disease burden and etiology of these illnesses (WHO, 2015).
The burden of foodborne diseases reflects the number of cases occurring on the population. For many pathogens, such data can be retrieved from national public health surveillance systems, which can be both active and passive, as well as from outbreak surveillance. But, even with a surveillance system in place, the reported laboratory-confirmed cases are known to be largely underestimated (Scallan et al., 2011).
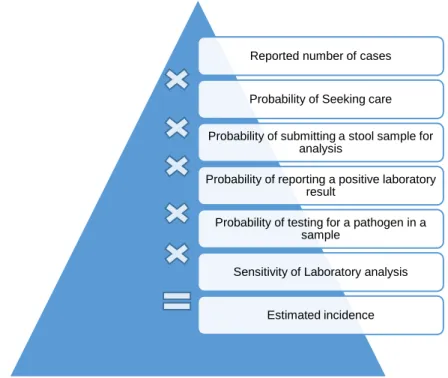
Data collected by surveillance systems represent only the “tip of the iceberg” and leads to a wrong picture on how these diseases impact public health (Pires, 2014). That happens because some ill persons do not seek medical care; some physicians do not request and submit a stool sample to a clinical laboratory to be tested; the clinical laboratory might not be able to isolate and identify the causative pathogen; and failures to report positive cases to
4
the public health surveillance system might occur (WHO, 2015), leading to under-reporting and/or underdiagnosis (Figure 1).
Underdiagnosis is a consequence of the health care system’s failure to capture cases in the community that do not seek medical care, while under-reporting, the consequence of not achieving diagnosis, classification or notification of cases that have sought care (Haagsma, Polinder, Stein, & Havelaar, 2013b).
Figure 1 - The foodborne diseases’ surveillance pyramid. The tip of the pyramid represents pathogen-specific cases reported to public health surveillance, whereas the base represents all cases caused by that pathogen occurring in the country in a given year. (Adapted from Pires, 2014).
2.1. Surveillance of human disease in Denmark
Public health surveillance systems are used to collect data in order to inform the authorities about epidemic and other health problems in a community. The data collected can be used to identify the magnitude and distribution of health events, to detect and monitor changes in infectious agents, and to evaluate control measures (Centers for Disease Control and Prevention [CDC], 2012).
In Denmark, human cases due to foodborne zoonotic pathogens are reported to Statens Serum Institut (SSI) through different channels depending on the disease (Anonymous, 2017): Reported Confirmed diagnostic Sample tested Sample submitted Sample collected
Seeking medical care
All cases
Under-reporting
5
• Notifiable through the laboratory surveillance system: Salmonella, Campylobacter,
Yersinia, verocytotoxin-producing E. coli (VTEC) and Listeria.
• Individually notifiable zoonotic pathogens: Chlamydia psittacci (ornithosis),
Leptospira (Weils disease), Mycobacterium, Bovine Spongiform Encephalopathy
(BSE) prions (var. Creutzfeldt-Jakob Disease), VTEC and Lyssavirus (rabies).
• Non-notifiable zoonotic pathogens: Brucella.
The general practitioners (GP) report individually notifiable zoonotic diseases to the Danish Health Authority and the Department of Infectious Disease Epidemiology at SSI. They also send samples from suspected cases to one of the official clinical microbiology laboratories. There are twelve clinical microbiological departments covering the whole of Denmark. Most are located at a hospital and receive samples from the surrounding GPs (Espenhain, 2013). Positive cases diagnosed are reported through the laboratory surveillance system to the Unit of Gastrointestinal Infections at SSI. The laboratories must report positive results within one week. In addition to this, all Salmonella and VTEC isolates are sent to the reference laboratory, also at SSI, for further sero and genotyping. The results are recorded in the Register of Enteric Pathogens (MiBa) and cases are reported as episodes, i.e. each patient-infectious agent combination is only recorded once in a six-month period (Anonymous, 2017). The diagram of the collaboration between the authorities, the industry and non-governmental organizations is described by Figure 2. This inter-relationship is a successful example of a One Health approach, including a multidisciplinary team of scientists, which works independently, either from the State (policy makers and authorities) or other stakeholders, ensuring transparency. Also, stakeholders, such as industry, and the primary production sector (represented by the Danish Veterinary and Food Administration) are parts of this approach. This is an example of a holistic approach to food safety, quite unique in the world.
6
Figure 2 - Overview of the monitoring and outbreak investigation network for reporting infectious pathogens in humans, animals, foodstuffs and feed-stuffs in Denmark, 2016 (Anonymous, 2017).
2.2. Population, Physician and Laboratory surveys
Surveys are a valuable tool to understand the behavior of the different groups that influence under-reporting and underdiagnosis (Flint et al., 2005).
As mentioned before, underdiagnosis contributes to the underestimation of cases of FBD. People with gastrointestinal illness often do not seek medical care and therefore are not diagnosed. Those cases never reach the surveillance system and are not accounted for in the health reports.
Population surveys can be used to understand patient-behavior and assess the proportion of people that do not seek medical care, which will then be used to correct the reported number of cases, getting closer to the true incidence of foodborne pathogens (Müller, Korsgaard, & Ethelberg, 2012; Scallan et al., 2006).
General practitioners’ knowledge, submission and interpretation of clinical specimen test results have a marked influence on public health surveillance, outbreak detection and patient management (CDC, 2012). Undetected cases of foodborne illness and misinterpretation of laboratory test results can delay treatment, reporting and outbreak detection (Clogher et al., 2012; Schmutz et al., 2017; Van Cauteren et al., 2015).
Even though many foodborne infections are self-limiting and do not require treatment, to successfully manage patient disease, the physician should properly diagnose it. Also, the use of antimicrobial drugs in mild or moderate cases of foodborne illness is relatively common, despite guide lines recommending their use only for severe cases (Rosner, Werber, Höhle, & Stark, 2013). Knowledge of which diagnostic tests to order and their right
7
interpretation, as well as correct treatment approaches, is needed to achieve better patient outcomes. However, laboratory testing methods are constantly changing, therefore both open communication between physicians and microbiologists and educational interventions are a main step to achieve best practices (Clogher et al., 2012).
Physician surveys can be useful to understand their perception and practices (Wong et al., 2004) and will help to reconstruct the surveillance pyramid, assessing the proportion of physicians that do not request and submit a stool sample (Schmutz et al., 2017; Van Cauteren et al., 2015).
At last, in a laboratory-based surveillance, clinical microbiology laboratories are the key. It is through the identification and notification to the public health authorities of culture-confirmed infections that recognition of both foodborne outbreaks and sporadic cases, and epidemiological understanding overtime is achieved. Thereby, to interpret laboratory-based surveillance data, laboratory testing and reporting procedures must be considered (Voetsch
et al., 2004).
Differences between laboratories’ routine testing practices and their reporting systems might contribute to variations in the incidence rate of reported cases of foodborne illnesses, adding to under-reporting.
Laboratory surveys might therefore help to characterize current practices and monitor changes in methodologies overtime (Voetsch et al., 2004).
2.3. Burden of foodborne illness studies
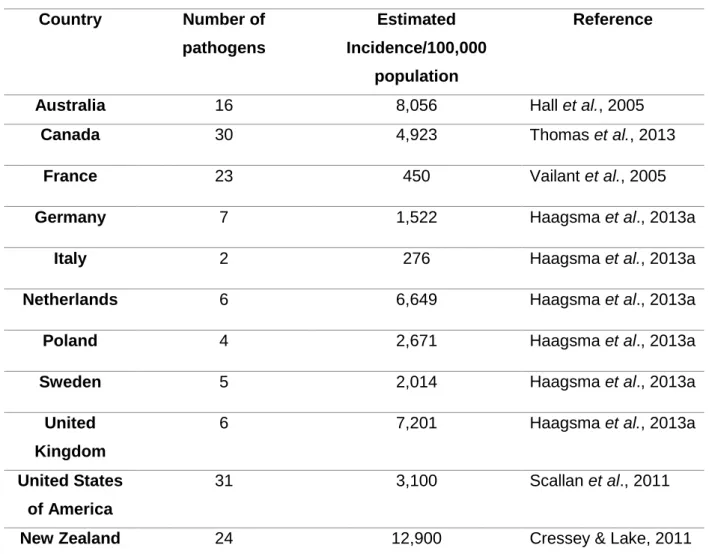
Both in Europe and outside, several countries have conducted burden of illness (BoI) studies in an attempt to estimate the true incidence of foodborne illnesses in their population (Cressey & Lake, 2011; Haagsma et al., 2013a; Hall et al., 2005; Scallan et al., 2011; Thomas et al., 2013; Vaillant et al., 2005).
Table 1 shows an overview of the countries performing these studies, the number of pathogens considered and the estimation of incidence per 100,000 population.
Even though all studies follow similar methodologies, there are differences in details of the surveillance pyramid reconstruction approach and on the number of pathogens included, highlighted by Table 1, therefore the results of these studies cannot directly be compared (Haagsma et al., 2013a).
The above being true, I would like to emphasize that all these studies have considered
Campylobacter spp., non-typhoidal Salmonella spp., verocytotoxin-producing Escherichia coli (VTEC) (although many grouped it with other E. coli pathotypes) and Yersinia enterocolitica, considering them relevant causes of FBD.
8
Table 1 - Burden of illness studies by country, number of studied pathogens and estimated incidence per 100,000 population.
Country Number of pathogens Estimated Incidence/100,000 population Reference
Australia 16 8,056 Hall et al., 2005
Canada 30 4,923 Thomas et al., 2013
France 23 450 Vailant et al., 2005
Germany 7 1,522 Haagsma et al., 2013a
Italy 2 276 Haagsma et al., 2013a
Netherlands 6 6,649 Haagsma et al., 2013a
Poland 4 2,671 Haagsma et al., 2013a
Sweden 5 2,014 Haagsma et al., 2013a
United Kingdom
6 7,201 Haagsma et al., 2013a
United States of America
31 3,100 Scallan et al., 2011
New Zealand 24 12,900 Cressey & Lake, 2011
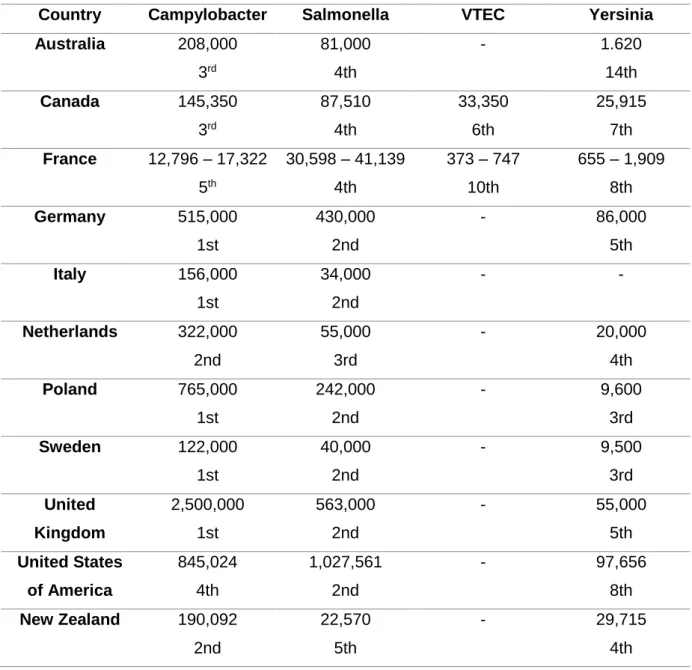
In eight out of eleven countries, Campylobacter spp. is the pathogen with the highest incidence, when compared to Salmonella spp. VTEC and Y. enterocolitica (Table 2), ranking from first to third, when compared with all foodborne hazards included in its respective study. (Hall et al., 2005; Cressey & Lake, 2011; Haagsma et al, 2013a; Thomas et al., 2013).
In the United States (US) and in France, Salmonella spp., compared to the other three pathogens, is the highest incident pathogen, occupying the second and fourth position, respectivily, according to Scallan and colleagues (2011) and Vailant and colleagues (2005). Regarding Yersinia enterocolitica, New Zealand estimated more cases of this pathogen than
Salmonella spp. (Cressey & Lake, 2011), which is not seen in the other studies, where Yersinia occupies lower positions in the ranking than both Campylobacter and Salmonella
(Hall et al., 2005; Vailant et al., 2005; Scallan et al., 2011; Haagsma et al., 2013a; Thomas et
al., 2013). Although in Australia Yersinia is one of the pathogens with lower incidence (Hall et al., 2005), in countries like Canada, France and the US (that considered a larger number of
pathogens), Yersinia is the 7th and 8th most incident pathogen (Thomas et al., 2013; Vailant et al., 2005; Scallan et al., 2011), showing that it is not a negligible cause of FBD.
9
VTEC was only considered separatly in Canada and France. Nonetheless, verocytotoxin-producing E. coli is an important cause of FBD and should not be discarded.
Table 2 - Estimated incidence of Campylobacter spp., Salmonella spp., VTEC and Y.
enterocolitica and their ordinal position among other foodborne pathogens by country.
Country Campylobacter Salmonella VTEC Yersinia
Australia 208,000 3rd 81,000 4th - 1.620 14th Canada 145,350 3rd 87,510 4th 33,350 6th 25,915 7th France 12,796 – 17,322 5th 30,598 – 41,139 4th 373 – 747 10th 655 – 1,909 8th Germany 515,000 1st 430,000 2nd - 86,000 5th Italy 156,000 1st 34,000 2nd - - Netherlands 322,000 2nd 55,000 3rd - 20,000 4th Poland 765,000 1st 242,000 2nd - 9,600 3rd Sweden 122,000 1st 40,000 2nd - 9,500 3rd United Kingdom 2,500,000 1st 563,000 2nd - 55,000 5th United States of America 845,024 4th 1,027,561 2nd - 97,656 8th New Zealand 190,092 2nd 22,570 5th - 29,715 4th
3. Burden of Disease studies
The impact of a disease can be measured by its incidence and/or the number of deaths (mortality) caused by it in a population (Devleesschauwer et al., 2015), therefore burden of foodborne illness studies could be used to rank diseases. However, using only these two population health measures, the impact of FBD on human health is not depicted accurately (Devleesschauwer et al., 2015). In fact, a disease might have a very high incidence but cause very low burden due to its mild symptoms, or because it is mostly asymptomatic. On the other hand, a disease can cause few cases per year, but have high mortality rate. How to
10
compare, for example, an incidence of 300,000 cases, low severity and 0% mortality with a disease causing three cases with high severity and 33% mortality?
Also, ignoring the age at which people die due to a specific disease, can be problematic. What if two diseases have the same incidence and the same mortality, but the deaths in one occur in younger people? Likewise, if those population health measures are the same, but one disease only causes acute symptoms (i.e. have short duration) and the other chronic life-long sequelae?
To overcome these limitations, the Disability Adjusted Life Year (DALY) metric was developed (Murray & Lopez, 1996) and is currently the most used metric to estimate the burden of disease (WHO, 2015), a concept developed in the 1990s. By incorporating morbidity, mortality and disability in one metric, the DALY enables the comparison and ranking between diseases for all regions of the world (Murray & Lopez, 1996).
The concept of the DALY metric is simple: it represents the years lived with disability (YLD), i.e. years lived with decreased quality of life, and the years of life lost (YLL) due to premature death as a consequence of a given disease or condition, at the individual or population level (Anonymous, 2017).
3.1. Foodborne disease model
Risk factors increase the probability of having a disease by facilitating the exposure to biological, chemical or physical hazards. The course of disease is then characterized by distinct health states, with possibly different severity levels (Devleesschauwer et al., 2014b). Therefore, a disease model, also called health-outcome tree, provides a qualitative representation of all potential disease progression pathways throughout time (Mangen et al., 2013).
Depending on the perspective of the study, there are three disease model approaches relevant to burden of disease studies regarding foodborne diseases (Devleesschauwer et al., 2014b; Haagsma et al., 2013b; Mangen et al., 2013):
I. Outcome-based disease models
This approach assigns different health states of disease, independent of the etiology (Figure 3). For example, a disease model for the burden of diarrhea might describe different severity levels, as well as different health-outcomes occurring sequentially in time (e.g. reactive arthritis), which contribute to YLDs, and diarrhea related death, contributing to YLLs (Devleesschauwer et al., 2014b; Haagsma et al., 2013b; Mangen et al., 2013).
11 II. Hazard-based disease models
This approach represents all relevant health-outcomes, acute and/or chronic, that can be attributed to a single agent (Figure 3). Being so, the starting point using a hazard-based disease model is illness caused by the exposure to biological, chemical or physical hazards (Devleesschauwer et al., 2014b; Haagsma et al., 2013; Kretzschmar et al., 2012).
III. Risk factor-based disease models
The third possible disease model used to estimate the burden of foodborne diseases associates different health states with risk factors that can influence exposure to causative agents of foodborne illness (Figure 3) (Devleesschauwer et al., 2014b; Haagsma et al., 2013). As an example, a disease model for unsafe water would include the health-outcomes associated with feco-oral agents (Clasen et al., 2014; Prüss-Ustün et al., 2014).
Figure 3 - Foodborne disease model depicting the three possible approaches: Risk factor-based, Hazard-based and Outcome-based (Adapted from Haagsma, 2013b).
3.2 Disability weights
The disability weight (DW) concept was developed in order to reflect the impact of health states causing different disabilities and to compare morbidity and mortality (Murray & Lopez, 1996). Disability is, in this context, defined as any short or long-term loss of health (Salomon
et al., 2015).
A DW for a health state is scaled from zero, indicating full health, to one, which implies that the health state is equivalent to death (worst possible health state) (Salomon et al., 2015).
Risk factor-based approach Risk factor 1 Risk factor 2 Risk factor 3 . Exposure to agent Hazard-based approach Not affected Affected Outcome-based approach Acute illness Sequelae Fatal
12
In the DALY calculation, the DWs are a crucial component. By multiplying the number of people affected by a health-outcome with the time of its duration and the correspondent DW, the number of years lived with disability can be calculated (Murray & Lopez, 1996).
This value is based on judgements of possibly three sets of respondent groups. Namely, health-care professionals, individuals who experience a specific health state and the general public (Salomon et al., 2012).
The Global burden of disease study of 1996 (GBD) used a panel of health-care professionals on the basis that they would have knowledge of a large set of health states and would be able to perform comparative unbiased judgements. However, most of the studies using DW use the responses of the general public, under the argument that the views of the general public are relevant in comparative assessments that inform public policy (Salomon et al., 2012).
3.3 Social weighting
In the course of developing the DALY metric, the first GBD study applied two social value choices: time discounting and age weighting (Murray & Lopez, 1996). These two factors were applied in attempt to address two questions:
‘Are lost years of healthy life valued more at some ages than others?’
Age weighting reflects that individuals have different roles and changing levels of dependency and productivity with age (Murray & Lopez, 1996). Its application means that, depending of an individual’s age, time will be valued differently, specifically, youngest and oldest ages are given less weight (Pires, 2014).
‘Is a year of healthy life gained now worth more to society than a year of healthy life gained sometime in the future?’
Time discounting is based on a standard practice in economic analysis, which entails that benefits now are preferable to a benefit gained later in time (Murray & Lopez, 1996). By applying this social weighting function, we consider that future life years are less valuable than those lived today (Devleesschauwer et al., 2014a; M. Pires, 2014).
These two social weighting functions have not been universally accepted and, in recent years, have not been applied by burden of disease studies (Institute for Health Metrics and Evaluation [IHME], 2016; WHO, 2015).
13 4. Yersiniosis
4.1. Yersinia spp.
The genus Yersinia, of the family Enterobacteriaceae, comprises three major human pathogens and several non-pathogenic species. The pathogenic species are Yersinia pestis, the causative agent of the plague, Yersinia enterocolitica and Yersinia pseudotuberculosis, which are both enteropathogens, causing yersiniosis (European Food Safety Authority (EFSA), 2007).
Of these three species, Y. pestis is neither foodborne nor found in Europe. Regarding the two enteropathogenic species, Y. enterocolitica is the most frequent cause of human disease in Europe, since Y. pseudotuberculosis cases are rare and are mostly found in North-Eastern Europe, mainly, Finland and Russia (EFSA, 2007; Jalava et al., 2004). In 2015, 99.5% of the reported cases of yersiniosis in the European Union/European Economic Area (EU/EEA) were caused by Y. enterocolitica (EFSA, 2016).
4.2. Yersinia enterocolitica
Y. enterocolitica is a Gram-negative, facultative anaerobic rod (occasionally coccoid). It does
not form a capsule or spores and it is nonmotile at 35–37 °C, but motile at 22–25 °C (Bottone
et al., 2005). In addition, it has the capacity of growing at refrigeration temperatures (Van
Damme, De Zutter, Jacxsens, & Nauta, 2017). Within this species there is enough biochemical heterogeneity to establish six biotypes and different O-antigen specificity for several (more than 48) serotypes (Nesbakken, 2015).
Bio and serotyping of Y. enterocolitica are crucial, as its pathogenic potential varies greatly between bio/serotype combinations (Table 3) (Nesbakken, 2015). Harboring a virulence plasmid and having the High Pathogenicity Island, enables the differentiation of three groups of Y. enterocolitica pathogenicity: highly pathogenic, pathogenic and non-pathogenic (EFSA, 2007).
Although biotype 1A is regarded as non-pathogenic, recent studies have provided conflicting reports on the subject (EFSA, 2016). In a literature review, Bottone (2015) concluded that 1A strains may cause symptomatic infections in patients with underlying disorders (immunosuppression). In a study that compared Y. enterocolitica 1A isolated from patients and asymptomatic carriers, it was concluded that more research is needed to prove that this strain is a primary cause for human yersiniosis and not only a secondary finding (Stephan et
14
Table 3 - Pathogenic potential of Y. enterocolitica associated with bio and serotype (Adapted from EFSA, 2007).
Biotype Serotypes Virulence
for humans
Frequency in Europe
Pathogenicity Determinants 1A Numerous (O:8; O:5;
O:7; O:13;…)
NP ++++ⁿ None
1B O:8; O:21; O:13; O:7;… HP ≈0 Both
2 O:9; O:5,27 P ++ to +++ pYV
3 O:3; O:5,27 + pYV
4 O:3 P ++++ pYV
5 O:3; O:2,3; O:1,2,3 P ≈0 pYV
ⁿ: From 0 to ++++ indicates the frequency of each subgroup. NP: non-pathogenic; HP: highly pathogenic; P: pathogenic; pYV: virulence plasmid.
4.2.1. Epidemiology of Yersinia enterocolitica
Numerous animals, animal-derived food products, vegetables and water sources have been identified as sources of Y. enterocolitica, however the understanding of its epidemiology is still incomplete (Nesbakken, 2015; Rosner, Stark, & Werber, 2010).
There is often a strong correlation between the bio/serotype of strains isolated from humans and the ones isolated from pigs in the same geographical area (EFSA, 2007; Fredriksson-Ahomaa, Stolle, Siitonen, & Korkeala, 2006; Kapperud, 1991; Rosner, Stark, Höhle, & Werber, 2012; Tauxe, 2002), therefore pork is considered the main source of pathogenic Y.
enterocolitica (Van Damme et al., 2017).
The most frequently reported bio/serotype combination since the beginning of EU’s yersiniosis surveillance has been 4/O:3 (EFSA, 2016). The main reservoir of this strain is the pig, which can asymptomatically carry the pathogen in the intestinal tract, lymph nodes and tonsils, which is the major source of contamination (Fredriksson-Ahomaa, Björkroth, Hielm, & Korkeala, 2000; Laukkanen-Ninios, Fredriksson-Ahomaa, & Korkeala, 2014).
Case control studies of sporadic cases of yersionisis conducted in Norway (Ostroff et al., 1994) and in Germany (Rosner et al., 2012) have identified consumption of pork as an important risk factor for Y. enterocolitica infections.
This pathogen has also been isolated from tonsils and fecal samples of wild boars (Fredriksson-Ahomaa, Wacheck, Koenig, Stolle, & Stephan, 2009; Nesbakken, 2015). They are also a significant concern regarding yersiniosis, because of poor slaughter hygiene (EFSA, 2013).
Cattle can be asymptomatic carriers of serotype O:9 (EFSA, 2016), although case-control studies have not identified beef as a source of yersiniosis (Nesbakken, 2015). The link
15
between cattle and humans has been milk and dairy products, which have been connected with outbreaks of yersiniosis (EFSA, 2007; Nesbakken, 2015).
Water and vegetables have also been associated with sporadic cases and outbreaks of Y.
enterocolitica infections (Macdonald et al., 2011; MacDonald et al., 2016; Ostroff et al.,
1994).
Other source of yersiniosis are rodents, reservoirs of biotype 1B (serotypes O:8 and O:21) in Japan, and potentially in North America (EFSA, 2007). Dogs and cats might also be vehicles of this pathogen (Stamm, Hailer, Depner, Kopp & Rau, 2013).
4.2.2. Control of Y. enterocolitica in the food chain
Y. enterocolitica can survive and grow at temperatures as low as -5 ºC (Laukkanen-Ninios et al., 2014). Therefore this bacterium has the ability to survive and propagate at refrigeration
temperatures, which implies that it has to be controlled in the food chain (Nesbakken, 2015; Van Damme et al., 2017).
I. Pig meat chain
Because pigs are the major known source of Y. enteroclitica infection worldwide, the control of this foodborne pathogens throughout all the meat chain is essential to ensure the protection of consumers (Nesbakken, 2015).
Lowering the prevalence of Y. enterocolitica in farms would also lower the contamination at slaughterhouses, helping to reduce yersiniosis’ cases caused by contaminated pork (Laukkanen-Ninios et al., 2014). Therefore, identifying control measures at farm level is the first step to reduce yersiniosis’ burden.
At farm level, some risk factors have been identified as contributors for seropositive herds, namely:
1. Buying animals from herds with an unknown carrier state for human pathogenic Y. enterocolitica (Skjerve, Lium, Nielsen, & Nesbakken, 1998; Virtanen, Salonen, Laukkanen-Ninios, Fredriksson-Ahomaa, & Korkeala, 2012);
2. Buying piglets from more than one farm (Virtanen et al., 2012; Vilar, Virtanen, Heinonen & Korkeala, 2013; Virtanen, Nikunen & Korkeala, 2014);
3. Use of non-municipal water sources and having a continuous production (instead of applying an all-in/all-out strategy) (Vilar et al., 2013).
According to a Norwegian study, it is possible to establish clusters of pig herds free of pathogenic Y. enterocolitica, and keep them free from this foodborne pathogen for many
16
years (Nesbakken, Iversen, & Lium, 2007), however it may not be an economically feasible practice (Laukkanen-Ninios et al., 2014).
Laukkanen-Ninios and collaborators (2014) have also concluded that there is insufficient data on how to reduce the prevalence of this pathogen at farm level and that more studies regarding infection’s dynamic on farms are required.
During slaughter and dressing procedures, human pathogenic Y. enterocolitica from the oral cavity and/or intestinal content of pigs, may contaminate both the carcasses and the environment in the slaughterhouses (Nesbakken, 2015; Van Damme et al., 2015), therefore control measures are needed to prevent it (Laukkanen-Ninios et al., 2014).
One way to reduce contamination at environmental level would be to slaughter pigs at an older age (135 days or older), when the secretion of the pathogen in feces decreases, however, at this age, pigs still carry the pathogen in high concentrations in the tonsils (Nesbakken, Iversen, Eckner & Lium, 2006), so the major source of contamination remains (Laukkanen-Ninios et al., 2014).
During the slaughter process, scalding, singeing, bagging of the rectum after bunging, and removal of the head with tonsils and tongue intact are the phases that can reduce carcass contamination with Y. enterocolitica (Nesbakken, Nerbrink, Røtterud & Borch, 1994; Laukkanen et al., 2008; Laukkanen-Ninios et al., 2014; Van Damme et al., 2015, 2017). Although various control measures during slaughter and dressing procedures have been identified, the best way to reduce contamination at the slaughterhouse due to Y.
enterocolitica is to improve hygiene practices and use the bagging of the rectum
(Laukkanen-Ninios et al., 2014; Nesbakken, 2015). The separation of the head with tonsils and tongue intact, even though consisting in an efficient control measure, would require changes in many slaughter lines (Laukkanen-Ninios et al., 2014).
Regarding meat inspection, compulsory procedures that involve incisions in the submaxillary lymph nodes in order to detect tuberculosis, represent a cross-contamination risk (Nesbakken, Eckner, Høidal & Røtterud, 2003). EFSA also recommends a visual post
mortem inspection to avoid this risk factor on its ‘Scientific opinion on the public health
hazards to be covered by inspection meat (swine)’ (EFSA, 2011).
After slaughter, control measures seem ineffective, since Y. enterocolitica can survive and grow during cold storage and under modified atmospheres (Laukkanen-Ninios et al., 2014; Nesbakken, 2015).
II. Consumer phase
The correct handling of pork, hygienic practices during food preparation and adequate cooking of meat in both domestic and restaurant kitchens are of vital importance to reduce the number of cases of yersiniosis (Nesbakken, 2015).
17
Many people are not aware of basic food safety practices, as well as the risks associated with the consumption of animal derived food products (Laukkanen-Ninios et al., 2014). Therefore, consumers need to be informed and educated regarding food safety procedures of food handling, storage and preparation of food, which can be achieved by sharing information in a more appealing and disseminated way (Langiano et al., 2012; Losasso et al., 2012; Nesbitt et al., 2014).
4.3. Clinical manifestations of yersiniosis
Yersiniosis’ most common presentation is gastroenteritis with self-limiting diarrhea associated with mild fever and abdominal pain; however, moderate and bloody diarrhea can also occur (Bottone, 1997; Helms, Simonsen, & Molbak, 2006; Huovinen et al., 2010; Nesbakken, 2015; Ostroff et al., 1992; Rosner et al., 2013; Schiellerup, Krogfelt, & Locht, 2008; Stolk-Engelaar & Hoogkamp-Korstanje, 1996; Zheng, Sun, Lin, Mao, & Jiang, 2008). In addition, in older children and young adults, symptoms may resemble those of appendicitis (pseudoappendicitis), due to an infection limited to the right fossa iliaca, causing terminal ileitis or mesenteric lymphadenitis (Azghari et al., 2016; Bottone, 1997; Nesbakken, 2015; Rosner et al., 2013; Shorter, Thompson, Mooney, & Modlin, 1998; Stolk-Engelaar & Hoogkamp-Korstanje, 1996; Van Noyen, Selderslaghs, Bekaert, Wauters, & Vandepitte, 1991; Zheng et al., 2008) .In a cohort study, yersiniosis patients were more than 70 times more likely to report an appendectomy than the reference group (RR 73.5 [95% CI: 9.9 – 544.0]; p<0.001) (Rosner et al., 2013).
Yersiniosis can also cause long-term extra-intestinal complications, such as reactive arthritis (Bottone, 1997; Hannu, Inman, Granfors, & Leirisalo-Repo, 2006; Helms et al., 2006; Huovinen et al., 2010; Nesbakken, 2015; Ostroff et al., 1992; Rosner et al., 2013; Schiellerup
et al., 2008; Stolk-Engelaar & Hoogkamp-Korstanje, 1996; Townes et al., 2008; Zheng et al.,
2008) and erythema nodosum (Bottone, 1997, 2015; Helms et al., 2006; Nesbakken, 2015; Rosner et al., 2013; Stolk-Engelaar & Hoogkamp-Korstanje, 1996; Zheng et al., 2008). In addition, Irritable bowel syndrome, a chronic gastrointestinal disorder, is also a possible sequela of this disease (Helms et al., 2006; Ostroff et al., 1992; Porter et al., 2013; Rosner et
al., 2013, Schwille-Kiuntke, Frick, Zanger, & Enck, 2011).
Y. enterocolitica can also cause septicemia (Azghari et al. 2016, Bottone, 1997, 2015; Helms et al., 2006; Stolk-Engelaar & Hoogkamp-Korstanje, 1996; Zheng et al., 2008), especially in
immunosuppressed persons and those in iron overload or being treated with desferrioxamine (Bottone, 1997).
18
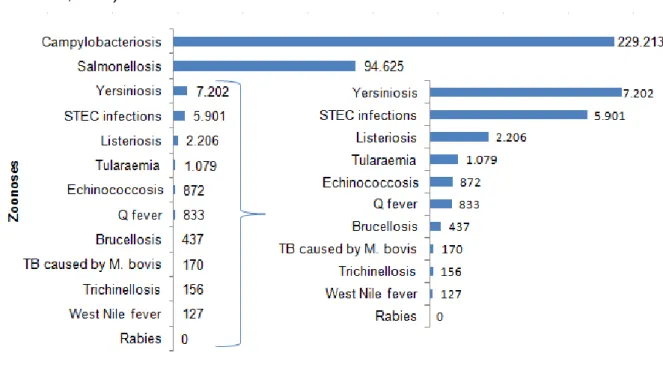
4.4. Yersiniosis in the European Union and Denmark
Yersiniosis was the third most reported zoonosis in the European Union for the year 2015 (Figure 4), and has been so since 2005 (EFSA, 2016; EFSA, 2009).
In the EU/EEA, the notification rate of yersiniosis for the year 2015 was 2.2 cases per 100,000 population, which was 6.8% higher than the year before. Although there was an increase in 2015, for the last eight years there has been a statistically significant decrease in the reported cases of this disease (EFSA, 2016).
Figure 4 - Reported numbers of confirmed human zoonoses cases in the EU, 2015. (Adapted from EFSA, 2016)
Twenty six member states reported this disease in 2015 (Table 4). Portugal reported it for the first time. Finland, Denmark and Check Republic had the highest country-specific notification rates in 2015. Lithuania has been decreasing the number of reported cases since 2011, when it was the country with the highest notification rate; the opposite has happened with Denmark, with a steady increase since 2011, having the second highest country-specific notification rate in 2015 and 2014 (9.54 and 7.71 cases per 100,000 population, respectively); while Finland has showed a fairly constant prevalence of yersiniosis, having the highest notification rate in 2012-2015.
Only 0.5% of the reported cases were caused by Y. pseudotuberculosis in 2015 (EFSA 2016).