Bacillus licheniformis
specific DNA markers
for identification and
culture-independent
monitoring
Maria Eduarda Marques de Almeida
Mestrado em Biologia Celular e Molecular
Departamento de Biologia 2014
Orientador
Todas as correções determinadas pelo júri, e só essas, foram efetuadas. O Presidente do Júri,
“Não sei o que acontecerá no futuro ao Homem,
mas uma certeza eu tenho, nós vamos e elas
(bactérias) ficam
.”
Acknowledgements
The past year was a learning journey, in which the help and dedication of colleagues was precious to accomplish this work. Support of family and friends was also essential and will not be forgotten. To all of them, I express my deepest and sincere appreciation.
First, I would like to express my deepest and truly thanks to my supervisor, Prof. Fernando Tavares, for always pushing me to think further about my work and also for the constant guidance and support. I know that sometimes it was not easy for him, but I assure that his inspiring words will always be remembered in my mind. Foremost, he is a mentor to me.
I also would like to address a special thanks to Pedro Albuquerque that was always nearby to give me a word of guidance, when my (many, many,…) doubts arose. His endless patience to guide and support me and his countless advices to help me were priceless. Also, without all his help my work in the laboratory would have been much more complicated. So, Pedro, you are right when you say to me “és uma chata”.
A special thanks to Cláudia Serra for teaching me so many things with infinite patience, with always a smile in her face and a friendly word to guide me, even in her busiest moments. She was always ready to offer all the knowledge that I needed, without asking anything in return.
There are no words to thank these three persons: Prof. Fernando Tavares, Pedro Albuquerque and Cláudia Serra.
Also, I would like to thank Inês Guerreiro from NUTRIMU for providing the samples used in this work, for always being available to help me and for all her kindness.
I would like also to thank Prof. Aires Oliva Teles and Paula Enes for always being welcoming at the NUTRIMU. Also, thank you to Patricia Díaz-Rosales and Filipe Coutinho by guiding me throughout all qPCR experiment.
I am also grateful to Dr. Adriano O. Henriques from Microbial Development group at ITQB for the Bacillus strains that he kindly provided.
Very special thanks to Tiago Araújo who became an essential part of my life and knows me better than anyone (and did not run away). I know that not always has been easy to deal with me, but I am here also for him, through the best and the worst.
To my closest friends, I have to show them my gratitude for the help on clearing my mind for few but valuable moments. In particular to Joana Mendes, who kindly forced me to have dinner (and cooked for me) when I was passing through the busiest times. Also, she always had a motivating word for me.
My sincere thanks to Cristina Dias from MDE group for the company, sympathy and for giving me the sentence “vai correr tudo bem” in the most difficult moments.
Also, I would like to thank Maria João Fonseca at CIBIO for the invitation to present the project of this work.
Finally, I would never be here presenting this work without the help of my parents and brother. They have always been there for me, even in the moments that I had not been present for them. Thank you, mom, dad and little brother.
Also, I will dedicate this work to my dear grandfather who recently passed away. We are always thinking that life of the closed ones will ends in another day, but at any moment we can be surprised.
Abstract
Worldwide consumption of fish per capita increased from 9.9 kg in the 1960s to 19.2 kg in 2012. With this increase in fish utilization, aquaculture emerged as an attractive alternative to intensive fishing and as a complementary strategy to capture fisheries. Consequently, aquaculture production recently surpassed capture fisheries, being responsible for nearly 50 percent of the world’s food fish supply.
The increase in aquaculture production led to the challenge of a sustainable development in this field, with special emphasis placed on reducing the environmental impacts of this practice.
Among the fish produced in aquaculture, gilthead seabream is one of the success stories, since it showed a rapid and high adaptability to the intensive rearing systems used. However, gilthead seabream farming is also affected by the main problems associated with aquaculture farming: disease prevention and control.
As a prevention measure, antibiotics were commonly used as growth promoters. However, this practice has been banned in Europe, leading to an increased interest in more sustainable alternatives for disease prevention, such as probiotics, prebiotics and synbiotics.
Bacillus subtilis and B. licheniformis are the most used probiotics in aquaculture.
Among these, B. licheniformis presents an ability to produce extracellular enzymes that are able to digest proteins and complex polysaccharides, conferring them a high potential to metabolize prebiotics.
Fructooligosaccharides (FOS) are a commonly used prebiotic in aquaculture and several microbial enzymes associated with its utilization have been reported to exist in known beneficial gut bacteria, namely Lactobacillus and Bifidobacterium species. On the other hand, the FOS effect in populations of Bacillus is poorly understood. To assess the effects of this relationship on the host, synbiotics approaches combining FOS with Bacillus strains reported several beneficial effects, such as increased disease resistance and improved growth.
Effects of probiotics, prebiotics or synbiotics are usually inferred through the effects observed on the host, namely growth, survival and immune response, or through
measurement of bacterial bioproducts. In order to screen the dynamics of B.
licheniformis populations directly in seabream gut, the development of improved
culture-independent detection methods is needed.
The present work aimed to establish quantitative real-time PCR (qPCR) as a routine method for bacterial quantification directly in environmental samples. To achieve this goal, specific DNA markers for B. licheniformis were selected using CUPID and Insignia bioinformatics tools. These utilities, combined with in silico genomic studies, have proved to be a reliable approach for selection of taxa-specific markers, since the DNA markers selected in this work were successfully applied for identification and detection of B. licheniformis.
To understand the dynamics of B. licheniformis populations in gilthead seabream gut, a qPCR based method, using the selected B. licheniformis specific markers, was developed taking into account several key steps for an accurate bacterial quantification.
Additionally, we also aimed to assess the ability of B. licheniformis to metabolize FOS within the gilthead seabream gut by feeding these fish with diets differently enriched with FOS. The results suggested that none of the diets were able to trigger the growth of B. licheniformis populations to values above the qPCR limit of quantification (LOQ), i.e. to allow reliable quantification. Consequently, determination of the ability of FOS to modulate B. licheniformis populations was not possible. Further optimization of the qPCR methodology is needed to reduce LOQ, allowing an accurate quantification of B. licheniformis population in environmental samples.
Regardless the current limitations, the novel DNA markers characterized in this work were shown to be reliable tools for culture-independent identification and detection of
B. licheniformis, allowing to monitor these bacteria in environmental samples, which we
believe to be a solid contribution to better understand their ecology.
Keywords: Bacillus licheniformis, taxa-specific DNA markers, CUPID, Insignia, qPCR
Resumo
O consumo mundial per capita de peixe aumentou de 9.9 kg nos anos 60 para 19.2 kg no ano de 2012. Com este aumento, a aquacultura surgiu como uma alternativa à pesca intensiva e como uma estratégia complementar para as pescas de captura, sendo, neste momento, responsável por quase 50 % do fornecimento mundial de peixe. O aumento da produção de peixe em aquacultura levou à necessidade do seu desenvolvimento sustentável, com especial ênfase para a redução dos impactos ambientais desta actividade.
Das diferentes espécies de peixes produzidos em aquacultura, a dourada revelou ser um dos casos de sucesso, pois mostrou uma rápida adaptação aos sistemas de criação intensiva. Contudo, a produção deste peixe nestes sistemas é afectada pelo maior problema associado à aquacultura: prevenção e controlo de doenças.
Os antibióticos foram tradicionalmente usados como promotores do crescimento. Porém, esta prática foi proibida na Europa, conduzindo a um maior interesse em alternativas mais sustentáveis para a prevenção de doenças, como os probióticos, prebióticos e sinbióticos.
Os probióticos mais usados em aquacultura são B. subtilis e B. licheniformis. Entre estes, o B. licheniformis apresenta uma grande capacidade para produzir enzimas extracelulares que são capazes de digerir proteínas e polissacarídeos, conferindo-lhes, desta forma, um grande potencial para metabolizar prebióticos.
Os frutooligossacarídeos (FOS) são prebióticos frequentemente utilizados em aquacultura e várias enzimas microbianas associadas com a sua metabolização foram descritas como sendo sintetizadas por conhecidos probióticos, nomeadamente as espécies de Lactobacillus e Bifidobacterium. No entanto, o efeito dos FOS nas populações de Bacillus continua pouco estudado. Para compreender os efeitos da interacção destes dois agentes no hospedeiro, os FOS combinados com estirpes de
Bacillus (sinbióticos) foram usados na alimentação de peixes, resultando em vários
efeitos benéficos, designadamente uma resistência a doenças melhorada e um maior crescimento do hospedeiro.
Os efeitos dos probióticos, prebióticos e sinbióticos são normalmente inferidos através de efeitos observados no hospedeiro, mais especificamente, através do
crescimento, da sobrevivência e da resposta imunitária destes, ou, por outro lado, através da medição de bioprodutos bacterianos. De modo a compreender a dinâmica de populações de B. licheniformis no intestino da dourada, é necessário o desenvolvimento e melhoramento de métodos de detecção independentes do isolamento em meio de cultura.
O presente trabalho teve como objectivo estabelecer qPCR como um método de rotina para quantificação directa de bactérias em amostras ambientais. Para atingir este objectivo, foram seleccionados marcadores de DNA específicos para B.
licheniformis, usando as ferramentas bioinformáticas CUPID e Insignia. Estes recursos
combinados com estudos genómicos realizados in silico, provaram ser uma metodologia adequada para a selecção de marcadores específicos, na medida em que os marcadores de DNA seleccionados foram aplicados com sucesso para a identificação e detecção de B. licheniformis.
Para determinar a dinâmica das populações de B. licheniformis no intestino da dourada e tendo em conta vários passos-chave para uma adequada quantificação bacteriana, foi desenvolvido um método de qPCR, utilizando os marcadores específicos de B. licheniformis.
Adicionalmente, tivemos também como objectivo determinar a capacidade de B.
licheniformis para metabolizar FOS no interior do intestino da dourada, através da
alimentação destes peixes com dietas diferencialmente suplementadas com FOS. Os resultados sugerem que nenhuma das dietas aplicadas foi capaz de favorecer a multiplicação de B. licheniformis para valores acima do limite de quantificação (LOQ) do qPCR, i.e. que permitissem uma quantificação consistente. Em consequência, a capacidade de B. licheniformis para metabolizar FOS não foi possível de determinar. A optimização do qPCR poderá levar à redução do LOQ desta técnica, permitido uma correcta quantificação da população de B. licheniformis nas amostras ambientais.
Independentemente das presentes limitações, os novos marcadores de DNA caracterizados neste trabalho mostraram ser ferramentas adequadas para a identificação e detecção de B. licheniformis usando métodos independentes do isolamento em meio de cultura. Esta abordagem permitiu monitorizar estas bactérias em amostras ambientais, o que a nosso ver é uma contribuição sólida para um melhor entendimento da ecologia de B. licheniformis.
Palavras-chave: Bacillus licheniformis, marcadores de DNA, CUPID, Insignia, qPCR.
Table of Contents
Acknowledgments ... 7 Abstract ... 9 Resumo ... 11 List of Tables ... 15 List of Figures ... 16 List of Attachments ... 17 List of Abbreviations ... 19 1. Introduction ... 212. Material and Methods ... 31
2.1 Bacterial strains and DNA extraction ... 31
2.2 Identification of bacterial isolates ... 32
2.3 In silico selection of DNA markers ... 33
2.4 In silico analyses of DNA markers ... 34
2.5 Experimental validation of selected markers ... 35
2.6 Feeding trial ... 35
2.6.1 Diets ... 35
2.6.2 Growth Trial ... 37
2.7 DNA extraction from faecal samples ... 37
2.8 B. licheniformis detection in digesta samples ... 38
2.9 Multiplex PCR for identification of B. licheniformis ... 38
2.10 qPCR for B. licheniformis quantification in digesta samples ... 38
3. Results ... 43
3.1 Identification of bacterial isolates through 16S rRNA gene sequencing ... 43
3.2 Taxa-specific regions and DNA markers ... 44
3.3 In silico analyses of DNA markers ... 45
3.4 Experimental validation of B. licheniformis species-specific DNA markers ... 47
3.5 Detection of B. licheniformis in faecal samples ... 48
3.6 Identification of B. licheniformis isolates through Multiplex PCR ... 49
3.7 B. licheniformis quantification using qPCR ... 51
4. Discussion ... 59
References ... 69 Attachments ... 83
List of Tables
Table 1 ... 32 Table 2 ... 36 Table 3 ... 43 Table 4 ... 45 Table 5 ... 46 Table 6 ... 54 Table 7 ... 54List of Figures
Figure 1... 21 Figure 2... 22 Figure 3... 23 Figure 4... 33 Figure 5... 39 Figure 6... 46 Figure 7... 47 Figure 8... 48 Figure 9... 49 Figure 10 ... 50 Figure 11 ... 50 Figure 12 ... 51 Figure 13 ... 51 Figure 14 ... 52 Figure 15 ... 53 Figure 16 ... 55 Figure 17 ... 56 Figure 18 ... 57List of Attachments
Attachment I ... 83 Attachment II ... 85 Attachment III ... 88 Attachment IV ... 90 Attachment V... 91List of Abbreviations
ATCC – American Type Culture Collection ATP – Adenosine triphospate
AXOS – Arabinoxylooligosaccharides
BCCM – Belgian Coordinated Collections of Microorganisms BGSC – Bacillus Genetic Stock Center
BLAST – Basic Local Alignment Search Tool CAI – Codon Adaptation Index
CFU – Colony-forming unit
CIBIO – Centro de Investigação em Biodiversidade e Recursos Genéticos CIIMAR – Centro Interdisciplinar de Investigação Marinha e Ambiental Cq(s) – Quantification cycle(s)
CUPID – Core and Unique Protein Identification
DGRM – Direção-Geral de Recursos Naturais, Segurança e Serviços Marítimos DNA – Deoxyribonucleic acid
dNTP – Deoxynucleoside triphosphate EC – Enzyme Commission number eCAI – Expected Codon Adaptation Index EU – European Union
FAO – Food and Agriculture Organization
FCUP – Faculdade de Ciências da Universidade do Porto FOS – Fructooligosaccharides
GC content – Percentage of guanine or cytosine bases GOS – Galactooligosaccharides
HK(s) – Housekeeping gene(s) IMO – Isomaltooligosaccharides IPC – Internal Positive Control IS – Insertion elements
LB – Luria-Bertani medium LOQ – Limit of quantification
MDE – Microbial Diversity and Evolution group MLST – Multilocus sequence typing
MOS – Mannanoligosaccharides
MRS – Man, Rogosa and Sharp medium NA – Nutrient Agar
NCBI – National Center for Biotechnology Information NTC – Non-Template Control
NUTRIMU – Fish Nutrition and Immunobiology group ORF(s) – Open Reading Frame(s)
PCR – Polymerase Chain Reaction
qPCR – Quantitative Real-Time Polymerase Chain Reaction RDP – Ribossomal Database Project
rRNA – Ribosomal ribonucleic acid SCFAS – Short-chain fatty acids
scFOS – Short-chain fructooligosaccharides SMS – Sequence Manipulation Suite SPC(s) – Sample Processing Control(s) tRNAs – Transfer ribonucleic acids UniProt – Universal protein resource VBNC – Viable but nonculturable bacteria WGS – Whole-genome shotgun contigs WHO – World Health Organization XOS – Xylooligosaccharides
1. Introduction
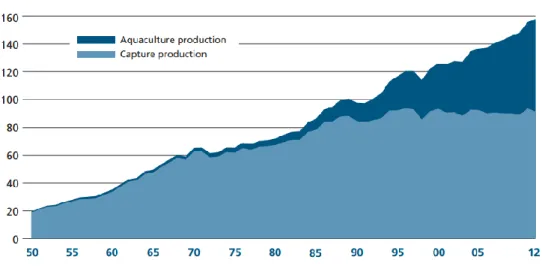
The steady increase of world population is directly tied to a higher exploitation of all kind of food sources. In what concerns the average of fish utilization, worldwide consumption per capita increased from 9.9 kg in the 1960s to 19.2 kg in 2012 (Fig. 1) (FAO, 2014a). For many decades, capture fisheries were the main strategy adopted for fish supply. With the increase in population and consequently the increase in fish utilization, it was clear that capture fisheries were not able to supply all the required fish, unless an intensive fishing strategy was applied. This measure is however associated with several potential negative environmental impacts, namely changes within ecosystems biodiversity (FAO, 2014b).
Fig. 1 – World fish utilization and supply (FAO, 2014a).
Around the 1970s, aquaculture, which is defined as the farming of aquatic organisms either in coastal or inland areas, including interventions in the rearing process to enhance production (FAO, 2014c), emerged as an alternative to intensive fishing and as a complementary strategy to capture fisheries. Presently, aquaculture production is considered the fastest growing food-production sector (Fig. 2), accounting for nearly 50 percent of the world’s food fish supply (FAO, 2014d).
Fig. 2 – World capture fisheries and aquaculture production (FAO, 2014a).
The increase in aquaculture production led to the challenge of a sustainable development in this field. The major concerns of past, present and future decades are to reduce the environmental impacts of aquaculture and also avoid impacts on aquaculture arising from non-aquaculture activities (FAO, 2014e). Consequently, new measures were suggested and implemented as integrated aquaculture-agriculture farming systems, which have been applied, for instance, in Asia, where certain species of fish are used to fight golden snail rice pest. This approach allows simultaneously to boost rice yields and to harvest fish (FAO, 2014f).
Other concerns under study are the introduction of new species into aquaculture systems, the development of new production technologies, implementation of efficient diets and disease control. Also, the aquaculture licensing process is in most cases the biggest impediment to the expansion of this sector. In order to simplify this step, responsible organizations are pre-defining production areas, where species and respective densities are already defined (Framian, 2009).
Several organizations are involved in the regulation and improvement of aquaculture practices, as the Food and Agriculture Organization of the United Nations (FAO) that works at an international level (FAO, 2014g). In Europe, Aquaculture is also regulated by the European Commission (European Commission, 2014) and in Portugal, the government entity that is mainly responsible for aquaculture regulation is the Direção-Geral de Recursos Naturais, Segurança e Serviços Marítimos (DGRM).
According to the DGRM (2014), the main aquaculture species produced in Portugal are rainbow trout (Oncorhynchus mykiss), brown trout (Salmo trutta), clam (Ruditapes
(Sepia officinalis), eel (Anguilla anguilla), sole (Solea spp.), pod razor (Pharus
legumen), sword razor (Ensis spp.), mussel (Mytilus spp.), Portuguese cupped oyster
(Crassostrea spp.), cupped oyster (Ostrea spp.), turbot (Psetta maxima), seabass (Dicentrarchus labrax), white seabream (Diplodus sargus), mullet (Mugil spp./Liza spp.) and gilthead seabream (Sparus aurata). Among these, gilthead seabream (or only seabream) represents one of the success stories in aquaculture. Initially, seabream was extensively cultured in its natural habitat until the 1980s, when intensive rearing systems were developed and seabream quickly showed a high adaptability to these systems (FAO, 2014h).
Gilthead seabream is a benthopelagic fish of both marine and brackishwater environments, such as coastal lagoons and estuarine areas (FAO, 2014h, 2014i; FishBase, 2014). The seabream worldwide distribution (Fig. 3) is restricted to Mediterranean Sea, Atlantic Ocean from British Isles to Cape Verde, and rarely in Black Sea (FAO, 2014i, 2014j; FishBase, 2014).
Fig. 3 –Gilthead seabream world distribution (FAO, 2014j).
The main problems associated with aquaculture farming are disease prevention and control, and seabream farming is not an exception (FAO, 2014h). Intensive fish farming systems, which resulted from enhanced need of fish supply, have been responsible for the emergence of several bacterial diseases mainly due to the physiologically stressed and/or immune suppressed state of intensively farmed fish. Under these conditions,
opportunistic pathogens are able to colonize fish, causing disease and, consequently, leading to a higher use of antibiotics (Alderman and Hastings, 1998; Barton and Ywama, 1991; Naylor and Burke, 2005; Walker, 2004), not only for therapeutic reasons, but also as a metaphylactic or prophylactic measure (Romero et al., 2012).
Use of antimicrobial drugs in aquaculture exerts selective pressure on pathogens, as well as on environmental bacteria and beneficial microbiota, selecting for antibiotic resistant bacteria. Moreover, fish absorption of antibiotics is low and 70 to 80% of administered antibiotics are released to the aquatic environment (Martinsen and Horsberg, 1995; Samuelsen, 2006; Smith and Samuelsen, 1996), where they have been associated with an increased number of antibiotic resistant bacteria (Huys et al., 2000; Miranda and Zemelman, 2002a, 2002b; Schmidt et al., 2000, 2001a, 2001b). Also, the excessive use of antibiotics led to the presence of residual levels of antibiotics in food products from aquaculture, which may induce changes in consumers’ microbiota (Angulo et al., 2004; Goldburg et al., 2001; Grave et al., 1996, 1999).
Antibiotic resistance genes can be located in mobile genetic elements, such as plasmids and transposable elements. Therefore, genes conferring antibiotic resistance can be transferred between bacteria through lateral DNA transfer, namely by transformation (uptake of foreign environmental DNA), conjugation (uptake of genes through cell-to-cell contact) and transduction (uptake of genes through an infection with viral DNA). Interestingly, transduction may play an important role in aquaculture as a trait of gene transfer, once high concentrations of bacteria are present in seawater and marine sediment, where viruses are also abundant (Fuhrman, 1999). Additionally, gene transfer was reported not only between aquatic bacteria but also between aquatic and terrestrial bacteria (Agersø and Guardabassi, 2005; Casas et al., 2005; Fuhrman, 1999), representing a major threat to human health, since transfer of antibiotic resistance genes to human pathogens was already reported (Angulo, 2000; Weber et al., 1994).
Recently, the use of antibiotics as growth promoters has been banned in Europe (EU Regulation no. 1831/2003), which led to an increased interest in sustainable alternatives. Phage therapy, growth and virulence inhibition, green water, probiotics (Defoirdt et al., 2007), prebiotics and synbiotics (Gibson and Roberfroid, 1995) are all disease preventive measures that were targeted for study as alternatives to the prophylactic use of antibiotics.
According to FAO/WHO recommendations, probiotics are defined as “live microorganisms which when administered in adequate amounts confer a health benefit
on the host” (Araya et al., 2002). Historically, the first report of what we known today as probiotics is attributed to Metchnikoff (1907), which noted that ingestion of fermented milk products containing microorganisms was responsible for health beneficial effects.
Bacillus strains have been used for decades as probiotics. An example is a probiotic
containing Bacillus clausii spores named Enterogermina®, which was registered in 1958 in Italy (Cutting, 2011). Bacillus spp. are gram-positive, aerobic and endospore-forming microorganisms whose spores are able to survive extreme environmental conditions. From a probiotic point of view, production of spores represent a major advantage over other non-spore formers probiotics, since this trait confers a longer storage life (Cutting, 2011) and a cheaper cost of probiotic production (Wang et al., 2008). Also, spores survives passage through the upper gastrointestinal tract with low pH (Barbosa et al., 2005; Spinosa et al., 2000), which allows bacteria to reach the small intestine where they exert their probiotic effect. However, selection of Bacillus strains for probiotics must be a meticulous and rigorous process, since some strains used as probiotics have also been reported as carriers of multidrug resistance and toxin genes (Duc et al., 2004; Hoa et al., 2000).
In aquaculture, Bacillus probiotics have been associated with competitive exclusion events, i.e. the decrease of pathogens caused by the increasing of beneficial bacteria, in white shrimp (Li et al., 2007), stimulation of seabream immunesystem (Salinas et al., 2005, 2008), improved water quality by decreasing the pathogenic population in water (Dalmin et al., 2001; Decamp et al., 2008; Moriarty, 1998; Vaseeharan and Ramasamy, 2003) and increased survival of black tiger shrimp (Rengpipat et al., 1998, 2003). These bacteria have been also reported as promoters of seabream larvae growth, which showed increased body weight and standard length. These later observations have been related with the release of digestive enzymes by Bacillus strains (Avella et al., 2010), which may lead to an improved digestion by the host (Bagheri et al., 2008; Ghosh et al., 2002; Nagano and To, 1999; Ziaei-Nejad et al., 2006) or to an additional provision of essential nutrients (Verschuere et al., 2000).
B. subtilis and B. licheniformis are the most used probiotics in aquaculture (Moriarty,
2003). Concerning B. licheniformis, when administered with other Bacillus strains, namely B. subtilis and Bacillus pumilus, an increased growth and immune resistance was observed in rainbow trout (Bagheri et al., 2008; Raida et al., 2003). An enhanced immune response was also detected in white shrimp culture, when B. licheniformis was the only administered probiotic (Li et al., 2007).
B. licheniformis, which is one of the better defined Bacillus species, is an ubiquitous,
facultatively anaerobic and endospore-forming bacterium. B. licheniformis is also saprophytic, producing extracellular proteases and other enzymes that are able to digest complex polysaccharides (Claus and Berkeley, 1986). The enzyme production ability makes these bacteria an interesting target for prebiotics, which have been defined as “a non-digestible food ingredient that beneficially affects the host by selectively stimulating the growth and/or activity of one or limited number of bacteria in the colon” (Gibson and Roberfroid, 1995).
Increased interest in prebiotics emerged due to limitations of probiotics application, namely high cost, possible environmental impacts and regulatory issues, as well as the difficult maintenance of a constant level of probiotics in fish feeds and the decreasing viability of most probiotic strains during preparation and storage (Dimitroglou et al., 2011; Ringø et al., 2010).
The mechanism of action of prebiotics, which are not digested by the host, consists in a stimulation of activity and growth of beneficial gut bacteria, leading to an increased production of short-chain fatty acids (SCFAs) that consequently decreases pH. A low pH may promote a higher growth of probiotic bacteria and also suppress undesirable bacteria (Blaut, 2002). Additionally, Blaut (2002) have hypothesized that SCFAs may play an important role for the host by leading to an optimal functioning of the intestinal epithelium and higher absorption of several important cations, such as Ca2+, Mg2+ and Fe 2+.
Several prebiotics have already been applied in aquaculture practices, namely inulin, GroBiotic®-A, mannanoligosaccharides (MOS), galactooligosaccharides (GOS), xylooligosaccharides (XOS), arabinoxylooligosaccharides (AXOS), isomaltooligosaccharides (IMO), fructooligosaccharides (FOS) and short-chain fructooligosaccharides (scFOS) (Ringø et al., 2010). A well-known and widely used prebiotic is FOS, which have several microbial enzymes associated with its microbial utilization, specifically fructosidase EC 3.2.1.26 (Barrangou et al., 2003; Goh et al., 2006, 2007), inulinase EC 3.2.1.7 (Mckellar and Modler, 1989; Xiao et al., 1989), levanase EC 3.2.1.65 (Menéndez et al., 2002), fructofuranosidase EC 3.2.1.26 (Rossi et al., 2005; Saulnier et al., 2007), fructanase EC3.2.1.80 (Hartemink et al., 1995) and levan biohydrolase EC 3.2.1.64 (Saito et al., 2000; Song et al., 2002). This apparent diversity of enzymes masks the fact that these are all functionally related, since they are involved in the hydrolysis of β-D-fructosidic linkages, releasing fructose. Also, they share the conserved motif H-x(2)-P-x(4)-[LIVM]-N-D-P-N-G. Therefore, Naumoff (2001)
suggested that these enzymes should be considered as members of the same β-fructosidase superfamily.
FOS digestion has been associated with bacterial growth and activity of
Lactobacillus and Bifidobacterium strains (Buddington et al., 1996; Gibson et al., 1995;
Williams et al., 1994), providing selective advantages to these beneficial gut bacteria, particularly by leading to the suppress of undesirable bacteria (Buddington et al., 2002). Nevertheless, the influence of FOS on gut native Bacillus strains remains poorly understood. Mahious et al. (2006) reported that Raftilose P95, which is a mixture of inulin and FOS, was able to increase weaning turbot growth, as well as the gut bacterial diversity and the emergence of Bacillus spp. as cultivable bacteria. These authors suggested that microbiota diversity and Bacillus spp. predominance might be responsible for the increased growth of the fish.
Furthermore, recent studies used Bacillus strains combined with FOS, which is denominated as a synbiotic approach i.e. synergistic combinations of probiotics and prebiotics (de Vrese and Schrezenmeir, 2008), to improve aquaculture production.
Zhang et al. (2010) reported improved disease resistance through an enhanced immunity of sea cucumber when B. subtilis was administered with FOS. Sun and co-workers (2011) also provided B. subtilis and FOS to sea cucumber and observed an improved immunity response and growth. In triangular bream, administration of B.
licheniformis along with FOS led to an increased disease resistance, as well as to an
enhanced innate immunity and antioxidant capability (Zhang et al., 2013).
Synbiotic approaches have a great potential not only in aquaculture but also in livestock and human health, as a paradigm to conciliate a specific prebiotic with the most suitable probiotic. This will increase probiotic survival (Collins and Gibson, 1999) and persistence in the gut (Rastall and Maitin, 2002), resulting in advantages for the host, which are related to the type of prebiotics and probiotics administered (Collins and Gibson, 1999).
Effects of probiotics, prebiotics or synbiotics are usually inferred through the effects observed on the host, namely growth, survival and immune response, or through measurement of bacterial bioproducts as SFCAs and enzymes. When a direct study of colonization is carried out, the employed methods are the same as the ones used for bacterial detection (Balcázar et al., 2006). Traditionally, bacterial screening is performed through culture, serological, immunological and histological methods. Recently, molecular techniques, such as immunohistochemical tests, restriction enzyme digestion, probe hybridization, polymerase chain reaction (PCR) have been
recurrently applied for bacterial detection (Balcázar et al., 2006; Cunningham, 2002). All molecular approaches mentioned are able to detect the microbes present in a sample without bacterial culture, which is a major advantage since only a very small percentage of microorganisms are cultivable using the currently available culture media (Amann, 2000; Amann et al., 1995). Even though these methods are reliable tools for detection of bacteria, they are not able to quantify the amount of each taxon in a sample. Bacterial quantification is useful to understand microbial dynamics and modulation ability, when different treatments are applied as in the case of probiotics, prebiotics or synbiotics administration. On this scope, qPCR has been used for direct bacterial quantification using DNA extracted from environmental or clinical samples, including faecal samples to study the gut microbiota. The majority of these studies have been focused in humans (Centanni et al., 2013; Furet et al., 2009; Haarman and Knol, 2005; Jost et al., 2012, 2014; Larsen et al., 2010; Mariat et al., 2009; Menard et al., 2008), however when another model of study is considered the information is scarce. Also, most of these studies have used primers for amplification of 16S rRNA gene, which can be a bias due to the existence of multiple copies of this gene in a genome (Lee et al., 2008), high similarity between sequences from closely related strains and intragenomic variability (Michon et al., 2010). Currently, there are several bioinformatics tools that allow to select novel taxa-specific DNA markers, which can help to overcome this limitation (Albuquerque et al., 2009), such as CUPID (Core and Unique Protein Identification) (Mazumder et al., 2005) and Insignia (Phillippy et al., 2009), which provide taxa-specific proteins and taxa-specific DNA regions, respectively.
Specific DNA regions have been designated as DNA signatures, which, as proposed by Phillippy and collaborators (2007), are defined as “nucleotide sequences that can be used to detect the presence of an organism and to distinguish that organism from all other species” or as taxa-specific DNA markers. Recently, Albuquerque et al. (2011, 2012a, 2012b) showed that DNA signatures obtained with CUPID and Insignia are a reliable tool for bacterial detection. Therefore, specific DNA markers can be used as targets for qPCR, conferring several advantages over approaches targeting 16S rRNA, since the DNA signatures obtained can be present as single-copy in the genomes.
Presently, studies targeting bacterial quantification in fish microbiota are not yet reported. In fish farming, bacterial quantification using qPCR can be a powerful tool to assess the effectiveness of different treatments aimed to improve aquaculture
production quality, through the analysis of probiotics dynamics in fish gut microflora, such as Bacillus spp.
The present work aimed at the development of improved culture-independent methods able to screen the dynamics of B. licheniformis strains in seabream gut. For this purpose, an in silico analysis was carried out to identify novel taxa-specific DNA markers for B. licheniformis, which allow identification, detection and quantification of these strains.
The selected markers were designed in order to directly monitor B. licheniformis strains in gut samples using traditional, multiplex and quantitative PCR, allowing to surpass the bias usually associated with culture dependent approaches, such as inability to detect viable but nonculturable microorganisms (VBNC), low specificity and detection resolution. Importantly, this work aimed to establish qPCR as a reliable culture-independent method for bacterial quantification directly in environmental samples.
Beyond the optimization of a method to trace and quantify B. licheniformis in the gut, we aimed to assess the ability of B. licheniformis to metabolize FOS within the seabream gut by feeding these fish with diets differently enriched with FOS and, consequently, assessing the putative prebiotic activity of these dietary components on this bacteriumi.e. the FOS ability to modulate B. licheniformis populations.
2. Material and Methods
2.1. Bacterial strains and DNA extraction
The majority of bacterial strains used in this work are from the Microbial Diversity and Evolution (MDE; CIBIO) and Fish Nutrition and Immunobiology (NUTRIMU; FCUP/CIIMAR) bacterial collections. These strains were isolated from gut of different fish (turbot, gilthead seabream and European seabass) in different experiences, which are summarized in Table 1. Briefly, approximately 300 mg of each faecal sample was suspended in 2 mL of peptone water, vortexed thoroughly and left for debris sedimentation. Faecal suspensions from turbot and seabream were 10-fold serially diluted in peptone water and 100 µL from each dilution was plated on Man, Rogosa and Sharp (MRS; Liofilchem, Italy) or Nutrient Agar (NA; Liofilchem) in the case of turbot samples, or only in NA (Liofilchem) in the case of seabream samples. Plates were incubated at 25 ºC and 30 ºC, respectively. To select for the bacterial population of spore formers such as Bacillus spp., faecal suspensions from European seabass were initially diluted 1:1 in ethanol and peptone water. Ethanol treated suspensions were agitated for 45 min (Sample treatment E – Table 1), while the peptone water suspensions were heat treated at 65 ºC for 30 min (Sample treatment H – Table 1). After treatments, both suspensions were 10-fold diluted in peptone water. From each dilution, 100 µL were plated onto NA (Liofilchem) and incubated at 30 ºC. All plates were incubated from 5 to 7 days.
B. licheniformis 9945A, Bacillus subtilis 168, Bacillus pumilus ATCC_7061 and Bacillus megaterium ATCC_19213 from Bacillus Genetic Stock Center (BGSC)
bacterial collection, as well as Bacillus sonorensis LMG_21636, Bacillus
amyloliquefaciens LMG_9814 and Bacillus atrophaeus LMG_16797 from Belgian
Coordinated Collections of Microorganisms/LMG (BCCM/LMG) bacterial collection, were also used in this work.
All strains were grown overnight on Luria-Bertani Medium (LB; AppliChem, Germany) at 37 ºC. DNA from these cultures was extracted using the EZNA Bacterial DNA Purification Kit (Omega Bio-Tek, USA), following manufacturer’s instructions, and
DNA quantification was carried out using Qubit 2.0 Fluorometer and Qubit dsDNA HS Assay (Invitrogen, USA).
Table 1 - Bacterial isolates from MDE and NUTRIMU groups collections used in this work. Isolate aSample Treatment Culture conditions for isolation Host fish species
FI1 n/a MRS, 25 ºC Turbot (Scophthalmus maximus) FI2 FI3 FI11 NA, 25 ºC FI34
n/a NA, 30 ºC Gilthead seabream
(Sparus aurata) FI35 FI38 FI39 FI40 FI42 FI44 FI46 FI47 FI94 H NA, 37 ºC European seabass (Dicentrarchus labrax) FI105 H FI120 E FI132 H FI136 H FI139 E FI141 E FI144 H FI152 H FI157 E FI159 E FI242 E FI268 E FI282 E
a Sample treatment: n/a – not applied; E – ethanol treatment; H – heat treatment.
2.2. Identification of bacterial isolates
Bacterial isolates obtained from fish gut were identified by 16S rRNA gene sequencing. PCR amplification using primers 27F and 1492R (Lane, 1991) was carried out in 20 µL PCR reactions containing 1 x DreamTaq Buffer (Thermo Scientific,
Germany), 0.2 mM of each deoxynucleoside triphosphate (dNTP) (Thermo Scientific), 0.2 μM of each primer (STAB Vida, Portugal), 1 U of DreamTaq DNA Polymerase (Thermo Scientific) and 25 ng of DNA template. The PCR program consisted of 5 min initial denaturing at 95 ºC, 35 cycles of 30 s denaturing at 95 ºC, 30 s annealing at 55 ºC and 90 s extension at 72º C; and 10 min final extension at 72 ºC. PCR products were separated on 1 % agarose (Invitrogen) gels stained with GelRed (Biotium, USA). Gel electrophoresis was carried out at 80 V until the Orange G front is within 1 cm of the end of the gel.
Amplicons were purified from agarose gels or from PCR reactions using the GFX PCR DNA and Gel Band Purification kit (GE Healthcare, United Kingdom) and sent for sequencing at STAB Vida. Isolates were presumptively identified to the species level using BLAST analysis and the Ribosomal Database Project (RDP).
2.3. In silico selection of DNA markers
Taxa-specific regions for B. licheniformis were retrieved according to two flowcharts for selection of specific DNA markers, which were adapted from Albuquerque and collaborators (2012b) and represented in Fig. 4 (Flowcharts 1 and 2).
Following Flowchart 1, the online databases CUPID (Mazumder et al., 2005) and Insignia (Phillippy et al., 2009) were used to respectively list the specific proteins and DNA signatures of B. licheniformis ATCC_14580, which was the strain used as reference. The outputs of both databases were overlapped using a C+.program (Albuquerque et al., 2012b).
Flowchart 2 was followed in parallel due to the low number of strains available for analysis in CUPID. In this approach, only the primary outputs from Insignia were accounted for analysis using B. licheniformis DSM_13 as the reference strain. In order to consider only putative coding regions, the output from Insignia was overlapped with the complete protein list of strain DSM_13, obtained from NCBI. In both approaches, signature length was set to a minimum of 99 bp in Insignia.
The most promising DNA signatures were selected through a robust BLAST (Basic Local Alignment Search Tool) analysis, using the nucleotide collection (nr/nt) and whole-genome shotgun contigs (wgs) databases (Altschul et al., 1990). BLAST thresholds were applied according to Albuquerque et al. (2012b) to guarantee the selection of significant blast hits. Primer design for the specific regions was carried out using the Vector NTI software (Invitrogen) and the predicted amplicons were again submitted to a BLAST analysis to ensure the specificity of the selected markers.
2.4. In silico analyses of DNA markers
To assess the putative stability and origin of the selected DNA regions, the location of each marker was determined in relation to several genomic mobilization-related features. Using Geneious R7 v7.1.7 (Biomatters, New Zealand), the circular chromosome of B. licheniformis ATCC_14580 was used to pinpoint elements associated with genomic mobility, namely phage related ORFs, insertion elements (IS), recombinases, integrases, transposases and tRNAs (Albuquerque et al., 2012a). The codon adaptation index (CAI), the expected CAI (eCAI) and the GC content of each ORF containing the selected markers were calculated using the CAIcaI sever (Puigbò et al., 2008). For comparison, these parameters were also calculated for six housekeeping genes (HKs) used for Multilocus Sequence Typing (MLST) of B.
licheniformis: adk, ccpA, recF, rpoB, spo0A and sucC (Madslien et al., 2012).
Synteny plots comparing the genome of B. licheniformis type strain ATCC_14580 and two other fully sequenced B. licheniformis strains (DSM_13 and 9945A) were obtained using SynMap (Lyons et al., 2008). High resolution synteny analysis of the
regions containing the selected markers was carried out using the GEvo tool (Lyons and Freeling, 2008).
2.5. Experimental validation of selected markers
The specificity and stability of selected DNA markers was experimentally assessed by PCR, which was prepared as mentioned in section 2.2., using an annealing temperature of 59 ºC. The bacterial collection strain B. licheniformis 9945A and B.
licheniformis strains previously isolated from fish (FI1, FI2, FI3 and FI11) were used as
positive controls. Closely related strains, namely Bacillus sonorensis LMG_21636,
Bacillus subtilis 168, Bacillus amyloliquefaciens LMG_9814, Bacillus atrophaeus
LMG_16797, Bacillus pumilus ATCC_7061 and Bacillus megaterium ATCC_19213 were used as negative controls.
PCR products were separated on 2 % agarose (Invitrogen) gels stained with GelRed (Biotium). Gel electrophoresis was carried out as described in section 2.2. and amplicons were purified using the GFX PCR DNA and Gel Band Purification kit (GE Healthcare), according to the manufacturer’s instructions. To confirm the identity of the markers, the purified amplicons were sequenced at STAB Vida and the obtained sequences were aligned using Geneious R7.
2.6. Feeding Trial (in collaboration with NUTRIMU group)
2.6.1. Diets
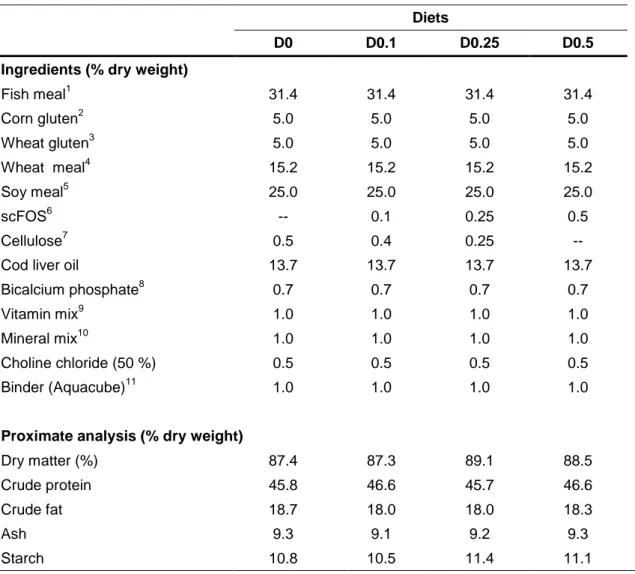
Four isolipid (18 % lipid) and isonitrogenous (45 % protein) diets were formulated in order to meet seabream nutritional requirements. At a ratio of 50:50, plant ingredients (soybean and wheat meal; corn and wheat gluten) and fish meal were used as the main protein sources, and fish oil was used as the lipid source. The experimental diets were differently enriched with short-chain fructooligosaccharides (scFOS; PROFEED Maxflow, France): diet D0 with 0 % (control diet), D0.1 with 0.1 %, D0.25 with 0.25 % and D0.5 with 0.5 % scFOS.
All ingredients were mixed and dry pelleted in a laboratory pellet mill (California Pellet Mill, USA), using a 2.0 mm die. Pellets were dried in an oven at 40 ºC during 48 h and stored in airtight bags until use (Guerreiro, 2013). Ingredients and proximate composition of diets are presented in Table 2.
Table 2 - Ingredients and proximate composition of the experimental diets (Guerreiro,
unpublished work).
Diets
D0 D0.1 D0.25 D0.5 Ingredients (% dry weight)
Fish meal1 31.4 31.4 31.4 31.4 Corn gluten2 5.0 5.0 5.0 5.0 Wheat gluten3 5.0 5.0 5.0 5.0 Wheat meal4 15.2 15.2 15.2 15.2 Soy meal5 25.0 25.0 25.0 25.0 scFOS6 -- 0.1 0.25 0.5 Cellulose7 0.5 0.4 0.25 --
Cod liver oil 13.7 13.7 13.7 13.7
Bicalcium phosphate8 0.7 0.7 0.7 0.7
Vitamin mix9 1.0 1.0 1.0 1.0
Mineral mix10 1.0 1.0 1.0 1.0
Choline chloride (50 %) 0.5 0.5 0.5 0.5
Binder (Aquacube)11 1.0 1.0 1.0 1.0
Proximate analysis (% dry weight)
Dry matter (%) 87.4 87.3 89.1 88.5 Crude protein 45.8 46.6 45.7 46.6 Crude fat 18.7 18.0 18.0 18.3 Ash 9.3 9.1 9.2 9.3 Starch 10.8 10.5 11.4 11.1 1
Steam Dried LT fish meal, Pesquera Diamante, Austral Group, S.A. Perú (CP: 71.7 % DM; CF: 9.5 % DM).
2
Sorgal, S.A. Ovar, Portugal (CP: 72.2 % DM; CF: 2.0 % DM).
3
Sorgal, S.A. Ovar, Portugal (CP: 84.4 % DM; CF: 1.8 % DM).
4
Sorgal, S.A. Ovar, Portugal (CP: 14.1 % DM; CF: 3.2 % DM).
5
Sorgal, S.A. Ovar, Portugal (CP: 50.2 % DM; CF: 2.4 % DM).
6 PROFEED Maxflow “Fructo-Oligosaccharides” (Jefo, France). 7
Sigma-Aldrich, Portugal.
8
Premix, Portugal (Calcium: 24 %; Total phosphorus: 18 %).
9
Vitamins (mg kg-1 diet): retinol acetate, 18000 (IU kg-1 diet); cholecalciferol, 2000 (IU kg-1diet); alpha tocopherol acetate, 35; sodium menadione bisulphate, 10; thiamin-HCl, 15; riboflavin, 25; calcium pantothenate, 50; nicotinic acid, 200; pyridoxine HCl, 5; folic acid, 10; cyanocobalamin, 0.02; biotin, 1.5; ascorbic acid, 50; inositol, 400.
10
Minerals (mg kg-1diet): cobalt sulphate, 1.91; copper sulphate, 19.6; iron sulphate, 200; sodium fluoride, 2.21; potassium iodide, 0.78; magnesium oxide, 830; manganese oxide, 26; sodiumselenite. 0.66; zinc oxide, 37.5; dibasic calcium phosphate, 5.93 (g kg-1diet); potassium chloride, 1.15 (g kg
-1
diet); sodium chloride, 0.40 (g kg-1diet).
11
2.6.2. Growth Trial
Gilthead seabream juveniles were obtained from a commercial fish farm (Maresa, S.A., Spain), kept in quarantine for one month and transferred to the experimental systems 15 days before the beginning of the trial, to allow fish adaptation to the experimental conditions. During those periods, fish were fed with a commercial diet containing 50 % protein and 12 % lipids.
The trial was carried out in a recirculating water system comprising 12 cylindrical fiberglass tanks of 100 L water capacity, at the experimental facilities of the Marine Zoology Station, Porto University, Portugal. A continuous flow of filtered seawater (2.5 – 3.5 L min-1
) with 35 ± 1 g L-1 salinity was used to supply tanks, which were thermo-regulated to 25.0 ± 0.6 ºC. Water dissolved oxygen levels were maintained near saturation (7 mg L-1) using aeration.
Twenty two gilthead seabream, with an initial mean body weight of 32.0 ± 0.01 g, were distributed to each tank. Diets were randomly attributed to triplicate groups of fish. The trial lasted eight weeks, during which fish were hand-fed, until apparent visual satiation, twice a day, six days a week. At the end of the trial, fish were sacrificed for collection, under aseptic conditions, of mucosa and digesta samples to assess the autochthonous and allochthonous microbiota, respectively. Samples collected from each tank were pooled into one sample to overtake inter-fish variation.
The entire experiment was executed by accredited scientists, according FELASA category C recommendations and to the European Union directive 2010/63/EU on the protection of animals used for scientific purposes.
2.7. DNA extraction from faecal samples
DNA extraction from faecal samples was performed according to Pitcher et al. (1989) with some modifications. Briefly, approximately 300 mg of intestinal content were ressuspended in 1 mL of TE buffer and centrifuged at 13000 g for 5 min. The supernatant was discarded and the pellet was ressuspended in 200 µL of TE containing 50 mg/mL of lysozyme and incubated for 30 min at 37 ºC. Cell lysis was carried out by adding 500 µL GES reagent (Pitcher et al., 1989). The suspension was gently mixed, 250 µL of ammonium acetate (7.5 M) were added, mixed thoroughly and the samples were incubated on ice for 10 min. Phenol-chloroform extraction was performed by adding 500 µL phenol-chloroform-isoamyl alcohol (25:24:1), centrifuging 10 min at 13000 g and retrieving the aqueous phase, to which 500 µL of
chloroform-isoamyl alcohol (24:1) were added. The mixture was centrifuged for 10 min at 13000 g and the aqueous phase was recovered. DNA was precipitated with 0.6 volumes of isopropanol, followed by a 10 min centrifugation at 13000 g. The supernatant was discarded and the pellet was washed with cold 80 % ethanol and dried at room temperature. DNA was ressuspended in 100 µL DEPC-treated and sterile filtered water (Sigma-Aldrich, Switzerland).
2.8. B. licheniformis detection in digesta samples
To screen the presence of B. licheniformis specific markers in seabream gut, DNA extracted from digesta samples was used in PCR reactions containing 1 x DreamTaq Buffer (Thermo Scientific), 0.2 mM of each dNTP (Thermo Scientific), 0.2 μM of each primer (STAB Vida), 1 U of DreamTaq DNA Polymerase (Thermo Scientific) and 2 µL of digesta DNA, in a 20 µL volume. PCR conditions were the same as mentioned in section 2.5., using a different annealing temperature of 53 ºC.
PCR products were separated on 2 % agarose (Invitrogen) gels stained with GelRed (Biotium). Gel electrophoresis was carried out as described in section 2.2.
2.9. Multiplex PCR for identification of B. licheniformis
A multiplex PCR using the four B. licheniformis specific markers was tested in a 20 µL reaction with 1 x DreamTaq Buffer (Thermo Scientific), 0.2 mM of each dNTP (Thermo Scientific), 0.2 μM of each primer (STAB Vida), 1.5 U of DreamTaq DNA Polymerase (Thermo Scientific) and 25 ng of DNA template. PCR conditions applied were similar to those mentioned in section 2.5., with the exception for the annealing temperature that was set at 65 º.
PCR products were separated on 8 % polyacrylamide (Bio-Rad, USA) gels, for which electrophoresis was carried out at 25 mA/gel until the bromophenol blue front reached the bottom of the gel. These gels were stained with a GelRed (Biotium) solution.
2.10. qPCR for B. licheniformis quantification in digesta samples
In order to establish a qPCR experiment to quantify B. licheniformis in faecal samples several levels of screening were addressed, which are summarized in Fig. 5.
BL8A (247 bp) and BL18A (216 bp) markers were inserted into pGEM-T using pGEM®-T Easy Vector System I (Promega, USA), according to manufacturers’ instructions, and cloned into Escherichia coli DH5α competent cells (New England
BioLabs, USA) using the calcium chloride method. Plasmid DNA from ampicillin resistant colonies containing each vector-insert combination was extracted using GenEluteTM Plasmid Miniprep kit (Sigma-Aldrich, USA), and submitted to a digestion with NotI-HF (New England BioLabs) to confirm markers insertion.
Fig. 5 – Diagram of the steps carried out in the present work to validate the qPCR experiment as a method for bacterial
quantification.
To further confirm the identity and insertion direction of the sequences, the inserted fragments in the pGEM-T were sequenced using M13 forward primer (STABVIDA). Positive plasmids containing BL8A and BL18A markers were named as pEA1 and pEA3.
Each plasmid DNA was quantified using Qubit dsDNA HS Assay (Invitrogen) and plasmid copy number was determined according Gómez-Doñate et al., (2012) formula. For this purpose, molecular mass of plasmids containing each DNA marker was calculated using the Sequence Manipulation Suite (SMS) – DNA Molecular Weight (Stothard, 2000).
Gómez-Doñate et al. (2012) formula: 𝒏𝒖𝒎𝒃𝒆𝒓 𝒐𝒇 𝒎𝒐𝒍𝒆𝒄𝒖𝒍𝒆𝒔 𝒐𝒇 𝒑𝑮𝑬𝑴˗𝑻 𝑬𝒂𝒔𝒚 ∷ 𝒊𝒏𝒔𝒆𝒓𝒕 µ𝑳⁄ =
= 𝑐𝑜𝑛𝑐𝑒𝑛𝑡𝑟𝑎𝑡𝑖𝑜𝑛 𝑜𝑓 𝑝𝐺𝐸𝑀˗𝑇 𝐸𝑎𝑠𝑦 ∷ 𝑖𝑛𝑠𝑒𝑟𝑡 (𝑛𝑔 µ𝐿⁄ )
𝑚𝑜𝑙𝑒𝑐𝑢𝑙𝑎𝑟 𝑚𝑎𝑠𝑠 (𝑛𝑔 𝑚𝑜𝑙⁄ ) × 6.022 × 10²³𝑚𝑜𝑙𝑒𝑐𝑢𝑙𝑒𝑠 𝑚𝑜𝑙⁄
Ten-fold serial dilutions (1 to 10-7) of pEA1 and pEA3 plasmids in DEPC-treated water (Sigma-Aldrich, Switzerland) were used to generate standard curves for qPCR by plotting quantification cycles (Cqs) vs. number of plasmid copies.
To test the ability of screening both markers in DNA samples, as well as to determine the LOQ, ten-fold serial dilutions (1 to 10-8) in DEPC-treated water (Sigma-Aldrich) of B. licheniformis 9945A and FI1 DNAs were made. Initial number of genomes in these samples was determined using the copy number calculator for realtime PCR (SciencePrimer).
Bacterial cultures in LB medium (AppliChem) of B. licheniformis 9945A and FI1 were also submitted to ten-fold serial dilutions (1 to 10-8), which were plated onto NA (Liofilchem) to allow CFU enumeration. DNA from each dilution was extracted using the EZNA Bacterial DNA Purification Kit (Omega Bio-Tek), following manufacturer’s instructions, and used to determine the efficiency of extraction and also the LOQ value.
In order to determine the efficiency of the extraction method described in section 2.7., sample processing controls (SPCs) consisting in DNA extracted from faecal samples without (SPC0) or with bacterial pellets of known B. licheniformis concentration of 5, 4.52 × 10³ or 4.52 × 10⁶ CFUs/mg, SPC1, SPC103 or SPC106, respectively. This approach also allowed the determination of the LOQ value for faecal samples.
Each qPCR reaction of 20 µL consisted in 1 x SsoAdvancedTM Universal SYBR® Green Supermix (Bio-Rad), 0.35 μM of each primer (STAB Vida) and 1µL of each sample, which were tested in triplicate. To elute the possible presence of PCR inhibitors, which can be co-extracted with DNA from faecal samples, each faecal DNA was submitted to ten-fold dilutions (1 to 10-2) and each dilution was also tested in triplicates.
The controls included were the (i) non-template control (NTC); (ii) 9.8 ng/µL of B.
licheniformis 9945A as positive control; (iii) an internal positive control (IPC) consisting
in the sample 6 containing 9.8 ng/µL of B. licheniformis 9945A (IPC-6); and (iv) an control to screen for unspecific amplification consisting in the sample 6 containing 9.8 ng/µL of B. sonorensis LMG_21636 (Bsono-6).
The qPCR assay was carried out using CFX ConnectTM Real-Time Detection System (Bio-Rad) and qPCR program consisted of 2 min at 98 ºC for polymerase activation and DNA denaturation, 40 cycles of 5 s at 98 ºC for denaturation and 30 s at 60ºC for annealing, followed of melting curve analysis starting from 65 ºC to 95 ºC, using a 0.5 ºC increment for 5 s per step.
Data were analyzed using the CFX ManagerTM Software v3.1 (Bio-Rad) and the Cq determination mode used was regression. Taking into account that each marker is present as single copy per genome of B. licheniformis, absolute bacterial quantification in faecal samples was obtained by comparison with the standard curve and expressed as number of chromosomes per milligram of faeces.
3. Results
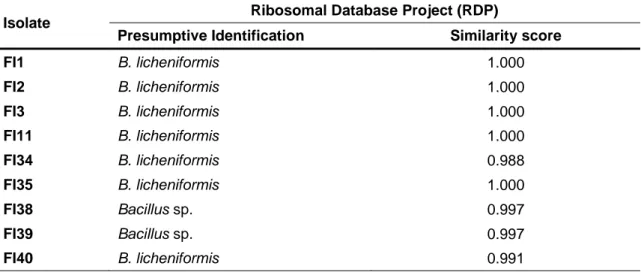
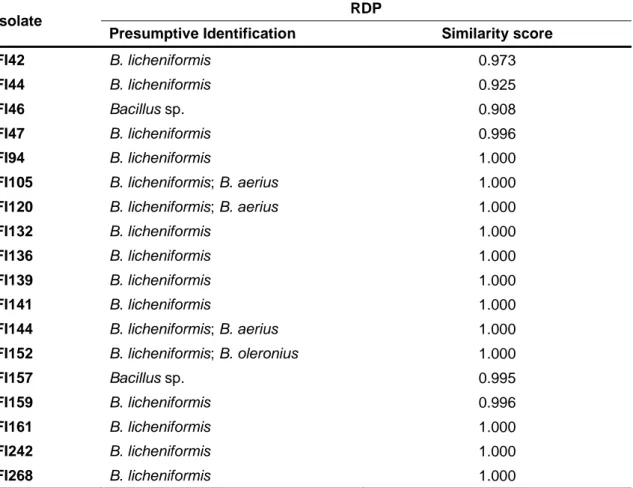
3.1. Identification of bacterial isolates through 16S rRNA gene sequencing The twenty seven bacterial isolates, obtained from fish gut, were identified by 16S rRNA gene sequencing. The obtained sequences were analyzed using the RDP database, which is able to determine their similarity values in comparison to other sequences present in the database. The majority of the isolates obtained from the gut of farmed fish were presumptively identified as B. licheniformis (FI1, FI2, FI3, FI11, FI34, FI35, FI40, FI42, FI44, FI47, FI94, FI132, FI136, FI139, FI141, FI159, FI161, FI242 and FI268). However, some isolates identified as B. licheniformis also showed high similarity with Bacillus aerius (FI105, FI120 and FI144) or with Bacillus oleronius (FI152) (Table 3). Concerning the isolates FI38, FI39, FI46 and FI157, it was not possible to obtain a robust similarity to any of the Bacillus species reported at RDP and therefore these isolates were classified as Bacillus sp. (Table 3; Attachment I).
The 16S rRNA gene sequences from FI1, FI2, FI3, FI11, FI34, FI35, FI40, FI94, FI105, FI120 FI132, FI136, FI139, FI141, FI144, FI161, FI242 and FI268 were deposited in GenBank under accession numbers from KM598336 to KM598353. The 16S rRNA gene sequences from FI42, FI44, FI47, FI152 and FI159 are available in Attachment II.
Table 3 – Presumptive identification of spore-forming bacterial isolates obtained from farmed
fish digesta samples and based on 16S rRNA gene sequencing.
Isolate Ribosomal Database Project (RDP)
Presumptive Identification Similarity score
FI1 B. licheniformis 1.000 FI2 B. licheniformis 1.000 FI3 B. licheniformis 1.000 FI11 B. licheniformis 1.000 FI34 B. licheniformis 0.988 FI35 B. licheniformis 1.000 FI38 Bacillus sp. 0.997 FI39 Bacillus sp. 0.997 FI40 B. licheniformis 0.991
Table 3 (cont.) – Presumptive identification of spore-forming bacterial isolates obtained from
farmed fish digesta samples and based on 16S rRNA gene sequencing.
Isolate RDP
Presumptive Identification Similarity score FI42 B. licheniformis 0.973
FI44 B. licheniformis 0.925
FI46 Bacillus sp. 0.908
FI47 B. licheniformis 0.996
FI94 B. licheniformis 1.000
FI105 B. licheniformis; B. aerius 1.000
FI120 B. licheniformis; B. aerius 1.000
FI132 B. licheniformis 1.000
FI136 B. licheniformis 1.000
FI139 B. licheniformis 1.000
FI141 B. licheniformis 1.000
FI144 B. licheniformis; B. aerius 1.000
FI152 B. licheniformis; B. oleronius 1.000
FI157 Bacillus sp. 0.995
FI159 B. licheniformis 0.996
FI161 B. licheniformis 1.000
FI242 B. licheniformis 1.000
FI268 B. licheniformis 1.000
3.2. Taxa-specific regions and DNA markers
Following Flowchart 1 (Fig. 4), the overlap of CUPID and Insignia’s outputs obtained using a C+.program allowed to retrieve 11 putatively specific ORFs for B. licheniformis ATCC_14580. A follow-up BLAST analysis of these regions revealed that 5 ORFs were specific for this species, however, the design of specific primers presenting the maximum quality score was only possible for one region – marker BL5B (Table 4), which is specific to B. licheniformis but is not present in all sequenced strains.
Specific regions for B. licheniformis DSM_13 were calculated using only Insignia (Flowchart 2; Fig. 4). In order to account only for annotated coding regions, the outputted regions were overlapped with the complete list of proteins from this organism (NCBI database) and 110 putative specific ORFs for B. licheniformis were selected. From these, only 27 were confirmed as specific by the BLAST analyses and the design of specific primers presenting the maximum quality score was possible for 3 different
regions – markers BL8A, BL13C and BL18A (Table 4), which are specific and transversal to all B. licheniformis strains completely sequenced.
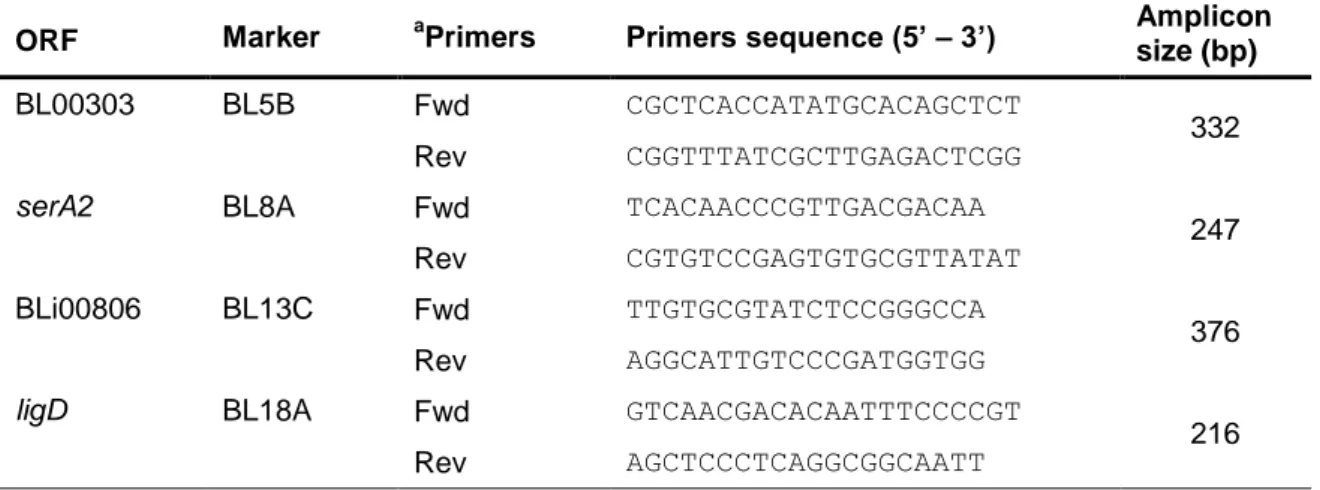
ORFs localization, primers and amplicon size of each selected marker are summarized in Table 4.
Table 4 – B. licheniformis specific markers, the corresponding ORFs and primers used with the
expected amplicon size.
ORF Marker aPrimers Primers sequence (5’ – 3’) Amplicon size (bp)
BL00303 BL5B Fwd CGCTCACCATATGCACAGCTCT
332
Rev CGGTTTATCGCTTGAGACTCGG
serA2 BL8A Fwd TCACAACCCGTTGACGACAA
247
Rev CGTGTCCGAGTGTGCGTTATAT
BLi00806 BL13C Fwd TTGTGCGTATCTCCGGGCCA
376
Rev AGGCATTGTCCCGATGGTGG
ligD BL18A Fwd GTCAACGACACAATTTCCCCGT
216
Rev AGCTCCCTCAGGCGGCAATT
a Fwd – primer forward; Rev – primer reverse.
3.3. In silico analyses of DNA markers
Comparative genomics analyses were carried out in order to disclose the genomic stability of the regions where the selected markers are located, using the chromosome of B. licheniformis type strain ATCC_14580 as reference. Based on the location of the markers in relation to several features annotated in the chromosome and generally associated with genomic mobility, such as phage related ORFs, IS, recombinases, integrases, transposases and tRNAs, the analyses showed that the DNA markers were within conserved chromosomal regions (Fig. 6).
Furthermore, the GC content for most of the coding regions where markers are located is approximate to the overall chromosomal GC content (46.2 %) (Fig. 6; Table 5). To further sustain the genomic stability of the chosen markers, the normalized Codon Adaptation Index ratio (CAI/eCAI) for each region was higher than the value 1 and similar to the CAI/eCAI values calculated for B. licheniformis HKs used for MLST typing (Table 5). Altogether these data support the hypothesis that the selected DNA markers are included in stable genomic regions, therefore suitable to be used as identification markers for B. licheniformis species.
Fig. 6 – Genome map of B. licheniformis ATCC_14580 pinpointed with DNA markers (dark blue), phage related ORFs
(pink), IS (green), recombinases (red), integrases (blue), transposases (purple) and tRNAs (brown). The locus tag, GC content, CAI and normalized CAI (CAI/eCAI) values are shown for each coding region containing the DNA markers.
Table 5 – The values of GC content, CAI, eCAI and CAI/eCAI ratio obtained for each ORF
containing the different DNA markers and for seven HKs commonly used for B. licheniformis MLST typing.
Locus tag Marker % GC CAI eCAI CAI/eCAI
BL00303 BL5B 44.8 0.770 0.755 1.020 serA2 BL8A 49.9 0.802 0.754 1.064 BLi00806 BL13C 41.8 0.806 0.765 1.054 ligD BL18A 46.8 0.800 0.749 1.068 Adk HK 44.6 0.779 0.750 1.039 ccpA HK 47.8 0.790 0.746 1.059 recF HK 42.8 0.794 0.766 1.037 rpoB HK 48.6 0.771 0.744 1.036 spo0A HK 48.9 0.799 0.740 1.080 sucC HK 48.4 0.822 0.745 1.103
Whole genome syntenic plots were constructed to compare the genome of B.
licheniformis ATCC_14580 with B. licheniformis DSM_13 and with B. licheniformis