Ciências da Saúde
Hypertension Prevalence in Portugal:
Systematic Review and Meta-analysis of
Population-based Studies on 21
thCentury
Jorge António Ribeiro Pereira
Dissertação para obtenção do grau de mestre em
Medicina
(ciclo de estudos integrado)
Orientador: José Manuel Calheiros, MD, MPH, PhD
Co-orientador: Renato Gorga Bandeira de Mello, MD, PhD
ii
Acknowledgments
To every single person who contributes for the following words: Search for knowledge
Without ambition, Improve yourself Improving the World! Coimbra, April 26th of 2018
iii
Resumo
Introdução: A hipertensão é o principal factor de risco para a carga global de doença e, em 2016, foi associada a 10.4 milhões de mortes. Em Portugal, a hipertensão é o primeiro factor de risco associado à mortalidade, não havendo nenhum estudo que avalie o impacto da hipertensão ao longo do século 21.
Objetivos: Proceder a uma revisão sistemática dos estudos de base populacional sobre hipertensão em Portugal, publicados entre 2000 e 2018, com meta-análise.
Métodos: Uma estratégia de busca sistemática foi conduzida na Pubmed usando as palavras-chave seleccionadas (Base-populacional; hipertensão; prevalência; Portugal). Utilizaram-se ainda referências de autores de relevo, do Instituto Nacional de Estatística, do Instituto Nacional de Saúde Ricardo Jorge, assim como artigos sugeridos pelos orientadores.
Resultados: A prevalência de hipertensão no século 21 em Portugal é de 33% (95% IC: 27.6% - 38.8%, I2: 45%), não havendo diferença significativa entre homens, 35.4% (95% IC: 24.3% -
48.3%), e mulheres, 32.9% (95% IC: 27,1% - 38,4%). Nos estudos com exame físico a prevalência é de 37.1% (95% IC: 31.8% - 42.8%) enquanto nos estudos com hipertensão auto-reportada é de 28.6% (95% IC: 23.6% - 34.3%). Verificou-se nos estudos com exame físico uma diminuição estatisticamente significativa entre as décadas (2000-2010 e 2011-2018) nos grupos etários <35 anos, de 16.3% (95% IC: 12.9% - 20.5%) para 6.3% (95% IC: 5.3% - 7.6%) e ≥65 anos, de 80.4% (95% IC: 76.9% - 83.5%) para 73.2% (95% IC: 69.5% - 76.6%).
Conclusão: A hipertensão é um problema com uma elevada prevalência e influencia na saúde dos portugueses. A prevalência da hipertensão é sub-estimada nos estudos com auto-reporte e verifica-se um aumento da prevalência com a idade. No entanto, mais estudos são necessários para concluir em relação à tendência da hipertensão no século 21, bem como medidas para melhorar a avaliação, controlo e prevenção da hipertensão.
Palavras-chave
iv
Extended Abstract
Background: Hypertension is the leading risk factor for the global burden disease and in 2016 was associated with 10.4 million deaths for all causes. It is also an important risk factor for Cardiovascular Diseases with relevant influence in the outcomes and associated with 9.7 million deaths by Cardiovascular Diseases in 2016. In Portugal, hypertension is the first risk factor for death, the fourth risk factor for early death and a determinant risk factor for stroke and ischemic heart diseases.
Objectives: The aim of this thesis is: (i) to conduct a systematic review of population-based studies regarding hypertension prevalence in Portugal, published between 2000 and 2018, with meta-analyses; (ii) to compare hypertension prevalence between gender and age groups; (iii) to analyse hypertension prevalence trends over the last two decades.
Methods: We performed a systematic literature search in Pubmed using selected keywords (population-based; hypertension; prevalence; Portugal). Also included in this review are references of recognized authors, publications of the Portuguese Statistics Institute and the Portuguese National Health Institute, and articles suggested by the advisors. The inclusion criteria applied to select studies to be reviewed and analyzed was: population-based studies, population 15 or more years-old and having been published in the 21th century. Following this
process, variables of interest were extracted and inserted in a Microsoft Excel database to allow for further statistical analysis. Meta-analysis and Meta-regression were conducted in the “Comprehensive Meta-analysis Software, V03 – trial version”. Assuming potential heterogeneity, random-effect model was used to run the analysis. Subgroup analyses were made in a “one-by-one” strategy to avoid collinearity.
Results: Hypertension prevalence on 21th century in Portugal is 33% (95% CI: 27.6% - 38.8%, I2:
45%) and did not have significant difference between men, 35.4% (95% CI: 24.3% - 48.3%), and women, 32.9% (95% CI: 27,1% - 38,4%). In studies with physical exam hypertension prevalence is 37.1% (95% CI: 31.8% - 42.8%) whereas in studies with self-reported hypertension is 28.6% (95% CI: 23.6% - 34.3%). Women have higher prevalence than men in studies with self-reported hypertension while men have higher prevalence in studies with physical exam. There is a statistically significant decreasing among studies with physical exam between decades (2000-2010 e 2011-2018) in age-groups <35 years of age, from 16.3% (95% CI: 12.9% - 20.5%) to 6.3% (95% CI: 5.3% - 7.6%) and ≥65 years of age, from 80.4% (95% CI: 76.9% - 83.5%) to 73.2% (95% CI: 69.5% - 76.6%). Algarve is the Portuguese region with lower prevalence in more studies.
Conclusion: Hypertension has a high prevalence in Portugal. Self-report hypertension under-estimate the hypertension prevalence and an increasing prevalence is demonstrated with
v
aging. However, further studies are necessary to identify the trend of hypertension on 21th, as well policies to improve evaluation, control and prevention of hypertension.
vi
Abstract
Background: Hypertension is the leading risk factor for the global burden disease and in 2016 was associated with 10.4 million deaths for all causes. In Portugal, hypertension is the first risk factor for death and there are not studies about the trend of hypertension on 21th
century.
Objectives: The aim of this thesis is to conduct a systematic review of population-based studies regarding hypertension prevalence in Portugal, published between 2000 and 2018, with meta-analyses.
Methods: A systematic search strategy was conducted in Pubmed using selected keywords (population-based; hypertension; prevalence; Portugal). References of known authors, Portuguese Statistics Institute, Portuguese Health Institute and articles suggested by the advisors were also included in this review.
Results: Hypertension prevalence on 21th century in Portugal is 33% (95% CI: 27.6% - 38.8%, I2:
45%) and did not have significant difference between men, 35.4% (95% CI: 24.3% - 48.3%), and women, 32.9% (95% CI: 27,1% - 38,4%). In studies with physical exam hypertension prevalence is 37.1% (95% CI: 31.8% - 42.8%) although in studies with self-reported hypertension is 28.6% (95% CI: 23.6% - 34.3%). There is a statistically significant decreasing among studies with physical exam between decades (2000-2010 e 2011-2018) in age-groups <35 years of age, from 16.3% (95% CI: 12.9% - 20.5%) to 6.3% (95% CI: 5.3% - 7.6%) and ≥65 years of age, from 80.4% (95% CI: 76.9% - 83.5%) to 73.2% (95% CI: 69.5% - 76.6%).
Conclusion: Hypertension has a high prevalence in Portugal. Self-report hypertension under-estimate the hypertension prevalence and an increasing prevalence is demonstrated with aging. However, further studies are necessary to identify the trend of hypertension on 21th, as well policies to improve evaluation, control and prevention of hypertension.
Key Words
vii
Index
Acknowledges ii
Resumo e Palavras-chave iii
Extended abstract iv
Abstract and Keywords vi
Index vii List of figures ix List of tables x List of acronyms xi 1. Introduction 1 2. Objective 2 3. Conceptualization 3 3.1. Definition 3 3.2. Classification 3 3.3. Etiology 4 3.4. Risk Factors 4 3.5. Outcomes 4 3.5.1. Cardiovascular Diseases 5 3.6. Prevalence 6 3.6.1. Global 6 3.6.2. Portugal 7
4. Materials and Methods 8
4.1. Literature Review 8
4.2. Search Strategy and Eligibility Criteria 8
4.3. Study Selection and Data Extraction 9
4.4. Assessment of Study Quality and Risk of Bias 10
4.5. Data Analysis 10 5. Results 12 5.1. Synthesis of Data 12 5.2. Study Characteristics 12 5.2.1. Sample Calculation 12 5.2.2. Recruitment 13
5.2.3. Methodology of Recording Blood Pressure 13
5.2.4. Prevalence 14
viii
5.4. Meta-Analysis Results 16
5.4.1. Prevalence 16
5.4.2. Gender-specific Prevalence 17
5.4.3. Age-group specific Prevalence 17
5.4.4. Comparison per Decade 18
6. Discussion 19
6.1. Results 19
6.2. Strengths and Limitations 20
7. Conclusions 22
8. Bibliographic References 23
9. Supplementary Material 30
9.1. Annex 1 30
ix
List of Figures
Figure 1 – Flowchart of records retrieved, screened and included Page 9
Figure 2 – Studies with SR Hypertension Page 14
Figure 3 – Studies with PM Page 15
Figure 4 - Hypertension by region Page 15
Figure 5 - Overall hypertension prevalence in Portugal Page 17
x
List of Tables
Table 1 – Mortality over decades in Portugal Page 5
Table 2 – Hypertension Prevalence over decades Page 6
Table 3 - Hypertension Prevalence in Portugal Page 7
Table 4 - Hypertension Prevalence per Decade by age-group Page 18
Table 5 – Identification of Studies Included Page 30
xi
List of Acronyms
AHA – American Heart Association BMI – Body Mass IndexBP –Blood Pressure
BPLM – Blood Pressure Lower Medication CHD – Coronary Heart Diseases
CI – Confidence Interval CVD – Cardiovascular Diseases
DALYs – Disability-Adjusted Life Years DBP – Dyastolic Blood Pressure
EHES - European Health Examination Survey ESC – European Society of Cardiology ESH – European Society of Hypertension HTN - Hypertension
IHD – Ischemic Heart Diseases
IHME – Institute for Health Metrics and Evaluation INE – Portuguese Statistic Institute
INSA – Portuguese Health Institute MeSH – Medical Subject Headings mmHg – millimetres of Mercury
MOOSE - Meta-analysis Of Observational Studies in Epidemiology PHC – Primary Healthcare Centres
PM – Physical Measure SBP – Systolic Blood Pressure SMR – Standard-mortality Rate SR – Self-Reported
STROBE – Strengthening the Reporting of Observational Studies in Epidemiology USA – United States of America
1
1. Introduction
Hypertension, also known as the silent killer, is a chronic asymptomatic problem if not treated leads to target organ damage like the heart, brain, eye, kidney, small and big vessels. These changes could lead to several mortal outcomes like stroke, ischemic heart diseases (IHD), renal and heart failure.(1–3)
Hypertension is the leading risk factor for the global burden disease(4) and in 2016 was responsible for 10.4 million deaths for all causes.(5) Is also an important risk factor for Cardiovascular Diseases (CVD) with relevant influence in the outcomes(6–8) and associated with 9.7 million deaths by CVD in 2016.(5)
In Portugal, hypertension is the 1st risk factor for deaths in Portugal, the 4th risk factor for
early deaths and a determinant risk factor for stroke and IHD.(9–11) Institute for Health Metrics and Evaluation (IHME) of University of Washington estimated that hypertension was involve in 19000 deaths and associated to 273000 Disability-Adjusted Life Years (DALYs).(5) The importance of systematic review and meta-analyses is well known among the scientific society. Select, order and systematize the knowledge about a health determinant or a disease help the general society to be better informed, improve the awareness and allows the stakeholders to take the properly policies.(12)
Therefore, the present thesis makes an overview of hypertension as a risk factor and its impact, the potential outcomes and the Global Burden of CVD; a brief of the hypertension prevalence in the world is also made.
However, the major aim is evaluate the hypertension prevalence in Portugal and to achieve this purposes was performed a systematic review with a resort to quantitative statistic methodology – meta-analysis.
2
2. Objective
The aim of this thesis is to conduct a systematic review of population-based studies regarding hypertension prevalence in Portugal. Furthermore to compare hypertension prevalence between gender and age groups as well as to verify trends in hypertension prevalence over the last two decades.
3
3. Conceptualization
The present section defined the concepts and provides an overview of hypertension which will be central to this dissertation.
3.1.
Definition
Blood pressure (BP) is the force created when the blood, pumped by the heart, is pushed against the walls of blood vessels. The blood flow increases when the heart beats (systolic blood pressure - SBP) and decreases when heart relaxes (diastolic blood pressure - DBP). It is measured in millimetres of mercury (mmHg) by manual or electronic devices that give two values, being the highest SBP and the lower DBP.(1–3)
Hypertension is the condition of persistent, non-physiologic elevation of systemic BP. The higher the blood pressure in the vessels harder will the heart will beat.(1–3) Clinically, for the majority of the scientific societies, this elevation is considered hypertension when, at rest, the SBP is equal or higher than 140 mmHg and/or DBP is equal or higher than 90 mmHg.(13– 19)
3.2.
Classification
From an epidemiological perspective there is not an obvious level of BP that define appropriately hypertension.(2) Some scientific societies consider the levels of BP equal or below a 120/80 mmHg as optimal.(13–19) However, there is evidence demonstrating the association between BP and Coronary Heart Disease (CHD) for levels since 115/70 mmHg.(20,21)
In 1970’s the World Health Organization (WHO) defined Normal BP as the values below 140/90 mmHg and hypertension to values equal or above to 160/95 mmHg. However, new studies began to demonstrate the decrease of average life expectancy with the increase of BP for values above 120/80 mmHg.(22)
In summary, currently optimal BP values are considered by majority of the scientific societies to be those below 120/80 mmHg and hypertension for values equal or above 140 and/or 90 mmHg.(13–19) The American Heart Association (AHA) recent changed the guidelines considering now hypertension for values equal or superior 130 and/or 80 mmHg.(23)
In Portugal the guidelines6 for definition and classification of hypertension have the same
standards of European Society of Cardiology (ESC) and European Society of Hypertension (ESH) 2013 which are, SBP≥140 and/or DBP≥90 mmHg.(14)
4
3.3.
Etiology
Hypertension is classified as primary, or essential, when no specific cause is identified. It accounts for at least 90% of all cases. It is classified as secondary when a specific cause such as renal failure is identified.(1–3)
This distinction is not always easy. As an example, let us consider a person who is diagnosed as having renal failure and, simultaneously has hypertension. Often it is difficult to identify if hypertension resulted from renal failure or if a risk factor, like high salt intake, led to hypertension and to renal failure.(3)
3.4.
Risk Factors
A risk factor is any attribute, characteristic or environmental exposure of an individual that is associated with an increased probability of occurrence of a disease. Risk factors can be categorized as modifiable and non-modifiable. Modifiable risk factors are characteristics, exposures or lifestyle patterns that can be adjusted or changed to prevent the development of the disease, as diet or physical activity. Non-modifiable risk factors are attributes or characteristics in the individual that cannot be changed or adjusted, as age or family history, but many of them can be controlled and their effect reduced by making changes in lifestyle.(2,3,24,25)
The main risk factors to develop hypertension could be biological, like gender(26,27), age(27– 31), race(28,32), family history(27,28) or genetic(33,34); environmental like pollution(35), dyslipidemia(31), BMI(27–29,36), waist circumference(26,28,31), physical inactivity(26,28) alcohol consumption(26,37), tobacco(37), high salt-intake(38,39), medication(29) or diabetes(27,31,37); and psychosocial like stress(40), education(26,29,30,36), household income(27) or marital status(30).
Important to notice two things. First, primary hypertension could be the result of the interaction between genetic and environmental factors and second, with aging vasculature changes and the physiologic adaptations involve a rise in BP.(2,3)
3.5.
Outcomes
The outcomes of hypertension are events that occur in target damage organs, like renal or cardiovascular diseases. WHO, in the Global Health Risks Report (2009), referred that 51% of strokes and 47% of IHD are attributable to hypertension.(41) In 2016, hypertension was also responsible for 9.7 million deaths caused by CVD.(5) In context of this dissertation we will address especially CVD.
5
3.5.1. Cardiovascular Diseases
WHO defines CVD as disorders of the heart and blood vessels and include coronary heart disease, cerebrovascular disease, rheumatic heart disease and other conditions. Heart attacks and strokes represent 80% the causes of death by CVD.(42) Despite Scientific societies and health organizations use different disease clusters, when addressing CVD in this thesis we will consider the WHO cluster that includes aforementioned diseases.
Since the beginning of 21th century, CVD was responsible for 64 million deaths. In 2015 caused more than 17 million deaths, representing 31.3% of all deaths while in 2000 the same indicator was 27.7%. In 2015 CVD led to more than 400 millions of DALYs while in 2000 this value was 343 million. In 2015 ischemic heart disease was the first cause of DALYs while stroke was ranked 3rd.(5)
Like many high-income countries during the past century, currently low- and middle-income countries are seeing an alarming and accelerating increase in CVD rates.(43) An example of this epidemiologic transition is the south-east Asia region where the number of deaths attributed to CVD raised from 2.6 millions in 2000 to 3.8 millions in 2015.(44)
In Portugal CVD is decreasing. Official data show a decrease in the proportion of death attributed to CVD and in 2015 the Standardized-mortality rate (SMR) is below European mean. Therefore, SMR for stroke show a decreasing trend while SMR for ischemic heart disease remained stable.(45)
Table 1 – Mortality over decades in Portugal
Mortality
HTN (n) CVD (n) CVDhtn (n) %
2000 22234 43615 21071 48.31
2010 18386 35654 16568 45.98
2016 19042 37274 17136 46.47
HTN: Hypertension; HTN (n): Number of deaths associated to HTN; CVD (n): number of deaths by CVD; CVDhtn (n): number of deaths by CVD withHTN associated;
%: percentage of deaths by CVD with HTN associated. Source: www.healthdata.org
Table 1 shows data from IHME of University of Washington about Mortality by CVD and the association of hypertension in deaths by CVD in Portugal.
In 2017 Portuguese scientific societies (Portuguese Society of Cardiology and Portuguese Foundation of Cardiology) referred that in Portugal 35000 people die every year due to CVD, 20000 had stroke as outcome and 1000 of myocardial infarction and that represents 1/3 of all deaths.(46)
Comparing to European countries, in 2013 Portugal had a SMR for ischemic heart disease below European mean and a SMR for stroke above European mean.(47)
6
3.6.
Prevalence
3.6.1. Global
Between 1980 and 2008 the prevalence of hypertension decreased.(41) It is important to notice that, according Danaei et al, SBP decreased simultaneously.(48)
Table 1 presents the results of 3 global hypertension prevalence studies. For the year 2000 the estimated prevalence worldwide was 26.4% for adult population what represents 972 million people with hypertension.(49) In 2010 hypertension prevalence increased worldwide and 1.39 billion people were classified as having hypertension.(50)43
Table 2 - Hypertension prevalence over decades
First author’s article, year Period of Analysis Age Prevalence of HTN in last year consider People with HTN in last year consider Kearney P, 2005 1980-2000 ≥20 26.4% 972 million Mills KT, 2011 2000-2010 ≥20 31.1% Men: 31.9% Women: 30.1% 1.39 billion Zhou B, 2017 1975-2015 ≥18 Men: 24.1% Women: 20.1% 1.13 billion
Mills et al (2011) observed an increasing rate in total hypertension prevalence and among
both genders. They analysed the trends in high, middle and low-income countries and concluded that hypertension prevalence decreased in high-income countries, affecting 349 million people, and increased in middle and low-income countries, with an 1.04 billion in 2010.
More recently, Zhou et al (2017), concluded that hypertension prevalence decreased in high-income and some middle-high-income countries, remaining unchanged elsewhere.(51) However, they also concluded that hypertension prevalence decreased between 1975 (men: 29.5%; women: 26.1%) and 2015 (men: 24.1%; women: 20.1%).
These studies different conclusions may have to do with sampling differences, age range and the period of the study. Despite these differences it is well demonstrated the heavy global burden of hypertension.
An overview of data from studies in countries or regions around the world demonstrate a decreasing prevalence in Brazil(52), a decline in Central China but a rise in other regions especially in southwest(53); prevalence is higher in middle income countries compared with low income countries(54), in addition, urban/rural comparisons reveal that India rural regions are lesser hypertensive than urban area(55). Furthermore, in sub-Saharan Africa the prevalence is increasing(56) and in United States of America (USA) a stable prevalence around 29% is observed in the present century.(57)
7
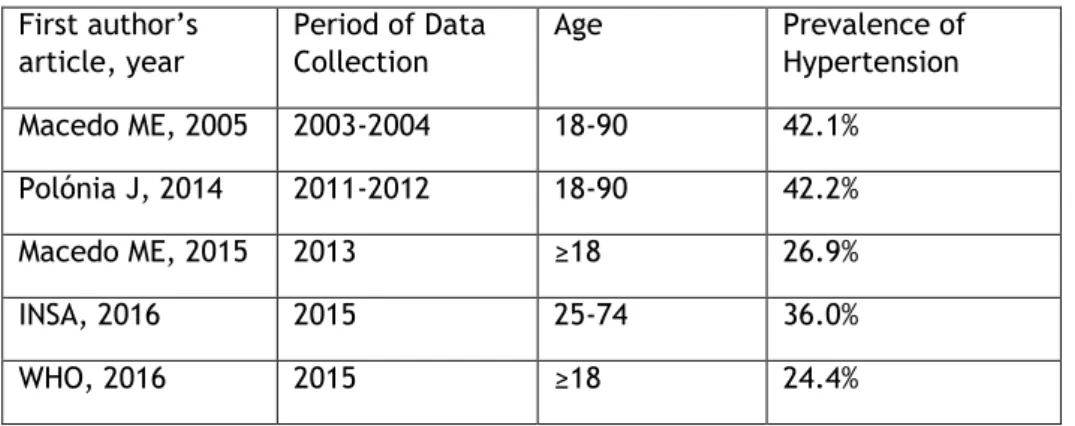
3.6.2. Portugal
In Portugal a systematic review of data between 1990 and 2005 reveals a decreasing in prevalence of middle-aged and older adults and a constant value in young adults.(58)
However, when we compare the studies of Macedo et al (2005) and Polónia et al (2014) no differences are observed over a decade.(59,60)
Macedo et al (2015) demonstrate an overall prevalence in Primary Healthcare Centres (PHC)
users smaller 15% than Polónia et al (2014) presented.(60,61)
Recent data from a national health survey with physical exam, INSA (2016), reveals a 36% of prevalence.(62)
WHO data for the year 2015, reveal that Portugal had a prevalence above the European mean (23.2%).(63)
Table 3 - Hypertension Prevalence in Portugal
First author’s article, year Period of Data Collection Age Prevalence of Hypertension Macedo ME, 2005 2003-2004 18-90 42.1% Polónia J, 2014 2011-2012 18-90 42.2% Macedo ME, 2015 2013 ≥18 26.9% INSA, 2016 2015 25-74 36.0% WHO, 2016 2015 ≥18 24.4%
8
4. Materials and Methods
The present section follows the principles/guidelines for Strengthening the Reporting of
Observational Studies in Epidemiology – STROBE.(64)
The STROBE Statement was published in 2007 in several journals in order to encourage dissemination (STROBE checklist). It consists of a checklist and a flow diagram to improve the evaluation of strengths and weakness of observational studies.
In the next sections we will address the specific objectives of this dissertation.
4.1.
Literature Review
A systematic search was conducted in the Cochrane and Pubmed electronic article database using the following strategy: ((((population-based)) AND (((hypertension)) AND (prevalence)))) AND (Portugal). A systematic review on the prevalence of hypertension in Portugal was identified.(58) The author published results regarding trends in hypertension prevalence between 1990 and 2005.
The aim of this systematic review is to update the aforementioned study more than a decade later, considering the relevant data on hypertension prevalence published since then. Therefore we focused on data published in the 21th century, limiting the article search and
selection to the period between 2000 and 2018.
4.2.
Search Strategy and Eligibility Criteria
This research was conducted between February and March of 2018 in order to obtain the most recent literature. The last access took place on the 31th of March.
Forthose articles which did not had free access or had incomplete data, the authors were contacted directly.
Manual research consisted in access references lists of pubmed articles, articles recommended by the advisors, government reports on the INE and INSA platforms, and references from university libraries books.
The eligibility criteria is: population-based cross-sectional or cohort studies studying people aged 15 or more years, conducted on or after 2000 with hypertension prevalence data.. No language restrictions were applied.
The studies published did not provide specific data for Portugal, did not provide data in an eligible format for extraction, did not evaluated the adult population, did not present prevalence data, evaluated specific groups (e.g. university students), were not population-based, used a non-probability sample, did not provide stratified data or were published prior to 2000 were excluded.
9
4.3.
Study Selection and Data Extraction
The identification of the literature was conducted as described above.
Two independent reviewers assessed the eligibility of the studies, conducted through double-titration of abstracts and titles. In the first screening, the identified studies were excluded by title or abstract because met explicit exclusion criteria. In the second step, we assessed the remaining manuscripts by full-text reading. For studies that used the same sample, the one
Records screened (n=55)
Titles and abstracts excluded (n=28) Id e nti fi cation Sc re e ni ng
Full-text records assessed for eligibility (n=27) El ig ib il ity
Studies included in qualitative synthesis (n=11)
Studies included in quantitative synthesis (n=11)
Inc
lud
e
d
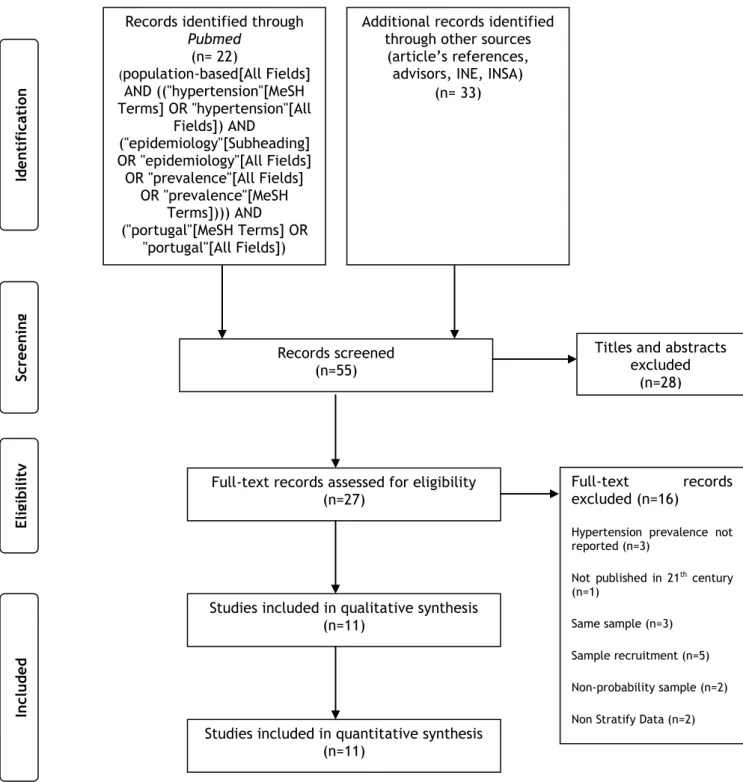
Figure 1 - Flowchart of records retrieved, screened and included Records identified through
Pubmed (n= 22) (population-based[All Fields] AND (("hypertension"[MeSH Terms] OR "hypertension"[All Fields]) AND ("epidemiology"[Subheading] OR "epidemiology"[All Fields] OR "prevalence"[All Fields] OR "prevalence"[MeSH Terms]))) AND ("portugal"[MeSH Terms] OR "portugal"[All Fields])
Additional records identified through other sources
(article’s references, advisors, INE, INSA)
(n= 33)
Full-text records excluded (n=16)
Hypertension prevalence not reported (n=3)
Not published in 21th century
(n=1)
Same sample (n=3) Sample recruitment (n=5) Non-probability sample (n=2) Non Stratify Data (n=2)
10
with the biggest sample size was considered and, whenever possible, those presenting more strata-specific information. Following the above methodology, 11 studies(59,60,62,65–72) were selected meeting the inclusion criteria (Figure 1).
After selecting the articles, the variables were extracted and organized into a Microsoft Office ExcelTM spreadsheet based on the STROBE checklist, using items: 4, 5, 6A, 7-10 , 12c-e,
13a, 14b, 16a, and 17. The primary outcome of this meta-analysis was hypertension prevalence. Whenever a study had additional relevant data in another document, this information was included. Whenever necessary and possible, missing data by strata was calculated. The hypertension definitions of the selected studies are of two types:
SBP ≥ 140 and/or DBP ≥ 90 and/or BP lowering medication (BPLM) Self-reported hypertension
When a study had data on both of hypertension collected by clinical and surveillance method, we considered the one that had data by strata; if both provided strata data the extracted information was the one collected by the clinical method.
4.4.
Assessment Study Quality and Risk of Bias
The methodological quality of included studies, including selection bias, measurement bias and bias related to data analyses, was assessed according to the reporting meta-analysis of observational studies (MOOSE) checklist.(73)
Selection bias was considered if ≥20% of the selected sample refused to participate in the study or if data collection was not made through an actual interview. Non-random sampling was not considered because all studies selected had probability samples.
Measurement biases were defined considering the type of device used and measurement methods for BP recording (e.g. discard of the first measurement), except for self-reported hypertension.
Bias related to data analyses was considered if the design effect was not accounted for the calculation of prevalence.
After individual assessment for bias and methodological quality, all studies included in this systematic review presented fair or good internal validity.
4.5.
Data Analysis
All estimates of the analyses and their 95% confidence intervals (95% CI) were calculated using the random effects model according to the decade of inclusion of participants, gender (when possible) and age groups. The choice was based on the possibility that the different studies had evaluated different populations, since most of the included studies evaluated only
11
local population bases. Such a hypothesis could explain the heterogeneity expected in the present meta-analysis. However, even considering the possibility of heterogeneity, the analysis by the fixed effects model was also evaluated, with no differences in the estimates, despite having narrower confidence intervals.
Heterogeneity and consistency were assessed through Cochran's Q and I2 statistics,
respectively. Analyses and forest plots were performed using the software Comprehensive Meta-AnalysisTM version 3 – free trial.
Subgroups analysis was performed considering gender as well as age groups. Trends in hypertension prevalence were obtained through direct comparison of hypertension prevalence’s in the first and second decade of the 21st century, considering data collection
date intervals. Sensitivity analyses of data were also carried out to test for small-sized study bias with no differences in the presented results.
12
5. Results
In this section we present the findings of the systematic review and meta-analysis. Due to meta-analysis accuracy, whenever possible we will present the statistic findings.
5.1.
Synthesis of Data
Based on the defined strategy (see page 9 -Materials and Method section), Pubmed search identified 22 articles; 33 additional records (4 reports, 1 thesis, 1 poster and 27 articles) were obtained from other sources (INE, INSA, advisors’ suggestions and article references).
An initial screening, based on paper titles and abstracts, lead to the rejection 28 results; 27 documents were fully accessed and checked for eligibility criteria.
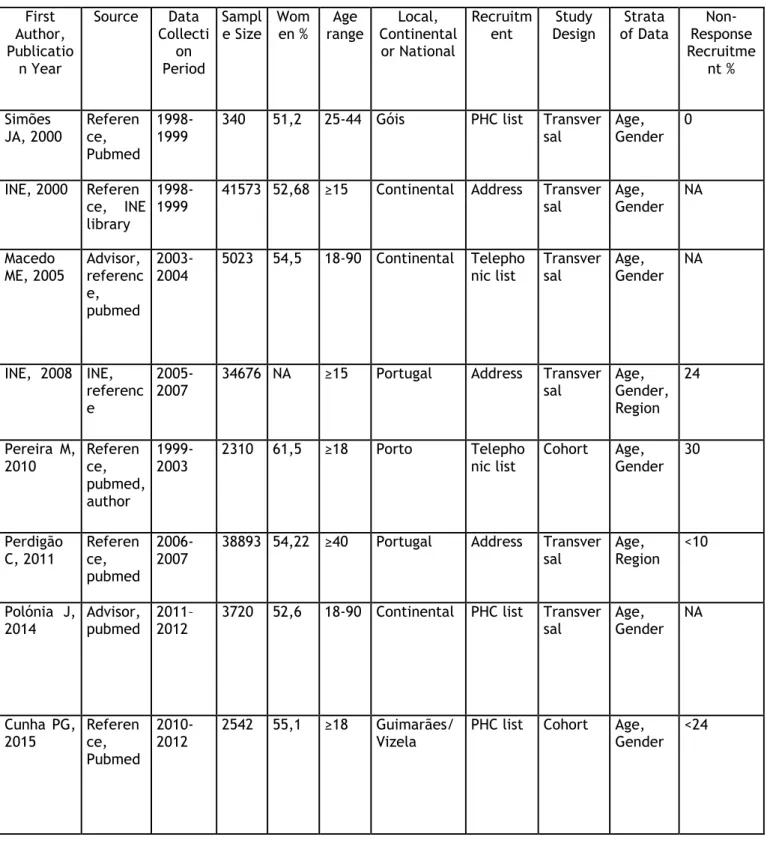
A total of 11 results(59,60,62,65–72) published between 2000 and March of 2018, were considered eligible to this study, 4 reports(62,70–72) (carry out by governmental institutions) and 7 articles(59,60,65–69) published in scientific journals. All results have data stratified by age and total prevalence (supplementary material, section 9). Three are studies from local communities, other 3 present data from Portugal mainland and the remaining 5 have data from all country. Five studies also present stratification by region. The recruitment followed various methods (2 used telephone lists, 4 primary healthcare centers (PHC) lists, 4 were based on location). Data was presented using variable strata definitions for age, gender and region.
The total number of participants in these studies was 154585 individuals. The sample size varies between 340, in a local study(65), and 41573, in the 1998-1999 National Health Survey(70). People included were 15 or more years-old and female participation was between 51.2% and 61.5%. The 2005-2006 National Health Survey sample(71) took into account the 2001 Portuguese CENSUS; as a result the female/male rate was higher than 50%.
The study designs were cross-sectional in 8 studies(59,60,62,65,66,70–72) and 3 were cohort studies(67–69). Data collection took place between 1998 and 2015. In all studies BP measurement was obtained cross-sectionally.
5.2.
Study Characteristics
5.2.1. Sample Calculation
In all the studies included, the authors calculated representative samples of the people they intended to study.
13
Local studies considered the people living in those places. National health surveys of 1998-1999 and 2005-2006 took into account the people from CENSUS (1991 and 2001, respectively). CENSUS 2001 also served to estimate the sample of other 3 studies(59,60,66).
Five studies(59,60,62,66,68) took also into account the expected or theorical prevalence (of hypertension or other measure) in the population. Multistage methodology was used in 6 studies.(62,66,68,70–72) Cunha et al(67) took into account predictable nonadherence and dropout proportions.
5.2.2. Recruitment
The recruitment was different among the studies (see supplementary material, section 9). Address, telephone lists or PHC lists were used to recruit people. In Portugal not everyone have a family doctor or are enrolled in PHC(74) ,thus the studies that used PHC lists could not took into account every single person living in Portugal. Cunha et al, used PHC lists, but before recruiting they analysed the differences between local citizens’ registers and PHC lists and concluded that difference was not significant. Every study described the way they contact and invited people (personally, telephone or letter). Seven studies have nonadherence data, or it was possible to estimate its value. This rate varied between 0% and 30%. It is important to notice that samples were probabilistic and the people invited was selected using a randomize methodology.
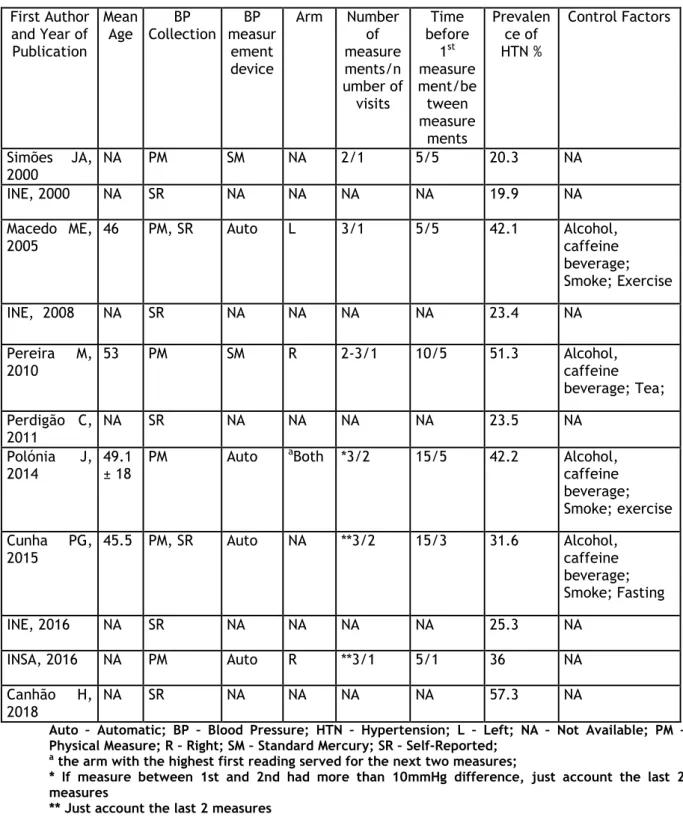
5.2.3. Methodology of Recording BP
BP data collection was obtained by interview, physical measurement or both. In the studies where BP was self-reported (SR), 4 were personal face-to-face interviews(66,70–72) and one use telephone interviews(68). Whenever BP was collected both ways, the clinical method was the preferred to extract data. This occurred in 2 studies that revealed higher hypertension prevalence rates using the later method.(59,67) In the 6 studies that recorded BP by physical measure (PM)(59,60,62,65,67,69), 4 used automatic devices and 2 standard mercury devices. Different number of measures and time of rest before and between the measures was also used (supplementary material, section 9); however 2 studies referred the use of international guidelines.(59,69) The arm selection varied, but every study referred that the size of arm was taken into account when choosing the cuff.
Only two studies performed BP measurements in more than one visit.(60,67) In both visits BP measurements used the same methodology, what is in accordance with international guidelines(75), therefore avoiding BP prevalence overestimates.
In 4 of the 6 studies that have performed physical measurements, precautions were taken to not influence the BP results. Participants were advised not to drink caffeine and/or alcohol
14
beverages, not to drink tea, not to smoke, not to make exercise and fast for at least 30 min prior to the measurement in 3 of the studies and 8 hours in the other one (supplementary material, section 9).
5.2.4. Prevalence
Hypertension prevalence data was collected and the methodology of each study to access this condition was taken into account.
When the study measure is hypertension by the awareness of the participants about them health status, the SR measure defines hypertension. When a physical exam was performed the definition for those studies was the same: SBP ≥ 140 and/or DBP ≥ 90 and/or BPLM.
All studies present total hypertension prevalence rates stratified by age. However, not all studies used the same stratification (supplementary material, section 9). Three of these studies considered shorter age groups (one between 25-44, another age equal or higher than 40 years, and another one age equal or higher than 65 years of age). Ten studies present results by gender.
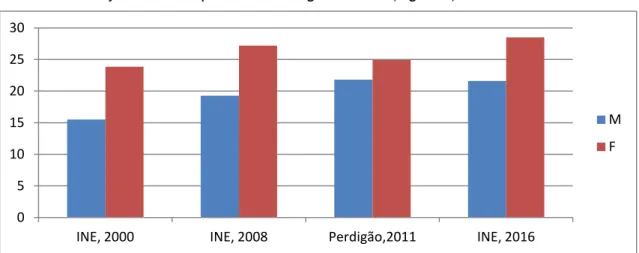
For studies in which hypertension is exclusively SR, the prevalence is higher in women (Figure 2). On the other hand, among those in which hypertension is measured through automatic or standard mercury devices the prevalence is higher in men (Figure 3)
Figure 2 – Studies with SR Hypertension
When we look to the prevalence among the studies with SR hypertension, prevalence estimates range between 19.9%(70) and 25.3%.(72) However, the most recent published study presents a prevalence of 57.3% but it included only individuals 65 or more years of age.(68) Among studies that recorded BP with PM, regional studies present values that range between 20.3%(65) and 51.3%.(69) The 3 continental or national studies have prevalence rates between
0 5 10 15 20 25 30
INE, 2000 INE, 2008 Perdigão,2011 INE, 2016
M F
15
36.0% and 42.2%. Two of those provide a decade comparison (Table 3)
Figure 3 – Studies with PM
without showing significant differences in total prevalence and in women (38.9% to 40.2%), but demonstrate a 5% decrease among men (49.5% to 44.4%). Simões et al(65) in a study conducted between 1998 and 1999, identified a prevalence of 20.3% in a city called Góis, in the central region of Portugal. Simultaneously, INE conducted a study in 1998-1999 that identifies a prevalence of 19.9% in Portugal mainland(70). In addition, INE conducted a National Heath Survey in 2014 that identified prevalence for Portugal of 25.3%.(72) However, INSA and INE conducted a National Health Survey with Physical Exam in 2015 and identified prevalence of 36.0% in Portugal.(62) Cunha et al(67) reports a hypertension prevalence, for 2 cities in the north of Portugal, of 31.6%, what is less than the result obtained by Polónia et
al(60) for Portugal mainland (42.2%), in the same period.
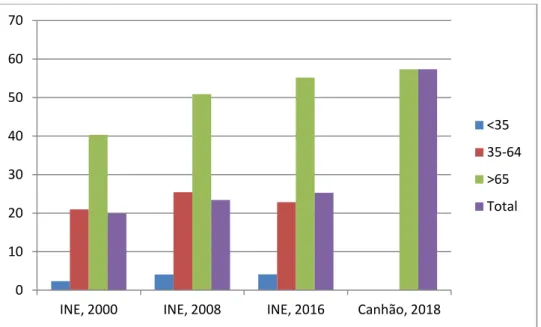
Among the studies with data stratified by age groups, 4 studies(59,60,65,67) reveal an increasing prevalence as age increases in both genders.
Figure 4 – Hypertension by region
0 10 20 30 40 50 60
Góis, 2000 Macedo, 2005 Pereira, 2010 Polónia, 2014 Cunha, 2015 INSA, 2016
M F 0 10 20 30 40 50 60 70 INE, 2008 Perdigão, 2011 INE, 2015 INSA, 2016 Canhão, 2018 INE, 2016
16
Five studies have data from the 7 Portuguese regions (North, Centre, Lisbon, Alentejo, Algarve, Azores and Madeira). Figure 4 shows hypertension prevalence in the different regions by study. Nevertheless it should be emphasized that these studies use different age ranges and Algarve region have the lower hypertension prevalence in 3 of the 5 studies.
5.3.
Assessing Bias
The studies selected were published in 2000 (2 results), and one in each of the following years - 2005, 2008, 2010, 2011, 2014, 2015, 2016 (2 results) and 2018. There is not a study per year or a systematic period between studies. Also, there are not studies with data from the same year of CENSUS 2001 and CENSUS 2011.
As previously mentioned, sample size varies significantly, between 340 and 41537, with a median of 4910. Information about the methodology to calculate the sample size is explained in every study, as well the methodology of recruitment which is different among the studies and may have influenced the possibility of participation of the population (e.g., Polónia et
al(60) just consider 84% of population because made the recruitment based in PHC lists).
However, every sample is randomized, probabilistic and multistage cluster sampling.
Non-participation rate is not described by every study, and among those who presented this value was inferior to 30%. Of the entire studies just one used a telephone interview. Among the studies with PM, 2 discarded the first measure and another study discard the firs measure if the difference between the 1st and 2nd measure was superior to 10mmHg. The number of
measures was different as well as the time before and between measures, but the researches were very cautious in cuff selection. The different age-stratification place major difficulties to obtain comparable information. Only 4 studies control factors (like smoking or drink tea before PM) those could influence the BP results.
As referred before (page 10, Materials and Methodologies section), whenever was possible we calculated data that was not available.
5.4.
Meta-Analyses Results
5.4.1. Prevalence
Overall hypertension prevalence (Figure 5), regardless of gender, age, settings, and BP measurement methods, was available in all studies (n=154585) varying from 19.9%16 to 57.3%. The summary measure - hypertension prevalence - was 33% (95% CI: 27.0% - 38.8%, I2: 45%).
17
Figure 5 – Overall hypertension prevalence in Portugal
5.4.2. Gender-Specific Prevalence
10 of the 11 studies included in the present thesis provided gender-specific data on hypertension prevalence in Portugal. However, only 8 studies provide data that allows gender-specific prevalence meta-analysis (supplementary material, section 9).
Specific to women (n=34997), the pooled prevalence was 32.9% (95% CI: 27.1% - 38.4%) The pooled prevalence of hypertension in men (n=30025) was 35.4% (95% CI: 24.3% - 48.3%). Despite the difference in prevalence between men and women, it is not significant.
5.4.3. Age-Specific Prevalence
In 8 studies it was possible extract, or calculate, data by 3 stratum, <35, 35-64 and >65 (supplementary material, section 9).
Two of those are from local regions, Góis and Porto. The other ones are from continental Portugal (3 results) and Portugal as a whole (3 results).
Population in age group 15-34 years (n=30487) have a hypertension prevalence of 7.1% (95% CI: 3.8% - 12.8%). The same studies were used to calculate the prevalence in age group 35-64 (n=53720) that is 36.8% (CI: 35.2% - 38.4%). In the last age group, equal or above 65 years of age (n=24363), 8 studies were analyzed, but in this analyses Simões et al (2000) was excluded because people from this age group was not evaluated, and Canhão et al (2018) was included because the sample had 65 or more years of age. The hypertension prevalence estimate is 65.3% (95% CI: 56.5% - 73.0%). Overall it is possible to identify an increasing of hypertension prevalence with an advancing in age of the population.
18
5.4.4. Comparison per Decade
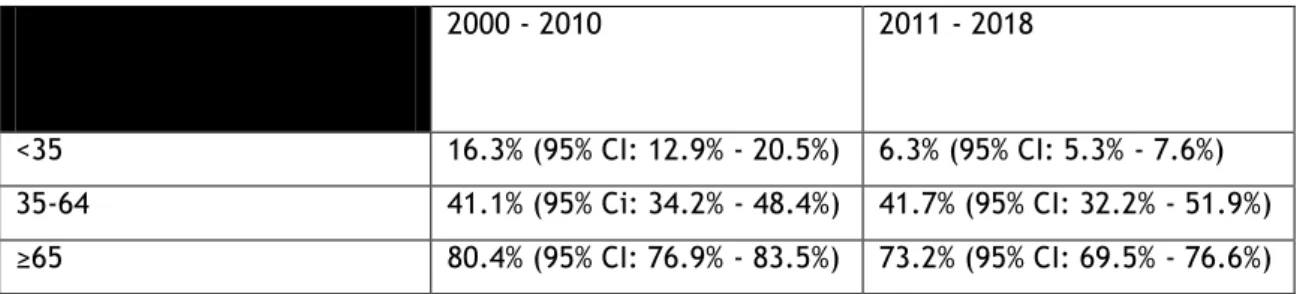
The comparison between decades is not statistically significant.
However, when analysed by type of recording BP it is possible to identify a decreasing trend in both younger (<35) and older (≥65) age groups over the period, which is statistically significant for PM.(59,60,62,65,67,69)
Table 4 - Hypertension Prevalence per Decade by age-group
2000 - 2010 2011 - 2018
<35 16.3% (95% CI: 12.9% - 20.5%) 6.3% (95% CI: 5.3% - 7.6%) 35-64 41.1% (95% Ci: 34.2% - 48.4%) 41.7% (95% CI: 32.2% - 51.9%) ≥65 80.4% (95% CI: 76.9% - 83.5%) 73.2% (95% CI: 69.5% - 76.6%)
19
Discussion
6.1.
Results
The result of the summary measure – hypertension prevalence - calculated in the present thesis is 33.0% (95% CI: 27.6% - 38.8%, I2: 45%). As described before (see page 8 Materials and
Methods section),we only included population-based studies with randomized and
non-specific population samples in order to have representative samples of the population considered in the articles assessed (regional, continental or national).
Other important findings demonstrate that when hypertension is SR the prevalence is higher in women. In other hand, among those in which hypertension is measured by automatic or mercury standard devices the prevalence is higher in men (Figure 2 and 3). This may demonstrate that women have better awareness about their health than men, what is in accordance with studies about hypertension awareness.(59,60,69)
In the studies with PM the summary measure was 37.1% (95% CI: 31.8% - 42.8%). This prevalence is higher than in studies with SR hypertension, 28.6% (95% CI: 23.6% - 34.3%). The huge difference in results among these 2 recording BP methods demonstrate that SR hypertension underestimate the prevalence of hypertension when compares to hypertension recorded with PM, which is also in accordance with other authors.(76) Scientific societies(13– 19) recommend that the physicians perform BP recording with PM in more than 1 visit or with out-of-office methodologies to determinate the BP. Thus, scientific studies must use PM methodology, with electronic device, and record BP in more than 1 visit or use an out-of-office measure and, therefore allow hypertension prevalence estimates more accurate.(75,77)
The meta-regression did not demonstrate a defined trend in hypertension prevalence over this century. However, when we analysed the studies with PM, stratified by age and gender, in two periods (2000-2010 and 2011-2018) we observe a statistically significant decrease in younger (<35) and older (≥65) age groups (Table 3).
In a systematic review about hypertension prevalence between 1990 and 2005(58), Pereira et
al demonstrate an increasing trend in all age-groups and both genders for SR hypertension
between 1990 and 2005, and also evidenced a decreasing in hypertension prevalence in middle and older age-groups. In the present systematic review we observe an increasing SR hypertension (Figure 6) in age-group >65 although the meta-regression per decade for studies with PM show us a different trend (Table 3).
In a pooled analysis of the Zhou B et al(51), including 1479 population based measurement studies with 19.1 million participants from all continents from 1975 to 2015, hypertension prevalence in 2015 was 24.1% in men and 20.1% in women, whereas in Portugal we identified 35.4% (95% CI: 24.3% - 48.3%) in men and 32.9% (95% CI: 27,1% - 38,4%) in women; if we just consider studies with PM the hypertension prevalence is 43.0% (95% CI: 38.0% - 48.2%) in men and in 35.5% (95% CI: 29.1% - 42.4%) women, what is considerable higher than Zhou et al
20
demonstrate to the world. The analyses from Zhou B et al served to WHO estimate global, regional and country prevalence for the year 2015. WHO referred the prevalence worldwide in 2015 was 22.1% and estimates 24.4% hypertension prevalence for Portugal(63), what is well below the estimates obtained in this analysis.
Figure 6 –Prevalence of SR hypertension by study and stratified by age-group
Hypertension prevalence in Portugal is lower than in China (44.7%)(78) and Russia (52%)(79), but higher than in USA (29%)(57), Mexico (31.5%)(80), Brazil (31%)(52), African Continent (30.8%)(81), India (29.8%)(55), South-Asia countries (27.1%)(82) and Australia (21%)(83). For European Continent, WHO estimates a hypertension prevalence of 23.2% for 2015(63), which is 10 points inferior compare to our findings. In other hand, Tolonen H et al(84) described the recent results of European Health Examination Survey (EHES) and concluded that in Europe 33.1% of men and 22.8% of women are hypertensive. The results by gender of the present meta-analyses re similar in men 35.4% (95% CI: 24.3% - 48.3%), but 11 points higher in women, 32.9% (CI: 27.11% - 39.4%).
A comparison with other European countries, we find lower prevalence’s of hypertension in Italy (25.1%)(85), Germany (31.8%)(86) and England (28.3%)(87). In other hand, Spain (42.6%)(88), Serbia (42.7%)(89), Estonia (36%)(90) and Romania (40.4%)(91) have studies demonstrating higher prevalence’s.
Nevertheless it should be emphasized that the use of different methodologies may play a crucial role in the prevalence estimates obtained.
6.2.
Strengths and Limitations
The strengths of this review result from the importance of the risk factor analysed, the public health importance and consequences of the recent results published in Portugal, which included population-based studies with probabilistic samples. We must also emphasize that
0 10 20 30 40 50 60 70
INE, 2000 INE, 2008 INE, 2016 Canhão, 2018
<35 35-64 >65 Total
21
the quantitative analyses performed give us an accurate summary measure for Portugal, which was not described before in the scientific literature.
Despite the number of studies for the summary measure being above the minimum recommendable to performed a meta-analysis(12), the number of studies across those 18 years is low, not all took into account the different regions, and data age-stratification was variable. The differences in recruitment strategy, type of BP recording, and the number of visits observed in the different studies, as well the quality of the data calculated by the author are other relevant limitations.
22
7. Conclusions
The present analyses enable us to conclude the following:
1) According to a meta-analysis of population-based studies, hypertension prevalence in Portugal on 21th is 33%;
2) Hypertension prevalence increases with age;
3) Hypertension prevalence among the elderly and in younger adults is lower in 2011-2018 studies when compared to studies from the first 2000 decade;
4) SR hypertension studies demonstrated a lower prevalence when compared to studies with PM, suggesting an under-estimation of hypertension by the SR method;
5) Further studies are needed to conclude about hypertension trends in Portugal in the 21st century;
As described, hypertension is a prevalent health problem of 21th century in Portugal.
Government policies, like salt-intake measures(92–94), are determinant to reverse this situation and improve Portuguese people health.
23
8. Bibliographic References
1. WHO | Hypertension. WHO. Available from:
http://www.who.int/topics/hypertension/en/
2. Harrison’s principles of internal medicine. 19th edition. Dennis L. Kasper et al. New York: McGraw Hill Education; 2015.
3. Bakris GL, Sorrentino MJ. Hypertension: a companion to Braunwald’s heart disease. 2018. 4. Lim SS, Vos T, Flaxman AD, Danaei G, Shibuya K, Adair-Rohani H, et al. A comparative risk assessment of burden of disease and injury attributable to 67 risk factors and risk factor clusters in 21 regions, 1990–2010: a systematic analysis for the Global Burden of Disease Study 2010. The Lancet. 2012 Dec;380(9859):2224–60.
5. GBD Results Tool | GHDx. Available from: http://ghdx.healthdata.org/gbd-results-tool 6. Kjeldsen SE, Narkiewicz K, Burnier M, Oparil S. The INTERSTROKE Study: hypertension is
by far the most important modifiable risk factor for stroke. Blood Press. 2017 May 4;26(3):131–2.
7. Yusuf S, Hawken S, Ôunpuu S, Dans T, Avezum A, Lanas F, et al. Effect of potentially modifiable risk factors associated with myocardial infarction in 52 countries (the INTERHEART study): case-control study. The Lancet. 2004 Sep;364(9438):937–52.
8. Kannel WB, Schwartz MJ, McNamara PM. Blood pressure and risk of coronary heart disease: the Framingham study. Dis Chest. 1969 Jul;56(1):43–52.
9. Friões F, Azevedo A, Castro A, Alvelos M, Pimenta J, Vazquez B, et al. Impact of cardiovascular risk factors in an urban sample of Portuguese adults according to the Framingham risk prediction models. Rev Port Cardiol Orgao Of Soc Port Cardiol Port J Cardiol Off J Port Soc Cardiol. 2003 Apr;22(4):511–20.
10. Forouzanfar MH, Afshin A, Alexander LT, Anderson HR, Bhutta ZA, Biryukov S, et al. Global, regional, and national comparative risk assessment of 79 behavioural, environmental and occupational, and metabolic risks or clusters of risks, 1990–2015: a systematic analysis for the Global Burden of Disease Study 2015. The Lancet. 2016 Oct;388(10053):1659–724.
11. Direção-Geral da Saúde I for HM and E. Portugal: The Nation’s Health 1990–2016: An overview of the Global Burden of Disease Study 2016 Results. Seattle, WA: IHME; 2018. 12. Higgins JPT, Green S, Cochrane Collaboration, editors. Cochrane handbook for systematic
reviews of interventions. Chichester, England ; Hoboken, NJ: Wiley-Blackwell; 2008. 13. WHO. A global brief on Hypertension. WHO; 2013. Available from:
http://www.who.int/campaigns/world-health-day/2013/en/
14. Mancia G, Fagard R, Narkiewicz K, Redón J, Zanchetti A, Böhm M, et al. 2013 ESH/ESC Guidelines for the management of arterial hypertension: The Task Force for the management of arterial hypertension of the European Society of Hypertension (ESH) and of the European Society of Cardiology (ESC). J Hypertens. 2013 Jul;31(7):1281–357. 15. Simão A, Precoma D, Andrade J, Correa Filho H, Saraiva J, Oliveira G, et al. I Diretriz
24
16. National Heart Foundation of Australia, National Blood Pressure and Vascular DiseaseAdvisory Committee. Guideline for the diagnosis and management of hypertension in adults. 2016.
17. Seedat YK, Rayner BL, Veriava Y. South African hypertension practice guideline 2014 : review article. Cardiovasc J Afr. 2014 Dec 11;25(6):288–94.
18. The Japanese Society of Hypertension Guidelines for the Management of Hypertension. Hypertens Res. 2014 Apr;37(4):266–78.
19. Direção-Geral da Saúde. Norma 020/2011 Hipertensão Arterial: definição e classificação. Lisboa: DGS; 2013 Mar.
20. Law MR, Wald NJ. Risk factor thresholds: their existence under scrutiny. BMJ. 2002 Jun 29;324(7353):1570–6.
21. Lewington S, Clarke R, Qizilbash N, Peto R, Collins R, Prospective Studies Collaboration. Age-specific relevance of usual blood pressure to vascular mortality: a meta-analysis of individual data for one million adults in 61 prospective studies. Lancet Lond Engl. 2002 Dec 14;360(9349):1903–13.
22. Soffer A, Muiesan G, Chavez-Rivera I, Leite-Luna R. Caracterização e Avaliação do Doente Hipertenso em Risco. Sociedade Portuguesa de Cardiologia. 1978. 97 p.
23. Whelton PK, Carey RE, Aronow WS, Casey DE, Collins KJ, Dennison Himmelfarb C, et al. ACC/AHA/AAPA/ABC/ACPM/AGS/APhA/ASH/ASPC/NMA/PCNA guideline for the prevention, detection, evaluation, and management of high blood pressure in adults: a report of the American College of Cardiology/American Heart Association Task Force on Clinical Practice Guidelines. Hypertension; 2017.
24. Bonita R, Beaglehole R, Kjellström T. Basic epidemiology. 2. ed. Geneva: World Health Organization; 2006. 212 p.
25. WHO | Risk factors. WHO. Available from: http://www.who.int/topics/risk_factors/en/ 26. Carlsson AC, Wandell PE, de Faire U, Hellenius M-L. Risk Factors Associated With Newly
Diagnosed High Blood Pressure in Men and Women. Am J Hypertens. 2008 Jul 1;21(7):771– 7.
27. Dogan N, Toprak D, Demir S. Hypertension prevalence and risk factors among adult population in Afyonkarahisar region: a cross-sectional research. Anadolu Kardiyol Derg Anatol J Cardiol. 2012; Available from: http://anatoljcardiol.com/jvi.aspx?un=AJC-48734 28. Mc Donald Posso AJ, Motta Borrel JA, Fontes F, Cruz Gonzalez CE, Pachón Burgos AA,
Cumbrera Ortega A. High Blood Pressure in Panama: Prevalence, Sociodemographic and Biologic Profile, Treatment, and Control (STROBE). Medicine (Baltimore). 2014 Nov;93(22):e101.
29. Davarian S, Crimmins E, Takahashi A, Saito Y. Sociodemographic Correlates of Four Indices of Blood Pressure and Hypertension among Older Persons in Japan. Gerontology. 2013;59(5):392–400.
30. Ntuli ST, Maimela E, Alberts M, Choma S, Dikotope S. Prevalence and associated risk factors of hypertension amongst adults in a rural community of Limpopo Province, South Africa. Afr J Prim Health Care Fam Med. 2015;7(1). Available from: https://phcfm.org/index.php/phcfm/article/view/847
25
31. Balijepalli C, Bramlage P, Lösch C, Zemmrich C, Humphries KH, Moebus S. Prevalence and control of high blood pressure in primary care-results from the German metabolic and cardiovascular risk study (GEMCAS). Hypertens Res. 2014 Jun;37(6):580–4.
32. Lackland DT. Racial Differences in Hypertension: Implications for High Blood Pressure Management. Am J Med Sci. 2014 Aug;348(2):135–8.
33. Ganesh SK, Tragante V, Guo W, Guo Y, Lanktree MB, Smith EN, et al. Loci influencing blood pressure identified using a cardiovascular gene-centric array. Hum Mol Genet. 2013 Apr 15;22(8):1663–78.
34. Levy D, DeStefano AL, Larson MG, O’Donnell CJ, Lifton RP, Gavras H, et al. Evidence for a Gene Influencing Blood Pressure on Chromosome 17 : Genome Scan Linkage Results for Longitudinal Blood Pressure Phenotypes in Subjects From the Framingham Heart Study. Hypertension. 2000 Oct 1;36(4):477–83.
35. Giorgini P, Di Giosia P, Grassi D, Rubenfire M, Brook RD, Ferri C. Air Pollution Exposure and Blood Pressure: An Updated Review of the Literature. Curr Pharm Des. 2016;22(1):28– 51.
36. Pereira M, Lunet N, Paulo C, Severo M, Azevedo A, Barros H. Incidence of hypertension in a prospective cohort study of adults from Porto, Portugal. BMC Cardiovasc Disord.
2012;12(1). Available from:
http://bmccardiovascdisord.biomedcentral.com/articles/10.1186/1471-2261-12-114 37. Naing C, Aung K. Prevalence and Risk Factors of Hypertension in Myanmar: A Systematic
Review and Meta-Analysis. Medicine (Baltimore). 2014 Nov;93(21):e100.
38. Stamler J, Rose G, Elliott P, Dyer A, Marmot M, Kesteloot H, et al. Findings of the International Cooperative INTERSALT Study. Hypertension. 1991 Jan 1;17(1_Suppl):I9–I9. 39. Subasinghe AK, Arabshahi S, Busingye D, Evans RG, Walker KZ, Riddell MA, et al.
Association between salt and hypertension in rural and urban populations of low to middle income countries: a systematic review and meta-analysis of population based studies. Asia Pac J Clin Nutr. 2016 Jun;25(2):402–13.
40. Rosenthal T, Alter A. Occupational stress and hypertension. J Am Soc Hypertens. 2012 Jan;6(1):2–22.
41. World Health Organization, editor. Global health risks: mortality and burden of disease attributable to selected major risks. Geneva, Switzerland: WHO; 2009. 62 p.
42. WHO | Cardiovascular diseases (CVDs). WHO. Available from: http://www.who.int/cardiovascular_diseases/en/
43. Mathers C, Fat DM, Boerma JT, World Health Organization, editors. The global burden of disease: 2004 update. Geneva, Switzerland: World Health Organization; 2008. 146 p. 44. WHO | Global Health Estimates. Available from:
http://www.who.int/healthinfo/global_burden_disease/en/
45. Programa Nacional para as Doenças Cérebro-cardiovasculares. DGS; 2017.
46. Doenças cardiovasculares matam 35 mil portugueses por ano – Observador. Available from: https://observador.pt/2017/09/29/doencas-cardiovasculares-matam-35-mil-portugueses-por-ano/
26
48. Danaei G, Finucane MM, Lin JK, Singh GM, Paciorek CJ, Cowan MJ, et al. National, regional, and global trends in systolic blood pressure since 1980: systematic analysis of health examination surveys and epidemiological studies with 786 country-years and 5·4 million participants. The Lancet. 2011 Feb;377(9765):568–77.
49. Kearney PM, Whelton M, Reynolds K, Muntner P, Whelton PK, He J. Global burden of hypertension: analysis of worldwide data. The Lancet. 2005 Jan;365(9455):217–23. 50. Mills KT, Bundy JD, Kelly TN, Reed JE, Kearney PM, Reynolds K, et al. Global Disparities
of Hypertension Prevalence and ControlClinical Perspective: A Systematic Analysis of Population-Based Studies From 90 Countries. Circulation. 2016 Aug 9;134(6):441–50. 51. Zhou B, Bentham J, Di Cesare M, Bixby H, Danaei G, Cowan MJ, et al. Worldwide trends in
blood pressure from 1975 to 2015: a pooled analysis of 1479 population-based measurement studies with 19·1 million participants. The Lancet. 2017 Jan;389(10064):37– 55.
52. Picon RV, Fuchs FD, Moreira LB, Riegel G, Fuchs SC. Trends in Prevalence of Hypertension in Brazil: A Systematic Review with Meta-Analysis. Baradaran HR, editor. PLoS ONE. 2012 Oct 31;7(10):e48255.
53. Fang L, Song J, Ma Z, Zhang L, Jing C, Chen D. Prevalence and characteristics of hypertension in mainland Chinese adults over decades: a systematic review. J Hum Hypertens. 2014 Nov;28(11):649–56.
54. Sarki AM, Nduka CU, Stranges S, Kandala N-B, Uthman OA. Prevalence of Hypertension in Low- and Middle-Income Countries: A Systematic Review and Meta-Analysis. Medicine (Baltimore). 2015 Dec;94(50):e1959.
55. Anchala R, Kannuri NK, Pant H, Khan H, Franco OH, Di Angelantonio E, et al. Hypertension in India: a systematic review and meta-analysis of prevalence, awareness, and control of hypertension. J Hypertens. 2014 Jun;32(6):1170–7.
56. Ataklte F, Erqou S, Kaptoge S, Taye B, Echouffo-Tcheugui JB, Kengne AP. Burden of Undiagnosed Hypertension in Sub-Saharan Africa: A Systematic Review and Meta-Analysis. Hypertension. 2015 Feb 1;65(2):291–8.
57. Fryar C, Ostchega Y, Hales C, Zhang G, Kruszon-Moran D. Hypertension prevalence and control among adults: United States, 2015–2016. NHCS data brief, no 289. Hyattsville: MD: National Center for Health Statistics; 2017.
58. Pereira M, Carreira H, Vales C, Rocha V, Azevedo A, Lunet N. Trends in hypertension prevalence (1990–2005) and mean blood pressure (1975–2005) in Portugal: a systematic review. Blood Press. 2012 Aug;21(4):220–6.
59. Macedo ME, Lima MJ, Silva AO, Alcantara P, Ramalhinho V, Carmona J. Prevalence, awareness, treatment and control of hypertension in Portugal: the PAP study. J Hypertens. 2005 Sep;23(9):1661–6.
60. Polonia J, Martins L, Pinto F, Nazare J. Prevalence, awareness, treatment and control of hypertension and salt intake in Portugal: changes over a decade. The PHYSA study. J Hypertens. 2014 Jun;32(6):1211–21.
61. Macedo ME, Ferreira RC. A Hipertensão Arterial nos Cuidados de Saúde Primários, em Portugal: contibuto para o conhecimento epidemiológico da população em 2013. Factores Risco. 2015 Jun;(36):47–56.
62. Barreto M, Gaio V, Kislaya I, Antunes L, Rodrigues AP, Silva AC, et al. 1o Inquérito
27
63. GHO | By indicator | Raised blood pressure (SBP>=140 OR DBP>=90) (age-standardized estimate) (Global Dementia Observatory (GDO)). WHO. Available from: http://apps.who.int/gho/data/node.imr.BP_04?lang=en
64. von Elm E, Altman DG, Egger M, Pocock SJ, Gøtzsche PC, Vandenbroucke JP, et al. The Strengthening the Reporting of Observational Studies in Epidemiology (STROBE) statement: guidelines for reporting observational studies. Ann Intern Med. 2007 Oct 16;147(8):573–7.
65. Simões JA, Gama ME, Contente CB. Prevalence of cardiovascular risk factors in a rural population between 25 and 44 years old. Rev Port Cardiol Orgao Of Soc Port Cardiol Port J Cardiol Off J Port Soc Cardiol. 2000 Jun;19(6):693–703.
66. Perdigão C, Rocha E, Duarte JS, Santos A, Macedo A. Prevalence and distribution of the main cardiovascular risk factors in Portugal--the AMALIA study. Rev Port Cardiol Orgao Of Soc Port Cardiol Port J Cardiol Off J Port Soc Cardiol. 2011 Apr;30(4):393–432.
67. Cunha PG, Cotter J, Oliveira P, Vila I, Sousa N. An epidemiological study determining blood pressure in a Portuguese cohort: the Guimarães/Vizela study. J Hum Hypertens. 2015 Mar;29(3):190–7.
68. Rodrigues AM, Gregório MJ, Sousa RD, Dias SS, Santos MJ, Mendes JM, et al. Challenges of Ageing in Portugal: Data from the EpiDoC Cohort. Acta Med Port. 2018 Feb 28;31(2):80– 93.
69. Pereira M, Azevedo A, Barros H. Determinants of awareness, treatment and control of hypertension in a Portuguese population. Rev Port Cardiol Orgao Of Soc Port Cardiol Port J Cardiol Off J Port Soc Cardiol. 2010 Dec;29(12):1779–92.
70. Inquérito Nacional de Saúde 1998-1999. Instituto Nacional de Saúde Doutor Ricardo Jorge. Lisboa: Instituto Nacional de Estatística; 2000.
71. Inquérito Nacional de Saúde 2005/2006. Instituto Nacional de Saúde Doutor Ricardo Jorge. Lisboa: Instituto Nacional de Estatística; 2008.
72. Inquérito Nacional de Saúde 2014. Instituto Nacional de Estatística; 2016.
73. Stroup DF, Berlin JA, Morton SC, Olkin I, Williamson GD, Rennie D, et al. Meta-analysis of observational studies in epidemiology: a proposal for reporting. Meta-analysis Of Observational Studies in Epidemiology (MOOSE) group. JAMA. 2000 Apr 19;283(15):2008– 12.
74. Saúde - 700 mil portugueses sem médico de família tiram o sono a secretário de Estado. Available from: https://www.dn.pt/portugal/interior/700-mil-portugueses-sem-medico-de-familia-tiram-o-sono-a-secretario-de-estado-9058906.html
75. Piper MA, Evans CV, Burda BU, Margolis KL, O’Connor E, Smith N, et al. Screening for High Blood Pressure in Adults: A Systematic Evidence Review for the U.S. Preventive Services Task Force. Rockville (MD): Agency for Healthcare Research and Quality (US); 2014. (U.S. Preventive Services Task Force Evidence Syntheses, formerly Systematic Evidence Reviews). Available from: http://www.ncbi.nlm.nih.gov/books/NBK269495/
76. Tolonen H, Koponen P, Mindell JS, Mannisto S, Giampaoli S, Dias CM, et al. Under-estimation of obesity, hypertension and high cholesterol by self-reported data: comparison of self-reported information and objective measures from health examination surveys. Eur J Public Health. 2014 Dec 1;24(6):941–8.