Universidade do Algarve
Faculdade de Ciências e Tecnologia
Development of a commercial microalgae enrichment of live feed for
zebrafish
Matthew Bernt Castaldi
Supervisors
Prof. Dr. Paulo Gavaia Centro de Ciências do Mar Universidade do Algarve, Faro, Portugal
&
Prof. Dr. João Varela
Universidade do Algarve, Faro, Portugal
Dissertation
Master of Aquaculture and Fisheries
Dissertação
Mestre em Aquacultura e Pescas com especialização em Aquacultura
iii
Universidade do Algarve
Faculdade de Ciências e Tecnologia
Development of a commercial microalgae enrichment of live feed for
zebrafish
Matthew Bernt Castaldi
Supervisors
Prof. Dr. Paulo Gavaia Centro de Ciências do Mar Universidade do Algarve, Faro, Portugal
&
Prof. Dr. João Varela
Universidade do Algarve, Faro, Portugal
Dissertation
Master of Aquaculture and Fisheries
Dissertação
Mestre em Aquacultura e Pescas com especialização em Aquacultura
iv
Mestrado: Aquacultura e Pescas
Título: Development of a commercial microalgae enrichment of live feed for zebrafish
Autoria: Matthew Bernt Castaldi
Declaração de autoria de trabalho
Declaro ser o (a) autor (a) deste trabalho, que é original e inédito. Autores e trabalhos consultados estão devidamente citados no texto e constam da listagem de referências incluída.
_________________________________________________ (Matthew Bernt Castaldi)
Copyright
Matthew Bernt Castaldi
A Universidade do Algarve tem o direito, perpétuo e sem limites geográficos, de arquivar e publicitar este trabalho através de exemplares impressos reproduzidos em papel ou de forma digital, ou por qualquer outro meio conhecido ou que venha a ser inventado, de o divulgar através de repositórios científicos e de admitir a sua cópia e distribuição com objectivos educacionais ou de investigação, não comerciais, desde que seja dado crédito ao autor e editor.
v
Acknowledgements
I would like to thank all of those who helped me along the way to complete this thesis. Firstly, I would like to thank Gil Martins, Hugo Pereira and Tamara Santos for spending so much of their time helping me to complete all of the experiments, results and writings. I could not have completed any of this without their support. Secondly, I would like to thank my advisors, Dr. Paulo Gavaia and Dr. João Varela for their support and hours reviewing my work as well as giving me the opportunity to participate in this research.
A thank you to everyone in the BIOSKEL and MARBIOTECH labs for helping daily to complete tasks and entertain me. Thank you to Alessio Carletti for showing me many times how to use the imaging programs in the labs and taking some photos for me when I left Portugal. To Patricia Diogo for reviewing my work and helping me with statistics. To Vera Gomes for her hours helping analyze all of my samples. As well as Gil Martins and Leonor Esquilo Ferrão, for helping me write my summary in Portuguese. Thank you to Necton® for providing me with microalgae.
Also, to my family and friends, especially my parents, who have helped me in all ways throughout this journey, I would not be at this point without their love and support.
vi
Resumo
O peixe zebra (Danio rerio) é uma espécie modelo usado em institutos de investigação mundialmente devido às suas inumeras vantagens. Esta espécie tem a capacidade de viver em diversos tipos de ambientes. Estes foram encontrados em temperaturas que variam entre 6.7 - 41.7° C e em salinidades tão baixas entre 5 partes por milhar (ppt). Esta espécie é usada numa larga variedade de campos incluindo toxicologia, aquacultura, evolução, nutrição e doenças ósseas.
Um dos grandes problemas associado ao peixe zebra remete para as suas necessidades nutricionais não são ainda conhecidas. Em investigação tais como para outras espécies modelos e importante reportar a dieta usada sendo que este não e o caso para o peixe zebra. Estes são alimentados com uma variedade de dietas de diversas origens o consequentemente afeta os resultados experimentais. Para uma confiança nos resultados científicos é importante investigar as necessidades nutricionais para esta espécie.
Usualmente no início, os rotíferos são usados na alimentação do peixe zebra sendo depois efetuada transição para a alimentação seca. Os rotíferos são uma presa adequada por causa do seu pequeno tamanho, velocidade lenta, e capacidade de dispersão na coluna de água. O valor nutricional dos rotíferos depende de tipo de enriquecimento usado, sendo, as microalgas comumente usadas para tal efeito. As microalgas têm um adequado valor nutricional, rico em proteínas, lípidos, minerais e perfil de ácidos gordos e aminos ácidos. Para maximizar o valor nutricional o ‘blending’ e uma técnica que visa uma mistura de microalgas para se proceder ao enriquecimento de rotíferos. Uma mistura de microalgas promove um balanço de ácidos gordos e amino ácidos que se visa melhorar as taxas de cumprimento, peso e sobrevivência. Este estudo teve como objectivo devolver um novo produto de enriquecimento para peixe zebra de forma a maximizar as taxas de cumprimento, peso, sobrevivência e minimizar a incidência de
deformações esqueléticas.
Para tal, um conjunto de três desenhos experimentais foram elaborados. No primeiro e segundo desenho experimental um conjunto de 8 tratamentos foram usados, para o terceiro desenho experimental um conjunto de 6 tratamentos foram usados. Em cada desenho experimental uma microdieta - Zebrafeed®- foi utilizada como controlo. Aos 15 e 30 dpf, as taxas de comprimento, peso, sobrevivência foi analizadas. No primeiro desenho experimental,
vii análises histológicas do trato digestivo foram elaboradas aos 15 e 30 dpf. Em todos os desenhos experimentais a incidência de deformações esqueléticas foi feita com indivíduos colhidos aos 30 dpf. Foi feita a análise bioquímica das proteínas totais, lipídos totais, carbohidratos totais, cinzas totais e ester metílico de ácidos gordos (FAME), para as microalgas e rotíferos enriquecidos de todos os desenhos experimentais. Para o segundo e terceiro desenhos experimentais, além da análise bioquímica, o conteúdo em minerais foi analisado para os rotíferos e larvas de peixe zebra.
O primeiro desenho experimental visou a determinação de qual tipo de enriquecimento, pasta ou liofilizados, no enriquecimento de rotíferos e a performance de larvas de peixe zebra. Três espécies de microalgas foram avaliadas: Nannochloropsis sp., Isochrysis sp., e Tetraselmis sp. Foram um tratamento que usou rotiforos enriquecidos com Nannochloropsis sp. em
salinidade de 10 ppt. O tratamento com a pasta de Nannochloropsis sp. apresentou os melhores resultados em termos de taxas de cumprimento, peso e sobrevivência. Devido ao comportamento e dissolução da pasta comparativamente ao liofilizado, o segundo e terceiro desenhos
experimentais foram feitas somente com pasta de microalgas.
O segundo desenho experimental investigou quais as microalgas como melhor interesse para inclusão numa mistura de microalgas. Um total de 8 tratamentos foram compreendo o uso de 7 microalgas: as microalgas foram Nannochloropsis sp, Isochrysis sp., Tetraselmis sp.,
Spirulina sp., Skeletonema sp., Phaeodactylum sp. and Chaetoceros sp. Neste desenho
experimental, as microalgas Isochrysis sp. e Tetraselmis sp. diferiram de espécie. No final do desenho experimental, os peixes alimentados com rotíferos enriquecidos com Nannochloropsis sp. mostraram melhores taxas de comprimento, peso, sobrevivência e com menos deformações esqueléticas. Os grupos alimentados com rotíferos enriquecidos com Skeletonema sp. tive menos deformidades esqueleticas mas nao era significativo menos que o grupo que foram alimentados com rotiferos enriquecidos com Nannochloropsis sp.. Os grupos alimentados com rotíferos enriquecidos com Isochrysis sp., Tetraselmis sp. e Spirulina sp., obtiveram um bom desempenho e com um aumento do valor nutricional.
No terceiro desenho experimental, além da microdieta Zebrafeed® e Nannochloropsis sp., três misturas de microalgas e um tratamento de alimentação combinada de rotíferos e microdieta. A mistura combinada compreendeu a alimentação de larvas com rotíferos enriquecidos com
viii
Nannochloropsis sp. e Zebrafeed® entre os 5-8 dpf e depois somente com microdieta Zebrafeed®.
Os tratamentos com rotíferos enriquecidos com as misturas de microalgas obtiveram bons despenhos em termos de taxa de comprimento, peso, sobrevivência e deformações esqueléticas. No entanto, sem diferenças comparativamente ao grupo enriquecido com Nannochloropsis sp. Os rotíferos enriquecidos com misturas de microalgas obtiveram um bom valor nutricional relativamente aos ácidos gordos essenciais e importantes minerais, como Ca e Sr.
O tratamento de co-feeding tive problemas em termos de deformidades esqueléticas. Neste grupo, os peixes exhibiu muitas deformidades incluindo ‘scoliosis’ e ‘kyphosis’. É uma possibilidade que o peixe zebra deve ser alimentado com rotíferos até pelo menos 15 dpf para minimizar deformidades esqueléticas.
Este trabalho indica que o enriquecimento com uma mistura de microalga é mais apropriado para um melhor desenvolvimento do peixe zebra, sendo por isso um avanço na compreensão das necessidades nutricionais. Uma mistura boa mistura deve ter uma relação de
n-3:n-6 PUFAs entre 0.42-0.81 com um perfil bem de ácidos gordos rico em arachidonic acid e
eicosapentaenoic acid. Esse enriquecimento deve ter uma quantidade de proteína entre 34-59% e ser alto em todos os aminoácidos essenciais. O perfil meneral também é importante, essa mistura deve ter uma relação de Ca:P baixa e ser rica em Sr. Numa próxima abordagem, seria importante investigar outras espécies de microalgas, com varias quantidades na mistura e investigar o perfil de aminoácidos.
Este trabalho contribui com avanços para a determinação dos requisitos nutricionais do peixe zebra. Os resultados obtidos evidenciam que o enriquecimento com mistura de microalgas apresenta benefícios no desenvolvimento do peixe zebra. Futuros estudos deverão avaliar o potencial de outras espécies de microalgas, como a sua contribuição para a formulação de misturas de microalgas.
Palavras-chave: Peixe zebra; Microalga; Rotíferos; Nutrição; Deformidades esqueléticas;
ix
Abstract
Zebrafish (Danio rerio) is a model species used in research facilities worldwide because of its many advantageous qualities. Although this species is used in many labs, the research community has not implemented a strict dietary standard, as done with other model species. This dietary variation effects experimental results and impedes the
replicability of studies. The aim of this research was to develop a microalgae enrichment blend for live feeds to maximize growth and skeletal development while gaining a better understanding of zebrafish larvae nutritional needs. To achieve these goals, three
experimental trials were performed. The first investigated whether a microalgal paste or powder had an effect on zebrafish growth. The second was done to identify promising microalgae species to include in an enrichment blend. The third study incorporated five microalgae species combined into blended enrichments to see which blends maximized growth parameters and minimized skeletal deformities. Frozen microalgae pastes were chosen, as they exhibited better growth and are cheaper to produce. In trial two, five microalgae Nannochloropsis sp., Isochrysis sp., Tetraselmis sp., Spirulina sp. and
Skeletonema sp. were selected due to their proximal compositions, results in growth trials
and effect on skeletal development. In the first two trials, zebrafish fed rotifers enriched with Nannochloropsis sp. alone or combined performed better than all other treatments in length, weight, survival and skeletal deformities In trial three, rotifers enriched with microalgae blends had a more complete nutritional profile than those enriched with single microalga. Diet A which combined Nannochloropsis sp., Isochrysis sp. and Tetraselmis sp. had the lowest incidence of severe deformities, and all fish fed rotifers enriched with microalgae blends preformed similarly in terms of length, weight and survival. Zebrafish given rotifers with microalgae blends had lower standard deviation between
quadruplicates regarding length and performed as well as those given Nannochloropsis sp. enriched rotifers. Although fish given rotifers enriched with microalgae blends did not significantly outperform those given Nannochloropsis sp. in terms of length, weight, survival and skeletal deformities, it provides a starting point for further experiments with altered blend recipes.
xi List of Abbreviations Kg - kilogram g - gram L - litre ml – milliliter µl – microliter m - meter cm - centimeter mm – millimeter µm - micrometer h - hour min - minutes s- second
ppt – parts per thousand DW – dry weight
°C – temperature measurement in Celsius degrees dpf – days post fertilization
TL – total length SL – standard length SFA – saturated fatty acid UFA – unsaturated fatty acid
MUFA – monounsaturated fatty acid PUFA – polyunsaturated fatty acid FA – Fatty acid
n – omega
LA – linoleic acid LNA – linolenic acid EFA – essential fatty acid EPA – eicosapentaenoic acid ARA - arachidonic acid
xii DHA – docosahexaenoic acid
FAD – fatty acid desaturase
Z-FAD – zebrafish fatty acid desaturase AA – amino acid
IDAA – indispensable amino acid DAA – dispensable amino acid FAA – free amino acid
HUFA – highly unsaturated fatty acid dpf – days post fertilization
PFA – paraformaldehyde
PBS – phosphate-buffered saline
EDTA – ethylenediaminetetraacetic acid KOH – potassium hydrozide
GC-MS gas chromatography with mass spectra FAME – Fatty Acid Methyl Ester
TFA – total fatty acid CHO – carbohydrates
NPA – Nannochloropsis sp. paste NPO – Nannochloropsis sp. powder IPO – Isochrysis sp. powder
IPA – Isochrysis sp. paste TPO – Tetraselmis sp. powder TPA – Tetraselmis sp. paste IE2 – Isochrysis sp. experiment 2 TE2 – Tetraselmis sp. experiment 2 SPIRULI – Spirulina sp.
SKEL – Skeletonema sp. PHAEO – Phaeodactylum sp. CHC – Chaetoceros sp. A – enrichment blend A
xiii B – enrichment blend B
xiv
Contents
Resumo ... vi
Abstract ... ix
List of Abbreviations ... xi
List of Figures ... xvi
List of Tables ... xxiii
1. Introduction ... 1 1.1 Zebrafish ... 1 1.1.2 Zebrafish Nutrition ... 2 1.2 Nutrients ... 3 1.2.1 Lipids ... 3 1.2.2 Protein ... 5 1.2.3 Minerals ... 7 1.2.4 Vitamins ... 8 1.2.5 Zebrafish Diet ... 8 1.3 Rotifers ... 8 1.4 Microalgae ... 10 1.4.1 Microalgae as Enrichments ... 11 2. Objectives ... 12
3. Materials and Methods ... 12
3.1 Live Microalgae Culture ... 12
3.2 Microalgae Enrichment ... 12
3.3 Rotifer Culture ... 13
3.3.1 Enrichments ... 14
3.3.2 Rotifer Collection for Biochemical Analysis ... 15
3.4 Zebrafish ... 16
3.5 Histology ... 18
3.6 Length, Weight, Survival and Condition Factor ... 20
3.7 Alcian blue and Alizarin red S Double Staining ... 20
3.8 Skeletal Analysis ... 21
3.9 Biochemical Analysis ... 22
3.9.1 Proteins (CHN) ... 22
xv
3.9.3 Fatty acid methyl esters (FAME)... 23
3.9.4 Ash ... 24
3.9.5 Minerals ... 24
4. Results ... 25
4.1. Trial 1: Discrepancies Between Paste and Powder Enrichments. ... 25
4.1.1 Trial 1 Microalgae and Rotifer Proximal Composition ... 25
4.1.2 Trial 1 Fatty Acids Methyl Esters (FAME) of Microalgae, Diet and Enriched Rotifers. .. 26
4.1.3 Trial 1 Length, Weight, Survival and Condition Factor ... 28
4.1.4 Histology ... 32
4.2 Trial 2 Investigation of Promising Microalgae Species for Use with Zebrafish ... 34
4.2.1 Microalgae and Rotifer Proximal Composition ... 34
4.2.2 Fatty Acids Methyl Esters (FAME) of Microalgae, Diet and Enriched Rotifers. ... 35
4.2.3 Mineral Analysis of Enriched Rotifers and Zebrafish ... 37
4.2.4 Length, Weight, Survival and Condition Factor ... 39
4.2.5 Skeletal Deformities ... 43
4.3 Trial 3: Development of Blended Enrichment Formulas ... 48
4.3.1 Microalgae and Rotifer Proximal Composition ... 48
4.3.4 Length, Weight, Survival and Condition Factor ... 52
4.3.5 Skeletal Deformities ... 56
5. Discussion... 61
5.1 Diet and Live Feed ... 61
5.2 Microalgal Paste vs Powder ... 62
5.3 Microalgae Selection ... 63
5.4 Fatty Acids Methyl Esters (FAME) ... 66
5.5 Proteins ... 69 5.6 Minerals ... 71 5.7 Co-fed (CF) ... 73 6. Conclusions ... 75 7. Annex: 1 ... 77 8. References ... 84
xvi
List of Figures
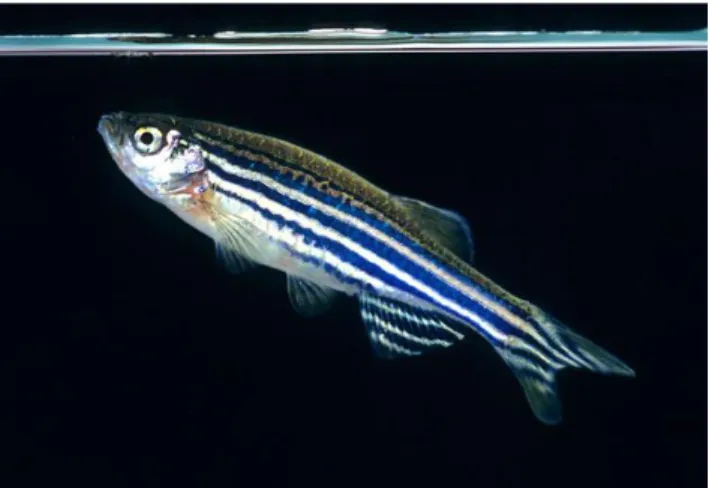
Figure 1 - Zebrafish (Danio rerio) (socmucimm.org, 2014).
Figure 2 - Schematic representation of conversion process of Linoleic acid (LA) and α-Linolenic
acid (ALA) to arachidonic acid (ARA), eicosapentaenoic acid (EPA) and docasahexaenoic acid (DHA) (Extension, 2012).
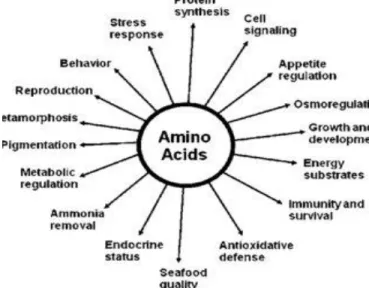
Figure 3 - Functions of amino acids in fish nutrition from Li et al. (2009).
Figure 4 - Left: Saltwater rotifer Brachionus plicatilis diagram (Henry et al., 2016). Right: Rotifer
with microalgae enrichment (Easy Reefs, 2019).
Figure 5 - Nannochloropsis sp. microalgae. (Algae Research Supply, 2019)
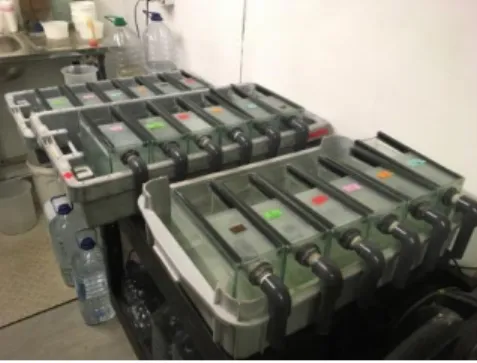
Figure 6 - Rotifers in 1.5 L enrichment bottles for trial 3. From left to right enrichments using
Nannochloropsis sp., blend A (Nannochloropsis sp., Isochrysis sp., Tetraselmis sp.), blend B
(Nannochloropsis sp., Isochrysis sp., Tetraselmis sp., Spirulina sp.) and blend C (Nannochloropsis sp., Isochrysis sp., Tetraselmis sp., Skeletonema sp.).
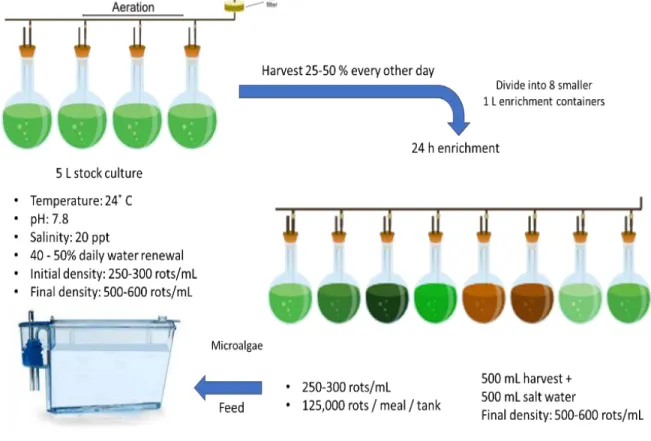
Figure 7 - General scheme of rotifer production and enrichment used in experiments.
Figure 8 - 3 L larval rearing tanks set up in plastic bins with heater (not seen).
Figure 9 - General scheme of rotifer and zebrafish culture conditions as well as analysis done
throughout experiment.
Figure 10 - Anterior gut section of zebrafish given rotifers enriched with Nannochloropsis sp.
using hematoxylin and eosin.
Figure 11 - 30 days post fertilization (dpf) zebrafish stained using alcian blue and alizarin red.
Figure 12 - Zebrafish axial skeleton diagram. Centra are in black, the Weberian apparatus is green,
supraneurals are light blue, precaudal vertebrae are red, dorsal and anal fin endoskeletons are blue, caudal vertebrae are orange and caudal fin vertebrae is purple (Bird and Mabee, 2003).
xvii
Figure 14 - Zebrafish pre (left) and post (right) digestion using nitric acid (NHO3) and hydrogen peroxide (H2O2).
Figure 15 - Zebrafish total length at 15 and 30 day post fertilization (dpf). Letters indicate
significant difference using one-way ANOVA with Tukey’s Test (p ≤ 0.05) (n = 10). ZF- Zebrafeed®; NPA – Fish fed rotifers enriched with Nannochloropsis sp. Paste; NPA 10 ppt – Fish fed rotifers enriched with Nannochloropsis sp. reared at 10 parts per thousand (ppt); NPO – Fish fed rotifers enriched with Nannochloropsis sp. Powder; IPA - Fish fed rotifers enriched with
Isochrysis sp. Paste; IPO – Fish fed rotifers enriched with Isochrysis sp. Powder; TPA – Fish fed
rotifers enriched with Tetraselmis sp. Paste; TPO – Fish fed rotifers enriched with Tetraselmis sp. Powder.
Figure 16 - Dry weight of fish from trial 1, at 15 and 30 dpf. Letters indicate significant difference
using Chi-Square test (p ≤ 0.05) (n =10). ZF- Zebrafeed®; NPA – Fish fed rotifers enriched with
Nannochloropsis sp. Paste; NPA 10 ppt – Fish fed rotifers enriched with Nannochloropsis sp.
reared at 10 parts per thousand (ppt); NPO – Fish fed rotifers enriched with Nannochloropsis sp. Powder; IPA - Fish fed rotifers enriched with Isochrysis sp. Paste; IPO – Fish fed rotifers enriched with Isochrysis sp. Powder; TPA – Fish fed rotifers enriched with Tetraselmis sp. Paste; TPO – Fish fed rotifers enriched with Tetraselmis sp. Powder.
Figure 17 - Zebrafish survival in Trial 1, at 15 and 30 dpf (n = 100). Letters indicate significant
differences using one-way ANOVA with Tukey’s Test (p ≤ 0.05). ZF- Zebrafeed®; NPA – Fish
fed rotifers enriched with Nannochloropsis sp. Paste; NPA 10 ppt – Fish fed rotifers enriched with
Nannochloropsis sp. reared at 10 parts per thousand (ppt); NPO – Fish fed rotifers enriched with Nannochloropsis sp. Powder; IPA - Fish fed rotifers enriched with Isochrysis sp. Paste; IPO – Fish
fed rotifers enriched with Isochrysis sp. Powder; TPA – Fish fed rotifers enriched with Tetraselmis sp. Paste; TPO – Fish fed rotifers enriched with Tetraselmis sp. Powder.
Figure 18 - Zebrafish gut villi length in Trial 1. A. Anterior gut villi length at 15 dpf. B. Mid gut
villi length at 15 dpf. C. Anterior gut villi length at 30 dpf. D. Mid gut length at 30 dpf. Letters indicate significant difference using one-way ANOVA with Tukey’s Test (p ≤ 0.05) (n = 5). ZF- Zebrafeed®; NPA – Fish fed rotifers enriched with Nannochloropsis sp. Paste; NPA 10 ppt – Fish fed rotifers enriched with Nannochloropsis sp. reared at 10 parts per thousand (ppt); NPO – Fish fed rotifers enriched with Nannochloropsis sp. Powder; IPA - Fish fed rotifers enriched with
xviii
Isochrysis sp. Paste; IPO – Fish fed rotifers enriched with Isochrysis sp. Powder; TPA – Fish fed
rotifers enriched with Tetraselmis sp. Paste; TPO – Fish fed rotifers enriched with Tetraselmis sp. Powder.
Figure 19 - Mid gut villi of zebrafish fed rotifers enriched with Nannochloropsis sp. at 30 dpf.
Stained with hematoxylin and eosin (40x).
Figure 20 -Total length of zebrafish at 15 and 30 dpf. Letters indicate significant differences using
one-way ANOVA with Tukey’s Test (p ≤ 0.05) (n = 10). ZF- Fish fed with Zebrafeed®; NPA - Fish fed with Nannochloropsis sp. enriched rotifers; IE2 - Fish fed with Isochrysis sp. Experiment 2 enriched rotifers; TE2 - Fish fed with Tetraselmis sp. Experiment 2 enriched rotifers; SPIRULI – Fish fed with Spirulina sp. enriched rotifers; SKEL – Fish fed with Skeletonema sp. enriched rotifers; PHAEO – Fish fed with Phaeodactylum sp. enriched rotifers; CHC – Fish fed with
Chaetoceros sp. enriched rotifers.
Figure 21 - Dry weight (mg) of zebrafish at 15 and 30 DPF . Letters indicate significant differences
using Chi-Square test (p ≤ 0.05) (n = 10). ZF- Fish fed with Zebrafeed®; NPA - Fish fed with
Nannochloropsis sp. enriched rotifers; IE2 - Fish fed with Isochrysis sp. Experiment 2 enriched
rotifers; TE2 - Fish fed with Tetraselmis sp. Experiment 2 enriched rotifers; SPIRULI – Fish fed with Spirulina sp. enriched rotifers; SKEL – Fish fed with Skeletonema sp. enriched rotifers; PHAEO – Fish fed with Phaeodactylum sp. enriched rotifers; CHC – Fish fed with Chaetoceros sp. enriched rotifers.
Figure 22 - Zebrafish survival at 15 and 30 days post fertilization (dpf). Letters indicate significant
difference using one-way ANOVA with Tukey’s Test (p ≤ 0.05) (n = 100). ZF- Fish fed with Zebrafeed®; NPA - Fish fed with Nannochloropsis sp. enriched rotifers; IE2 - Fish fed with
Isochrysis sp. Experiment 2 enriched rotifers; TE2 - Fish fed with Tetraselmis sp. Experiment 2
enriched rotifers; SPIRULI – Fish fed with Spirulina sp. enriched rotifers; SKEL – Fish fed with
Skeletonema sp. enriched rotifers; PHAEO – Fish fed with Phaeodactylum sp. enriched rotifers;
CHC – Fish fed with Chaetoceros sp. enriched rotifers.
Figure 23 - Incidence of deformities in zebrafish from Trial 2 (n = 40). Letters indicate significant
differences using Chi-Square test (p ≤ 0.05). NPA - Fish fed with Nannochloropsis sp. enriched rotifers; IE2 - Fish fed with Isochrysis sp. Experiment 2 enriched rotifers; TE2 - Fish fed with
xix
Tetraselmis sp. Experiment 2 enriched rotifers; SPIRULI – Fish fed with Spirulina sp. enriched
rotifers; SKEL – Fish fed with Skeletonema sp. enriched rotifers; PHAEO – Fish fed with
Phaeodactylum sp. enriched rotifers; CHC – Fish fed with Chaetoceros sp. enriched rotifers.
Figure 24 - Percent severe deformities in zebrafish from Trial 2 (n = 40). Severe deformities
classified as three or more regions affected by deformity, five or more deformities or any deformity affecting the physical appearance. Letters indicate significant differences using Chi-Square test (p ≤ 0.05). NPA - Fish fed with Nannochloropsis sp. enriched rotifers; IE2 - Fish fed with
Isochrysis sp. Experiment 2 enriched rotifers; TE2 - Fish fed with Tetraselmis sp. Experiment 2
enriched rotifers; SPIRULI – Fish fed with Spirulina sp. enriched rotifers; SKEL – Fish fed with
Skeletonema sp. enriched rotifers; PHAEO – Fish fed with Phaeodactylum sp. enriched rotifers;
CHC – Fish fed with Chaetoceros sp. enriched rotifers.
Figure 25 - Charge of deformities (%) in zebrafish from trial 2 (n = 40). Letters indicate significant
difference using Chi-Square test (p ≤ 0.05). NPA - Fish fed with Nannochloropsis sp. enriched rotifers; IE2 - Fish fed with Isochrysis sp. Experiment 2 enriched rotifers; TE2 - Fish fed with
Tetraselmis sp. Experiment 2 enriched rotifers; SPIRULI – Fish fed with Spirulina sp. enriched
rotifers; SKEL – Fish fed with Skeletonema sp. enriched rotifers; PHAEO – Fish fed with
Phaeodactylum sp. enriched rotifers; CHC – Fish fed with Chaetoceros sp. enriched rotifers.
Colors indicate number of deformities in fish. Peach – 0 deformities; Lime green – 1 deformity; Dark green – 2 deformities; Blue – 3 deformities; Orange – 4 deformities; Red – 5 deformities.
Figure 26 - Location of deformities in deformed fish for trial 2 (n = 40). Letters indicate significant
difference between regions using Chi-Square test (p ≤ 0.05). NPA - Fish fed with Nannochloropsis sp. enriched rotifers; IE2 - Fish fed with Isochrysis sp. Experiment 2 enriched rotifers; TE2 - Fish fed with Tetraselmis sp. Experiment 2 enriched rotifers; SPIRULI – Fish fed with Spirulina sp. enriched rotifers; SKEL – Fish fed with Skeletonema sp. enriched rotifers; PHAEO – Fish fed with
Phaeodactylum sp. enriched rotifers; CHC – Fish fed with Chaetoceros sp. enriched rotifers. Head
– Head; ABD – Abdominal Vertebrae; CV - Caudal Vertebrae; CFV – Caudal Fin Vertebrae; CFN – Caudal Fin.
Figure 27 - A. Double haemal arch and fused vertebrae between caudal vertebrae and caudal fin
vertebrae in fish fed rotifers enriched with Isochrysis sp. experiment 2 (IE2). B. Lateral view of fish fed rotifers enriched with Spirulina sp. (SPIRULI) with scoliosis effecting caudal vertebrae
xx and caudal fin vertebrae region. C. Deformed abdominal centra in fish fed with rotifers enriched with Skeletonema sp. SKEL.
Figure 28 - Average length (mm) of zebrafish at 15 and 30 days post fertilization (dpf) for trial 3
(n = 40). Letters indicate significant difference using one-way ANOVA with Tukey’s Test (p ≤ 0.05). ZF - Zebrafeed®; NPA – fish fed rotifers enriched with Nannochloropsis sp.; CF – fish under co-feeding regime using rotifers enriched with Nannochloropsis sp. until 8 DPF and Zebrafeed®; A – fish fed rotifers enriched with microalgae blend A (Nannochloropsis sp., Isochrysis sp.,
Tetraselmis sp.); B – fish fed rotifers enriched with microalgae blend B (Nannochloropsis sp., Isochrysis sp., Tetraselmis sp., Spirulina sp.); C – fish fed rotifers enriched with microalgae blend
C (Nannochloropsis sp., Isochrysis sp., Tetraselmis sp., Skeletonema sp.).
Figure 29 - Average dry weight (mg) of zebrafish at 15 and 30 days post fertilization dpf for trial
3 (n = 40). Letters indicate significant difference using one-way ANOVA with Tukey’s Test (p ≤ 0.05). ZF - Zebrafeed®; NPA – fish fed rotifers enriched with Nannochloropsis sp.; CF – fish under co-feeding regime using rotifers enriched with Nannochloropsis sp. until 8 DPF and Zebrafeed®; A – fish fed rotifers enriched with microalgae blend A (Nannochloropsis sp., Isochrysis sp.,
Tetraselmis sp.); B – fish fed rotifers enriched with microalgae blend B (Nannochloropsis sp., Isochrysis sp., Tetraselmis sp., Spirulina sp.); C – fish fed rotifers enriched with microalgae blend
C (Nannochloropsis sp., Isochrysis sp., Tetraselmis sp., Skeletonema sp.).
Figure 30 - Average survival (%) of zebrafish at 15 and 30 days post fertilization (dpf) for trial 3
(n = 100). Letters indicate significant difference using one-way ANOVA with Tukey’s Test (p ≤ 0.05). ZF - Zebrafeed®; NPA – fish fed rotifers enriched with Nannochloropsis sp.; CF – fish under co-feeding regime using rotifers enriched with Nannochloropsis sp. until 8 DPF and Zebrafeed®; A – fish fed rotifers enriched with microalgae blend A (Nannochloropsis sp., Isochrysis sp.,
Tetraselmis sp.); B – fish fed rotifers enriched with microalgae blend B (Nannochloropsis sp., Isochrysis sp., Tetraselmis sp., Spirulina sp.); C – fish fed rotifers enriched with microalgae blend
C (Nannochloropsis sp., Isochrysis sp., Tetraselmis sp., Skeletonema sp.).
Figure 29 - Average dry weight (mg) of zebrafish at 15 and 30 days post fertilization dpf for trial
3 (n = 40). Letters indicate significant difference using one-way ANOVA with Tukey’s Test (p ≤ 0.05). ZF - Zebrafeed®; NPA – fish fed rotifers enriched with Nannochloropsis sp.; CF – fish under co-feeding regime using rotifers enriched with Nannochloropsis sp. until 8 DPF and Zebrafeed®;
xxi A – fish fed rotifers enriched with microalgae blend A (Nannochloropsis sp., Isochrysis sp.,
Tetraselmis sp.); B – fish fed rotifers enriched with microalgae blend B (Nannochloropsis sp., Isochrysis sp., Tetraselmis sp., Spirulina sp.); C – fish fed rotifers enriched with microalgae blend
C (Nannochloropsis sp., Isochrysis sp., Tetraselmis sp., Skeletonema sp.).
Figure 31 - Incidence of deformities at 30 days post fertilization (dpf) in zebrafish from Trial 3 (n
= 40). Letters indicate significant difference using one-way ANOVA with Tukey’s Test (p ≤ 0.05). NPA – fish fed rotifers enriched with Nannochloropsis sp.; CF – fish under co-feeding regime using rotifers enriched with Nannochloropsis sp. until 8 DPF and Zebrafeed®; A – fish fed rotifers enriched with microalgae blend A (Nannochloropsis sp., Isochrysis sp., Tetraselmis sp.); B – fish fed rotifers enriched with microalgae blend B (Nannochloropsis sp., Isochrysis sp., Tetraselmis sp., Spirulina sp.); C – fish fed rotifers enriched with microalgae blend C (Nannochloropsis sp.,
Isochrysis sp., Tetraselmis sp., Skeletonema sp.).
Figure 32 - Percentage (%) of deformed zebrafish with severe deformities at 30 days post
fertilization (dpf) (n = 40). Severe deformities classified as three or more regions affected by deformity, five or more deformities or any deformity affecting the physical appearance. Letters indicate significant difference using one-way ANOVA with Tukey’s Test (p ≤ 0.05). NPA – fish fed rotifers enriched with Nannochloropsis sp.; CF – fish under co-feeding regime using rotifers enriched with Nannochloropsis sp. until 8 DPF and Zebrafeed®; A – fish fed rotifers enriched
with microalgae blend A (Nannochloropsis sp., Isochrysis sp., Tetraselmis sp.); B – fish fed rotifers enriched with microalgae blend B (Nannochloropsis sp., Isochrysis sp., Tetraselmis sp.,
Spirulina sp.); C – fish fed rotifers enriched with microalgae blend C (Nannochloropsis sp., Isochrysis sp., Tetraselmis sp., Skeletonema sp.).
Figure 33 - Charge of deformities in deformed fish at 30 days post fertilization (dpf) for trial 3 (n
= 40). Letters indicate significant difference between regions using one-way ANOVA with Tukey’s test (p ≤ 0.05). NPA – fish fed rotifers enriched with Nannochloropsis sp.; CF – fish under co-feeding regime using rotifers enriched with Nannochloropsis sp. until 8 DPF and Zebrafeed®; A – fish fed rotifers enriched with microalgae blend A (Nannochloropsis sp., Isochrysis sp.,
Tetraselmis sp.); B – fish fed rotifers enriched with microalgae blend B (Nannochloropsis sp., Isochrysis sp., Tetraselmis sp., Spirulina sp.); C – fish fed rotifers enriched with microalgae blend
xxii of deformities in fish. Peach – 0 deformities; Lime green – 1 deformity; Dark green – 2 deformities; Blue – 3 deformities; Orange – 4 deformities; Red – 5 deformities.
Figure 34 - Location of deformities in deformed fish for trial 3 (n = 40). Letters indicate significant
difference between regions using one-way ANOVA with Tukey’s test (p ≤ 0.05). NPA – fish fed rotifers enriched with Nannochloropsis sp.; CF – fish under co-feeding regime using rotifers enriched with Nannochloropsis sp. until 8 DPF and Zebrafeed®; A – fish fed rotifers enriched with microalgae blend A (Nannochloropsis sp., Isochrysis sp., Tetraselmis sp.); B – fish fed rotifers enriched with microalgae blend B (Nannochloropsis sp., Isochrysis sp., Tetraselmis sp.,
Spirulina sp.); C – fish fed rotifers enriched with microalgae blend C (Nannochloropsis sp., Isochrysis sp., Tetraselmis sp., Skeletonema sp.). ABD – Abdominal Vertebrae; CV - Caudal
Vertebrae; CFV – Caudal Fin Vertebrae; CFN – Caudal Fin.
Figure 35: A. Compressed caudal fin vertebrae centra in fish fed rotifers with blend C
(Nannochloropsis sp., Isochrysis sp., Tetraselmis sp., Skeletonema sp.). B. Compressed abdominal centra in fish fed rotifers enriched with microalgae blend B (Nannochloropsis sp., Isochrysis sp.,
Tetraselmis sp., Spirulina sp.). C. Double neural arch and missing caudal fin vertebrae centra of
fish fed rotifers enriched with microalgae blend A (Nannochloropsis sp., Isochrysis sp.,
Tetraselmis sp.).
Figure 36 - A. CF (co-feeding) individual with severe scoliosis in caudal fin vertebrae and caudal
xxiii
List of Tables
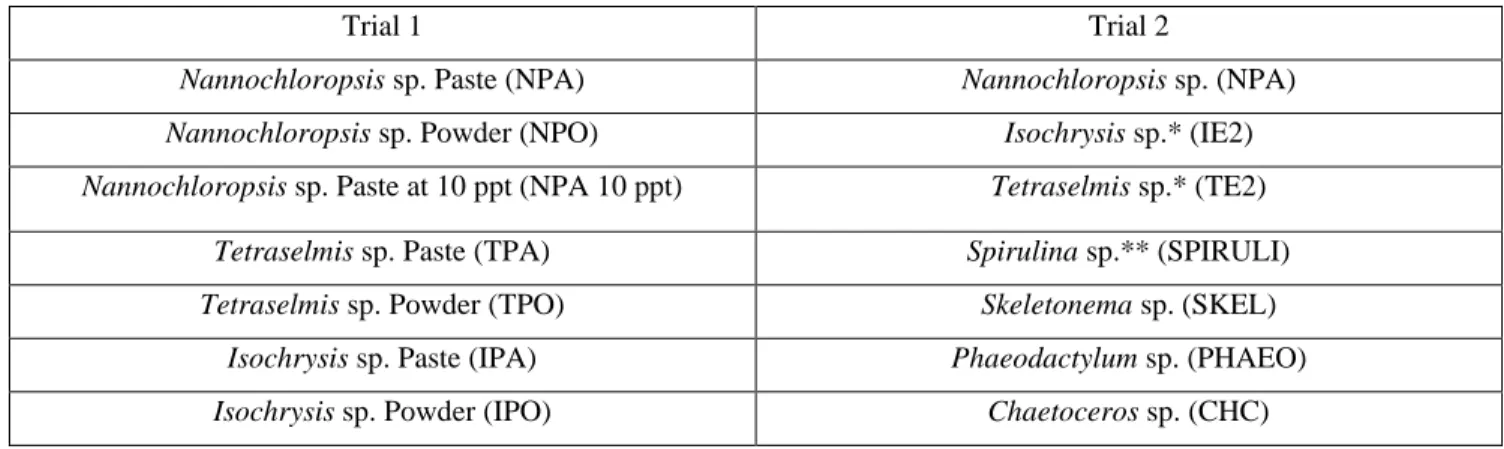
Table 1a - Microalgae strains used in Trials 1 and 2. 5.4 g of indicated microalgae were used.
Total microalgae used based on 18% microalgae mixture. Note: * indicates different species than trial 1. ** indicates powder.
Table 1b - Microalgae strains used in trial 3. Total amount in grams (g) and percent (%) are given,
all mixes used a total of 5.4 g microalgae. Total microalgae used based on 18% microalgae mixture. Note: * indicates different species than trial 1. ** indicates powder.
Table 2- Proximal composition of microalgae (n = 3). NPA – Nannochloropsis sp. Paste; NPA
10 ppt – Nannochloropsis sp. treatment with rotifers reared at 10 parts per thousand (ppt); NPO –
Nannochloropsis sp. Powder; IPA - Isochrysis sp. Paste; IPO – Isochrysis sp. Powder; TPA – Tetraselmis sp. Paste; TPO – Tetraselmis sp. Powder.
Table 3 - Proximal composition of Zebrafeed® and enriched rotifers (n = 3). ZF- Zebrafeed®; NPA ROTS – Rotifers enriched with Nannochloropsis sp. Paste; NPA 10 ppt ROTS – Rotifers enriched with Nannochloropsis sp. treatment with rotifers reared at 10 parts per thousand (ppt); NPO ROTS – Rotifers enriched with Nannochloropsis sp. Powder; IPA ROTS - Rotifers enriched with
Isochrysis sp. Paste; IPO ROTS – Rotifers enriched with Isochrysis sp. Powder; TPA ROTS –
Rotifers enriched with Tetraselmis sp. Paste; TPO ROTS – Rotifers enriched with Tetraselmis sp. Powder.
Table 4- Main fatty acid composition % Total fatty acid (%TFA) ± S.D of microalgae in trial 1
(n = 3). NPA - Nannochloropsis sp. Paste; NPA 10 ppt – Nannochloropsis sp. treatment with rotifers reared at 10 parts per thousand (ppt); NPO – Nannochloropsis sp. Powder; IPA -
Isochrysis sp. Paste; IPO – Isochrysis sp. Powder; TPA – Tetraselmis sp. Paste; TPO – Tetraselmis sp. Powder.
Table 5- Main fatty acid composition % Total fatty acid (%TFA) ± S.D of Zebrafeed® and
enriched rotifers in trial 1 (n = 3). ZF- Zebrafeed®; NPA ROTS – Rotifers enriched with
Nannochloropsis sp. Paste; NPA 10 ppt ROTS – Nannochloropsis sp. treatment with rotifers
xxiv Powder; IPA ROTS - Rotifers enriched with Isochrysis sp. Paste; IPO ROTS – Rotifers enriched with Isochrysis sp. Powder; TPA ROTS – Rotifers enriched with Tetraselmis sp. Paste; TPO ROTS – Rotifers enriched with Tetraselmis sp. Powder.
Table 6: Zebrafish condition factor in Trial 1 at 15 and 30 days post fertilization (dpf) (n = 10).
Letters indicate significant difference using one-way ANOVA with Tukey’s Test (p ≤ 0.05). ZF- Zebrafeed®; NPA – Fish fed rotifers enriched with Nannochloropsis sp. Paste; NPA 10 PPT – Fish fed rotifers enriched with Nannochloropsis sp. reared at 10 parts per thousand (ppt); NPO – Fish fed rotifers enriched with Nannochloropsis sp. Powder; IPA - Fish fed rotifers enriched with
Isochrysis sp. Paste; IPO – Fish fed rotifers enriched with Isochrysis sp. Powder; TPA – Fish fed
rotifers enriched with Tetraselmis sp. Paste; TPO – Fish fed rotifers enriched with Tetraselmis sp. Powder.
Table 7 - Proximal composition of microalgae (n = 3). NPA - Nannochloropsis sp.; IE2 -
Isochrysis sp. Experiment 2; TE2 - Tetraselmis sp. Experiment 2; SPIRULI – Spirulina sp.;
SKEL – Skeletonema sp.; PHAEO – Phaeodactylum sp.; CHC – Chaetoceros sp.
Table 8 - Proximal composition of Zebrafeed® and enriched rotifers (n = 3). ZF- Zebrafeed®; NPA ROTS – Rotifers enriched with Nannochloropsis sp.; IE2 ROTS - Rotifers enriched with
Isochrysis sp. Experiment 2; TE2 ROTS - Rotifers enriched with Tetraselmis sp. Experiment 2;
SPIRULI ROTS – Rotifers enriched with Spirulina sp.; SKEL ROTS – Rotifers enriched with
Skeletonema sp.; PHAEO ROTS – Phaeodactylum sp.; CHC ROTS – Chaetoceros sp.
Table 9 - Main fatty acid composition % Total fatty acid (%TFA) ± S.D of microalgae. NPA -
Nannochloropsis sp.; IE2 - Isochrysis sp. Experiment 2; TE2 - Tetraselmis sp. Experiment 2;
SPIRULI – Spirulina sp.; SKEL – Skeletonema sp.; PHAEO – Phaeodactylum sp.; CHC –
Chaetoceros sp.
Table 10 - Main fatty acid composition % Total fatty acid (%TFA) ± S.D of Zebrafeed® and enriched rotifers. ZF- Zebrafeed®; NPA ROTS – Rotifers enriched with Nannochloropsis sp.; IE2 ROTS - Rotifers enriched with Isochrysis sp. Experiment 2; TE2 ROTS - Rotifers enriched with
Tetraselmis sp. Experiment 2; SPIRULI ROTS – Rotifers enriched with Spirulina sp.; SKEL
ROTS – Rotifers enriched with Skeletonema sp.; PHAEO ROTS – Rotifers enriched with
xxv
Table 11 - Mineral content (mg/kg) ± S.D. of Zebrafeed® and enriched rotifers (n = 2). ZF-
Zebrafeed®; NPA – Rotifers enriched with Nannochloropsis sp.; IE2 - Rotifers enriched with
Isochrysis sp. Experiment 2; TE2 - Rotifers enriched with Tetraselmis sp. Experiment 2;
SPIRULI – Rotifers enriched with Spirulina sp.; SKEL – Rotifers enriched with Skeletonema sp.; PHAEO – Rotifers enriched with Phaeodactylum sp.; CHC – Rotifers enriched with
Chaetoceros sp..
Table 12 - Mineral content (mg/kg) ± S.D. of zebrafish (n = 2). ZF- Fish fed with Zebrafeed®; NPA - Fish fed with Nannochloropsis sp. enriched rotifers; IE2 - Fish fed with Isochrysis sp. Experiment 2 enriched rotifers; TE2 - Fish fed with Tetraselmis sp. Experiment 2 enriched rotifers; SPIRULI – Fish fed with Spirulina sp. enriched rotifers; SKEL – Fish fed with Skeletonema sp. enriched rotifers; PHAEO – Fish fed with Phaeodactylum sp. enriched rotifers; CHC – Fish fed with Chaetoceros sp. enriched rotifers.
Table 13 - Zebrafish condition factor at 15 and 30 days post fertilization (dpf). Letters indicate
significant difference using one-way ANOVA with Tukey’s Test (p ≤ 0.05) (n = 10). ZF- Fish fed with Zebrafeed®; NPA - Fish fed with Nannochloropsis sp. enriched rotifers; IE2 - Fish fed with
Isochrysis sp. Experiment 2 enriched rotifers; TE2 - Fish fed with Tetraselmis sp. Experiment 2
enriched rotifers; SPIRULI – Fish fed with Spirulina sp. enriched rotifers; SKEL – Fish fed with
Skeletonema sp. enriched rotifers; PHAEO – Fish fed with Phaeodactylum sp. enriched rotifers;
CHC – Fish fed with Chaetoceros sp. enriched rotifers.
Table 14 - Proximal composition of microalgae used in trial 3 (n = 3). ZF - Zebrafeed®; NPA –
rotifers enriched with Nannochloropsis sp.; CF – co-feeding using rotifers enriched with
Nannochloropsis sp. until 8 DPF and Zebrafeed®; A (Nannochloropsis sp., Isochrysis sp.,
Tetraselmis sp.), B (Nannochloropsis sp., Isochrysis sp., Tetraselmis sp., Spirulina sp.) and C
(Nannochloropsis sp., Isochrysis sp., Tetraselmis sp., Skeletonema sp.).
Table 15 - Proximal composition of Zebrafeed® and enriched rotifers used in trial 3 (n = 3). ZF - Zebrafeed®; NPA –rotifers enriched with Nannochloropsis sp.; CF – co-feeding using rotifers enriched with Nannochloropsis sp. until 8 DPF and Zebrafeed®; A – Rotifers enriched with blend A (Nannochloropsis sp., Isochrysis sp., Tetraselmis sp.), B - Rotifers enriched with blend B (Nannochloropsis sp., Isochrysis sp., Tetraselmis sp., Spirulina sp.); C - Rotifers enriched with blend C (Nannochloropsis sp., Isochrysis sp., Tetraselmis sp., Skeletonema sp.).
xxvi
Table 16 Main fatty acid composition % Total fatty acid (%TFA) ± S.D of microalgae, Zebrafeed®
and enriched rotifers for trial 3 (n = 3). NPA – Nannochloropsis sp. microalgae; NPA ROTS – rotifers enriched with Nannochloropsis sp.; ZF - Zebrafeed®; Blend A – Microalgae blend A (Nannochloropsis sp., Isochrysis sp., Tetraselmis sp.); Blend A ROTS – rotifers enriched with microalgae blend A (Nannochloropsis sp., Isochrysis sp., Tetraselmis sp.); Blend B – Microalgae blend B (Nannochloropsis sp., Isochrysis sp., Tetraselmis sp., Spirulina sp.); B ROTS – rotifers enriched with microalgae blend B (Nannochloropsis sp., Isochrysis sp., Tetraselmis sp., Spirulina sp.); Blend C – microalgae blend C (Nannochloropsis sp., Isochrysis sp., Tetraselmis sp.,
Skeletonema sp.); C ROTS – rotifers enriched with microalgae blend C (Nannochloropsis sp., Isochrysis sp., Tetraselmis sp., Skeletonema sp.).
Table 17 - Mineral content (mg/kg) ± S.D. of Zebrafeed® and enriched rotifers in trial 3 (n = 2). ZF - Zebrafeed®; NPA ROTS – rotifers enriched with Nannochloropsis sp.; CF – co-feeding using rotifers enriched with Nannochloropsis sp. until 8 DPF and Zebrafeed®; A ROTS – rotifers enriched with microalgae blend A (Nannochloropsis sp., Isochrysis sp., Tetraselmis sp.); B ROTS – rotifers enriched with microalgae blend B (Nannochloropsis sp., Isochrysis sp., Tetraselmis sp.,
Spirulina sp.); C ROTS – rotifers enriched with microalgae blend C (Nannochloropsis sp., Isochrysis sp., Tetraselmis sp., Skeletonema sp.).
Table 18 - Mineral content (mg/kg) ± S.D. of zebrafish from trial 3 (n = 2). ZF - Zebrafeed®; NPA
– fish fed rotifers enriched with Nannochloropsis sp.; CF – fish under co-feeding regime using rotifers enriched with Nannochloropsis sp. until 8 DPF and Zebrafeed®; A – fish fed rotifers enriched with microalgae blend A (Nannochloropsis sp., Isochrysis sp., Tetraselmis sp.); B – fish fed rotifers enriched with microalgae blend B (Nannochloropsis sp., Isochrysis sp., Tetraselmis sp., Spirulina sp.); C – fish fed rotifers enriched with microalgae blend C (Nannochloropsis sp.,
Isochrysis sp., Tetraselmis sp., Skeletonema sp.).
Table 19 - Trial 3 zebrafish condition factor for 15 and 30 days post fertilization (dpf) (n = 10).
Letters indicate significant difference using one-way ANOVA with Tukey’s Test (p ≤ 0.05). ZF - Zebrafeed®; NPA – fish fed rotifers enriched with Nannochloropsis sp.; CF – fish under co-feeding regime using rotifers enriched with Nannochloropsis sp. until 8 DPF and Zebrafeed®; A – fish fed rotifers enriched with microalgae blend A (Nannochloropsis sp., Isochrysis sp., Tetraselmis sp.); B –fish fed rotifers enriched with microalgae blend B (Nannochloropsis sp., Isochrysis sp.,
xxvii
Tetraselmis sp., Spirulina sp.); C – fish fed rotifers enriched with microalgae blend C
(Nannochloropsis sp., Isochrysis sp., Tetraselmis sp., Skeletonema sp.).
Annex 1:
Table A - Complete fatty acid composition % Total fatty acid (%TFA) ± S.D of microalgae in
trial 1 (n = 3). NPA - Nannochloropsis sp. Paste; NPA 10 ppt – Nannochloropsis sp. treatment with rotifers reared at 10 parts per thousand (ppt); NPO – Nannochloropsis sp. Powder; IPA -
Isochrysis sp. Paste; IPO – Isochrysis sp. Powder; TPA – Tetraselmis sp. Paste; TPO – Tetraselmis sp. Powder.
Table B - Complete fatty acid composition % Total fatty acid (%TFA) ± S.D of Zebrafeed® and enriched rotifers in trial 1 (n = 3). ZF- Zebrafeed®; NPA ROTS – Rotifers enriched with
Nannochloropsis sp. Paste; NPA 10 ppt ROTS – Nannochloropsis sp. treatment with rotifers
reared at 10 parts per thousand (ppt); NPO ROTS – Rotifers enriched with Nannochloropsis sp. Powder; IPA ROTS - Rotifers enriched with Isochrysis sp. Paste; IPO ROTS – Rotifers enriched with Isochrysis sp. Powder; TPA ROTS – Rotifers enriched with Tetraselmis sp. Paste; TPO ROTS – Rotifers enriched with Tetraselmis sp. Powder.
Table C - Complete fatty acid composition % Total fatty acid (%TFA) ± S.D of microalgae.
NPA - Nannochloropsis sp.; IE2 - Isochrysis sp. Experiment 2; TE2 - Tetraselmis sp.
Experiment 2; SPIRULI – Spirulina sp.; SKEL – Skeletonema sp.; PHAEO – Phaeodactylum sp.; CHC – Chaetoceros sp.
Table D - Complete fatty acid composition % Total fatty acid (%TFA) ± S.D of Zebrafeed® and enriched rotifers. ZF- Zebrafeed®; NPA ROTS – Rotifers enriched with Nannochloropsis sp.;
IE2 ROTS - Rotifers enriched with Isochrysis sp. Experiment 2; TE2 ROTS - Rotifers enriched with Tetraselmis sp. Experiment 2; SPIRULI ROTS – Rotifers enriched with Spirulina sp.; SKEL ROTS – Rotifers enriched with Skeletonema sp.; PHAEO ROTS – Rotifers enriched with
Phaeodactylum sp.; CHC ROTS – Rotifers enriched with Chaetoceros sp.
Table E - Complete fatty acid composition % Total fatty acid (%TFA) ± S.D of microalgae,
Zebrafeed® and enriched rotifers for trial 3 (n = 3). NPA – Nannochloropsis sp. microalgae; NPA ROTS – rotifers enriched with Nannochloropsis sp.; ZF - Zebrafeed®; Blend A – Microalgae blend A (Nannochloropsis sp., Isochrysis sp., Tetraselmis sp.); Blend A ROTS – rotifers enriched
xxviii with microalgae blend A (Nannochloropsis sp., Isochrysis sp., Tetraselmis sp.); Blend B – Microalgae blend B (Nannochloropsis sp., Isochrysis sp., Tetraselmis sp., Spirulina sp.); B ROTS – rotifers enriched with microalgae blend B (Nannochloropsis sp., Isochrysis sp., Tetraselmis sp.,
Spirulina sp.); Blend C – microalgae blend C (Nannochloropsis sp., Isochrysis sp., Tetraselmis
sp., Skeletonema sp.); C ROTS – rotifers enriched with microalgae blend C (Nannochloropsis sp.,
1
1. Introduction
1.1 Zebrafish
Zebrafish, Danio rerio, is a member of the Cyprinidae family. Native to south Asia, which has a dramatic difference between wet and dry seasons, zebrafish are able to adapt to changes in environmental conditions including temperature and salinity (Best et al., 2010). Due to its robustness and adaptability to captivity (Lawrence, 2007), zebrafish has become a widely used research model. Not only because they are easy to rear, but also the many traits shared with other organisms. Moreover, zebrafish develop rapidly, reaching sexual maturity at 10-14 weeks post fertilization (Ulloa et al., 2011). Continuous spawning can result in hundreds of eggs per week (Wixon, 2000) and embryo development occurs in 48-96 hours (Wixon, 2000; Kimmel et al., 1995). Embryos are translucent making them easy to observe and manipulate (Wixon, 2000). Zebrafish also display ‘shoaling’ behavior (Ruhl et al., 2009; Tsang et al., 2017), which allows larger numbers to be housed together, saving space.
Figure 1 - Zebrafish (Danio rerio) (socmucimm.org, 2014).
Transgenic lines were found to be capable of living in temperatures ranging from 6.7-41.7° C (Cortemeglia and Beitinger, 2011). Zebrafish are known to tolerate brackish conditions, however the process of osmoregulation has a high energy demand (Lawrence, 2007). Best et al. (2010) observed high growth and survival rates at salinities up to 5 ppt for 96 hours and slightly elevated salinities may minimize the growth of harmful bacteria (Boisen et al., 2003).
Several fields of research such as drug screening, toxicology, aquaculture, evolution, developmental biology, human disease (Lawrence et al., 2012), growth, nutrition (Cascio et al., 2018; Ulloa et al., 2011) and vertebral bone disease (Bruneel and Witten, 2015; Pasqualetti et al.,
2 2013; Roberto et al., 2018; Siccardi et al., 2010) have adopted zebrafish as a model organism. Human and zebrafish genes have functional and structural similarities (Carnevali et al., 2013) with 71.4% of human genes sharing a zebrafish ortholog (Howe et al., 2013). The zebrafish central nervous system is similar to humans (Bakthavatsalam et al., 2014). This genetic homology with humans and the short generation time allows for manipulation to study diseases such as cancer, heart disease, Alzheimer’s, diabetes and osteoporosis (Siccardi et al., 2010).
With a similar bone plasticity to other research models including rats, monkeys and mice (Siccardi et al., 2010), zebrafish is now considered an acceptable model for studying vertebrae osteogenesis (Roberto et al., 2018) Zebrafish has a mineralized bone matrix, osteoblasts (bone forming cells), osteoclasts (bone remodeling cells) as well as endochondral and intramembranous ossification processes similar to mammals (Bruneel and Witten, 2015; Pasqualetti et al., 2013; Roberto et al., 2018). The biomineralization and microstructures are similar to human Haversian bone (Siccardi et al., 2010). In addition, the lamellar structure is the primary feature of human osteons (Siccardi et al., 2010) and zebrafish lamellar bone formation and histology is similar to human compact bone (Pasqualetti et al., 2013).
Many factors, especially nutrition, contribute to skeletal development (Nguyen et al., 2008). Deformities commonly occur during early life stages such as metamorphosis and organ development (Nguyen et al., 2008). Nutrient supplementation during skeletal formation and ossification can affect deformities and growth (Nguyen et al., 2008).
1.1.2 Zebrafish Nutrition
Although zebrafish is used in many fields of research worldwide, nutritional requirements are poorly understood unlike other model organisms (Lawrence et al., 2012; Siccardi et al., 2009; Smith et al., 2013; Martins et al., 2019). Since zebrafish is being discussed as a model for growth and nutrition (Ulloa et al., 2011) a standard diet must exist to understand how diet composition effects normal growth (Smith et al., 2013). Researchers using rodents must report diet composition, as variation can significantly influence experimental results (Siccardi et al., 2009). In addition, diet is known to alter gene and protein expression as well as metabolism in mice lungs and liver (Kozul et al., 2008). Therefore, in order to compare different experimental data, dietary requirements must be established for this model organism (Siccardi et al., 2009).
3 Zebrafish are reared on a variety of diets, many of which are without nutritional value and designed for ornamentals (Fernandes et al., 2016). Many laboratory diets use ingredients only known to the manufacturer, the total protein and lipid contents may be the same, but the sources differ depending on market availability and price fluctuations (Kozul et al., 2008). Common ingredients in fish feed have been found to affect physiology and behavior (Siccardi et al., 2009). Plant based nutrient sources have been used as alternative feed ingredients (Francis et al., 2001). Rapeseed, lupin, pea seed, sunflower oil and mustard oil among others, are common plant based ingredients but have many adverse effects such as protease inhibitors and antivitamin properties (Francis et al., 2001). In zebrafish, protein source is known to affect growth and body composition (Smith et al., 2013). To optimize experimental results and zebrafish rearing, nutritional requirements must be established for each life stage and physiological state (Wixon, 2000).
Currently, the two diets most used for rearing zebrafish are Gemma Micro® from Skretting
and Zebrafeed® from Sparos, but these diets have shown different effects on larval growth and
reproductive performance (Diogo et al., 2018; Farias and Certal, 2016; Martins et al., 2018; Monteiro et al., 2018). Enriched live feeds, particularly saltwater rotifers, Brachionus plicatilis, are commonly used in zebrafish facilities as they contain high amounts of nutrients suitable for all life stages (Lawrence et al., 2015)
1.2 Nutrients 1.2.1 Lipids
Lipids are the major organic component of fish (Tocher, 2003) and have many functions including energy reserves, electron carriers, membrane components and hormones (Mcdonald et al., 2011; Meinelt 1999; Ulloa 2011). Fats are derived from fatty acids (FA) which can be either saturated or unsaturated (Brett and Muller-Navarra, 1997; Mcdonald et al., 2011). Saturated fatty acids (SFA) have no double bond between carbon atoms and are solid at room temperature, while unsaturated fatty acids (UFA) have double bonds, are liquid at room temperature and are more chemically reactive (Brett and Muller-Navarra, 1997; Mcdonald et al., 2011). For example, diets high in saturated fats were found to be more nutritious because the energy could be released more efficiently than from unsaturated fats in oyster larvae (Brown et al., 1997). Unsaturated fats with one double bond are monounsaturated fatty acids (MUFA), those with multiple double bonds are polyunsaturated fatty acids (PUFA). Highly unsaturated fatty acids (HUFAs) are PUFAs with more than 20 carbon atoms (Brett and Muller-Navarra, 1997). The FA are named according to the
4 number of carbon atoms and position of double bonds. The methyl carbon at the distal end of a fatty acid chain is known as the omega (n) carbon (McDonald et al., 2011), such that omega 3 (n-3) fatty acids have the first double bond at the number 3 carbon from the distal end of the fatty acid (McDonald et al., 2011).
The PUFAs are important in reproduction, development, gene regulation, membrane maintenance, membrane fluidity and as eicosanoid precursors (Brett and Muller-Navarra, 1997; Jaya-ram et al. 2008; Mcdonald et al., 2011). Eicosanoids are hormone-like biochemicals that regulate functions such as blood clotting, blood pressure, immunity, inflammatory response, reproduction, neural functions and smooth muscle contraction (Halver 2002; Tocher et al., 2008); McDonald et al. 2011). Eicosanoids derived from n-3 PUFAs have an anti-inflammatory effect, while 6 eicosanoids have a pro-inflammatory effect (Lebold et al., 2011). Linoleic acid (18:2 n-6, LA) and linolenic acid (18:3 n-3 LNA) are essential fatty acids (EFAs), fatty acids which must be obtained in the diet, and precursors of the PUFAs eicosapentaenoic (20:5 n-3, EPA), arachidonic (20:4 n-6, ARA) and docosahexaenoic (22:6 n-3, DHA) acids (Chen et al., 2013; Meinelt et al., 2000).
LA and LNA are converted to EPA, DHA and ARA through a series of elongation and desaturation steps, see Figure 2. In mammals, fatty acid desaturation involves Δ-5 and Δ-6 fatty acid desaturases (FAD) (Chen et al., 2013). In zebrafish, one universal FAD gene has been identified, this zebrafish fatty acid desaturase (Z-FAD) has similar activity to Δ-5 and Δ-6 desaturase in mammals (Chen et al., 2013). Zebrafish has the ability to desaturate LA and LNA into EPA, DHA and ARA (Brett and Muller-Navarra, 1997; Brown et al., 1997; Chen et al., 2013; Jaya-ram et al., 2008; Lawrence, 2007). Larvae have a higher dietary PUFA requirement as demand exceeds conversion ability (Brett and Muller-Navarra, 1997), which must be taken into account when developing a product for larval zebrafish.
5
Figure 2 - Schematic representation of conversion process of Linoleic acid (LA) and α-Linolenic acid (ALA) to
arachidonic acid (ARA), eicosapentaenoic acid (EPA) and docasahexaenoic acid (DHA) (Extension, 2012).
Cold water species have a higher n-3:n-6 PUFA ratio than warm water species. Zebrafish, a warm water species, require more n-6 than n-3 PUFA (Lawrence 2007; Meinelt et al., 2000, 1999). Studies on n-3 and n-6 PUFAs in zebrafish suggest there is an optimal dietary ratio that could improve growth (Jaya-ram et al., 2008; Kaushik et al., 2011; Lawrence, 2007; Meinelt et al., 2000, 1999). Spawning in zebrafish is affected by broodstock n-6 levels (Meinelt et al., 1999), as reported by Jaya-Ram et al. (2008) that found highest egg production at low n-3:n-6 ratios, and by Meinelt et al. (1999) who observed increased fertilization rates. While varying n-3:n-6 ratio led to different amounts present in reproductive organs as well as a variation of fertilization rates, indicating that n-3:n-6 PUFA ratios are important in reproduction (Meinelt et al., 1999).
1.2.2 Protein
Proteins are a major fish component whose quantity and quality are related to larval growth and development (Conceição et al., 2003; Halver and Hardy, 2002). Amino acids (AA) are the building blocks of proteins which are digested and distributed to blood, organs and tissues for protein synthesis (Halver and Hardy, 2002; Li et al., 2009). AA must be obtained from the diet and are required for growth and development, metamorphosis, feed intake, reproduction, immunity, metabolic pathway regulation and stress resistance (Li et al., 2009). Supplementation may be beneficial to suppress aggression, increase larval development and survival, optimize spawning and increase the chemo-attractiveness of feed low in fish meal (Li et al., 2009). More AA functions are shown below in Figure 3. Low AA intake can lead to reduced growth and weight loss (Halver
6 and Hardy, 2002), while elevated AA intake can cause AA catabolism, decreased protein synthesis, reduced growth (Zhang et al., 2006) and increase ammonia excretion (Fernandes et al., 2016).
Figure 3 - Functions of amino acids in fish nutrition from Li et al. (2009).
AA are classified as indispensable amino acids (IDAA), which must be obtained in the diet, and dispensable amino acids (DAA), which are synthesized from IDAA (Li et al., 2009). Both IDAA and DAA must be supplied at the proper ratio in diet to meet dietary demands and maximize growth (Halver and Hardy, 2002). Fish species do not have a specific protein requirement but rather require an appropriate balance of both IDAA and DAA which must be determined in order to optimize larval performance (Abidi and Khan, 2004). The first limiting IDAA, the IDAA in lowest supply, sets the limit for protein synthesis (Conceição et al., 2003). When formulating a diet, it is important to understand the target species IDAA requirement and the mechanisms these nutrients are involved in.
Fast growing larvae need to be supplied proper amounts of AA, especially IDAA, to avoid loss of feed conversion efficiency and maintain growth (Conceição et al., 2003). Free amino acids (FAA) are amino acids not bound to proteins (Conceição et al., 2003). Larvae have difficulty digesting complex proteins when switching from endogenous to exogenous feeding so a large FAA supply is important (Aragão et al., 2004; Conceição et al., 2003). FAA constitute an important energy source for first feeding larvae and feed high in FAA increases the amino acid availability for growth and protein synthesis (Aragão et al., 2004). It is also suggested that different FAA stimulate feeding in different species (Aragão et al., 2004). Protein supplemented diets in cod
7 (Gads morhua) increased survival however, dietary protein too high above the requirements was shown to have detrimental effects in both gilthead seabream (Sparus aurata) and carp (Cyprinus
carpio) (Rønnestad et al., 2013). There has been very little research into the protein requirement
of zebrafish. The available information focuses on juveniles (Fernandes et al., 2016) and adults (O’Brine et al., 2015; Smith et al., 2013). As zebrafish mature, growth rate decreases, lowering the protein requirement (Fernandes et al., 2016).
Global aquaculture production is increasing along with the demand for fish meal and fish oil (Bravo-Tello et al., 2017). The increased cost and diminishing availability of these products has pressed the search for an alternative product that is sustainable and economically viable (Bravo-Tello et al., 2017). The previous study by Fernandes et al. (2016) on juvenile zebrafish used fish meal as a protein source. Dietary protein source has a significant impact on growth, length, weight and body composition (Smith et al., 2013). When four protein sources, wheat gluten, casein, fish and soy were tested, soy protein and the mixed source (combination of all four), had the best results (Smith et al., 2013). Soy protein has a limitation in sulfur containing AA which would be expected to reduce growth rate (Smith et al., 2013). However, the diet was high in betaine which could act as a methyl donor to assist in methionine production (Smith et al., 2013). The fact that soy is low in sulfur containing AA along with the other negative side effects (e.g., antinutritional factors) associated with soy indicates that a mixed protein source could be the best option. In this context, many microalgae strains are rich in protein and can help offset intestinal inflammation caused by soy, making it a good addition to feeds containing soy (Bravo-Tello et al., 2017). Larvae are fast growing and have a high protein demand (Zhang et al., 2006), proper AA inclusion and appropriate protein source ensures maximum feed conversion and growth (Conceição et al., 2003).
1.2.3 Minerals
Minerals are required for normal fish processes and are found naturally in the water or provided in diet (Watanabe et al., 1997). Although requirements are generally low for fish, they are an essential nutrient (Watanabe et al., 1997). Trace elements are important in bone health, acting directly on cells or as part of the extracellular matrix (Roberto et al., 2018). Minerals are responsible for skeletal formation, maintaining colloidal systems, regulating acid base equilibriums, hormones and part of metalo-enzyme complexes (Watanabe et al., 1997). Mineral deficiencies can cause biochemical, structural and pathological issues (Watanabe et al., 1997).
8
1.2.4 Vitamins
The vitamin requirements for zebrafish are not fully understood, but are assumed to be similar to other fish (Watts et al., 2012). Vitamins can be water or fat soluble and both are important for fish development and physiology (Halver and Hardy, 2002). Although some of these nutrients are required in small amounts they play crucial roles in regulating gene expression, as coenzymes (Yossa et al., 2011), endocrinol functions, osteoblast activity, osteoclast formation, cell proliferation, regulating intracellular mineral uptake (Lock et al., 2010), growth, reproduction and survival (Watts et al., 2012). Deficiencies can cause decreased growth, increased mortality, decreased food consumption and compromise immune system functions (Halver and Hardy, 2002; Watts et al., 2012; Yossa et al., 2011).
1.2.5 Zebrafish Diet
Zebrafish are euryphagous omnivores (Lawrence et al. 2012). In the wild, D. rerio is known to feed on a variety of insects, invertebrate eggs, arachnids, worms and phytoplankton (Lawrence, 2007; Ulloa et al., 2011). This variety suggests a good diet could be composed of either plant or animal proteins (Ulloa et al., 2011). Typical feeding regimes amongst zebrafish facilities include the use of live feed (Artemia sp. and rotifers) followed by weaning to microdiets (Kaushik et al., 2011; Lawrence, 2007; Siccardi et al., 2009; Ulloa et al., 2011; Wixon, 2000). Live feeds are both chemically and visually attractive to zebrafish, and it is believed that when enriched can be used throughout life as they contain a well-balanced nutritional profile (Lawrence, 2007). The development of an enrichment product based in microalgae that can be easily used within the zebrafish research community will be beneficial for the standardization of feeding procedures ensuring confidence in experimental outcomes.
1.3 Rotifers
Rotifers, Brachionus plicatilis, are the most common live feed at first feeding and possess many qualities desired for rearing larvae (Conceição et al., 2010). The small size and slow movement makes rotifers easy prey allowing greater energy to be expended on growth (Best et al., 2010; Lawrence et al., 2015). Gut flora and bacteria found in rotifers aid in larval digestive functions (Lawrence et al., 2016). Unlike formulated feed, which sink to the bottom or remain on the surface, rotifer movement within the water column stimulates larvae to attack (Conceição et al., 2010). Consuming live prey has been shown to increase digestive enzyme activity and using formulated diets during early larval stages can delay gut development (Eryalcin, 2018).
9 Continuous production of rotifer culture is both easy and cost effective (Best et al., 2010). In addition, rotifers have a high growth rate and tolerate a wide range of conditions (Conceição et al., 2010). Once stock cultures are established, rotifers can be maintained for continuous generations and do not rely on wild captures like Artemia sp. (Conceição et al., 2010).
Rotifers are able to tolerate a wide range of salinities 1-97 parts per thousand (ppt) (Best et al., 2010). This tolerance allows cultivation at low salinities (10-15 ppt) which minimizes osmotic stress and increase survival when fed to zebrafish reared at 0-4 ppt (Lawrence et al., 2012). Breeding at low salinities reduces the risk of normal pathogens associated with saltwater rotifer production as they are unable to survive (Henry et al., 2017). Unlike other organisms which feed on bacteria, rotifers feed on microalgae, which lowers the risk of pathogen exposure and provides nutritional benefits (Martins et al., 2016). Rotifers have two structures aiding in algae consumption see figure 4. The corona is a ciliated structure used in swimming and to sweep prey into the mouth (Lawrence et al., 2012; Henry et al., 2017). The mastax is an internal chewing mechanism responsible for the disruption of hard algae cell walls, allowing for easy digestion (Henry et al., 2017; Lawrence et al., 2012).
Figure 4 - Left: Saltwater rotifer Brachionus plicatilis diagram from Henry et al., (2016). Right: Rotifer with
microalgae enrichment (Easy Reefs, 2019).
Alone, rotifers possess an incomplete nutritional profile (Conceição et al., 2010; Eryalcin, 2018; Lawrence et al., 2015; Nordgreen et al., 2012; Thépot et al., 2016) however, this is easily overcome as the nutritional value can be boosted using enrichments (Hagiwara and Yoshinaga, 2017). Although rotifers have high vitamin C, E, B1 and B2 contents, they are deficient in a