Universidade de Lisboa
Faculdade de Medicina de Lisboa
Contribution of different cellular subsets to the
Adenosine A
2A
Receptor overexpression
in the rat brain
Ana Inês Marques Morgado
Mestrado em Neurociências
Dissertação
Universidade de Lisboa
Faculdade de Medicina de Lisboa
Contribution of different cellular subsets to the
Adenosine A
2A
Receptor overexpression
in the rat brain
Ana Inês Marques Morgado
Dissertação orientada por:
Doutora Joana E. Coelho
Doutora Luísa V. Lopes
Mestrado em Neurociências
Dissertação
Todas as afirmações efetuadas no presente documento são da
exclusiva responsabilidade da sua autora, não cabendo qualquer
responsabilidade à Faculdade de Medicina de Lisboa
pelos conteúdos nele apresentados.
A impressão desta dissertação foi aprovada pelo Conselho Científico da
Faculdade de Medicina de Lisboa em reunião de 19 de abril de 2016
i
RESUMO
O Sistema Nervoso Central caracteriza-se por uma organização estrutural em sinapses multipartidas, constituídas por diversos tipos celulares que coexistem em contínua inter-relação, estabelecendo a base funcional da homeostasia.
A Adenosina, ao ser um metabolito presente em todos os subtipos celulares, ganha relevância pela sua capacidade de modular a função cerebral através de acções a nível da transmissão sináptica – regulando a libertação de neurotransmissores, excitabilidade pós-sináptica e resposta de vários tipos de receptores – e da fisiologia das células gliais. Esta modulação homeostática é mediada pela acção de quatro receptores pleiotrópicos (A1, A2A, A2B and A3) que activam diferentes
vias de transdução, de acordo com o seu grau de activação e localização celular e subcelular. Particularmente a nível do hipocampo, a acção deste importante neuromodulador resulta de um balanço entre as respostas inibitórias dos receptores A1 e os efeitos facilitadores da activação dos
receptores A2A.
Os receptores A2A são receptores metabotrópicos excitatórios que, apesar de pouco expressos a
nível do hipocampo, actuam como metamoduladores da actividade sináptica, através da regulação da libertação de glutamato, GABA e acetilcolina, aliada à interacção com diversos receptores de neuromoduladores, neurotransmissores e neurotrofinas. Além do controlo da função neuronal, as suas acções estendem-se à função dos astrócitos e da microglia, ocupando uma posição de destaque na modulação das relações funcionais entre diversos tipos celulares.
Diversos estudos relacionam situações de insulto - tais como stress, epilepsia, hipoxia, isquémia e envelhecimento – caracterizadas por um aumento extracelular da concentração de adenosina, com a indução de uma desregulação do sistema adenosinérgico, devido à sobreexpressão de receptores A2A a nível do córtex e hipocampo, levando a fenómenos de excitotoxicidade, retracção
dendrítica e alterações da memória e plasticidade sináptica. Embora o mecanismo subjacente a esta sobreexpressão patológica permaneça desconhecido, bem como o subtipo neuronal directamente afectado, sabe-se que este tipo de situações prejudiciais à fisiologia do sistema nervoso induzem alterações que seguem a mesma tendência daquelas que ocorrem com o envelhecimento.
De forma a permitir o estudo da desregulação destes receptores no hipocampo, foi criado um modelo de ratos transgénicos que sobreexpressa o subtipo humano do receptor A2A sob o controlo
do promotor da proteína cinase dependente de cálcio/calmodulina (Tg(CaMKII-hA2AR)), permitindo
uma sobreexpressão pós-natal a nível dos neurónios do prosencéfalo, que mimetiza o processo patológico decorrente de circunstâncias de insulto. Sabendo que estes animais apresentam alterações semelhantes às do envelhecimento, com consequências a nível cognitivo, sináptico e molecular, o presente estudo teve como objectivo avaliar a contribuição de diversos subtipos celulares para este comprometimento da função do hipocampo.
ii
Em primeiro lugar, de forma a abordar as consequências desta sobrexpressão a nível dos circuitos neuronais do hipocampo, foram efectuadas diversas técnicas de biologia molecular para caracterizar a sua localização neste modelo transgénico, tendo sido confirmado através de imunohistoquímica que estes animais expressam o receptor A2A humano nas projecções axonais
de CA3 e a nível de CA1 e do Girus Dentado.
Após esta caracterização, avaliou-se se as alterações induzidas no hipocampo estariam relacionadas com perda neuronal ou modificações na densidade sináptica. Não foram encontradas diferenças significativas no número de neurónios da camada piramidal de CA1 nem nos níveis proteicos de marcadores de densidade sináptica (PSD-95 e SNAP-25) no hipocampo de animais Tg(CaMKII-hA2AR) e WT.
A segunda parte do estudo consistiu na avaliação de possíveis alterações a nível do fenótipo das células da microglia e dos astrócitos, explorando a sua contribuição para o processo patológico.
Procedeu-se à caracterização do fenótipo das células da microglia, através de uma abordagem combinada de Western Blotting, imunohistoquímica e citometria de fluxo. Paralelamente a um aumento significativo de 66.91 ± 24.77% dos níveis proteicos de Iba1 no hipocampo de animais transgénicos, foram encontradas diferenças morfológicas significativas relativas à diminuição da área de influência celular (4,64x10⁸ ± 5,134x107 µm2) e à aquisição de uma morfologia menos
arredondada da microglia na região de CA1 de animais transgénicos, comparativamente aos WT. No entanto, não foram encontradas diferenças significativas em relação ao número de células microgliais e aos níveis de expressão de CD11b.
Os resultados obtidos demonstram que a sobreexpressão neuronal de receptores A2A é suficiente
para desencadear alterações ao nível do fenótipo da microglia, semelhantes às que caracterizam as fases iniciais do seu processo de activação. A existência de um estado crónico de activação da microglia pode levar ao estabelecimento de um ambiente pró-inflamatório, devido à libertação de citocinas e mediadores inflamatórios, com possível contribuição para as alterações verificadas ao nível da plasticidade sináptica do hipocampo neste modelo transgénico.
Por fim, procedeu-se à caracterização do fenótipo dos astrócitos, através de Western Blotting e imunohistoquímica. Observou-se uma diminuição da reactividade dos astrócitos, pela diminuição significativa de 20.76 ± 8.019% dos níveis de GFAP no hipocampo de animais transgénicos comparativamente aos WT. No que diz respeito à análise morfológica destas células, não foram encontradas diferenças significativas na densidade, distribuição e morfologia dos astrócitos da região de CA1 entre animais transgénicos e WT.
A sobreexpressão de receptores A2A a nível neuronal induz uma diminuição de reactividade dos
astrócitos, consistente com um fenótipo de astenia. A perda de função dos astrócitos é uma característica importante do processo de neurodegeneração, com prejuízo da função neuronal resultante de um desajuste homeostático, nomeadamente ao nível da disfunção dos
iii transportadores de glutamato. Diminuições dos níveis de GFAP estão também correlacionadas com patologia depressiva em humanos e modelos animais, o que é consistente com as características depressivas presentes neste modelo de sobreexpressão de receptores A2A previamente analisadas
através de estudos comportamentais. Assim, as alterações verificadas ao nível sináptico e comportamental nos animais transgénicos podem em parte ser explicadas por uma alteração da função dos astrócitos.
O presente trabalho comprova que a sobreexpressão de receptores A2A em neurónios é suficiente
para induzir alterações significativas ao nível da função das células gliais. Deste modo, as consequências cognitivas, sinápticas e moleculares que decorrem da desregulação dos receptores A2AR no hipocampo, em contextos de insulto para a fisiologia do sistema nervoso, derivam de uma
desregulação conjunta de células neuronais e gliais, num mecanismo semelhante ao do envelhecimento.
Para além de contribuir para melhorar o conhecimento sobre os processos neuropatológicos, este estudo reforça a necessidade de considerar a neurodegeneração como uma consequência da perda de homeostasia, dando igual relevância à contribuição das alterações funcionais, celulares e moleculares a nível neuronal e das células da glia.
Palavras-chave: Adenosina; receptor A2A; neurodegeneração; microglia, astrócitos, hipocampo;
v
ABSTRACT
Adenosine A2A receptors (A2AR) are excitatory metabotropic receptors that act as metamodulators
of synaptic activity in the hippocampus, by influencing the release/uptake of glutamate, GABA and acetylcholine together with the interaction with receptors for other neuromodulators, neurotransmitters and neurotrophic factors and the modulation of glial cell function.
Noxious brain conditions, such as stress and aging, are known to induce a dysregulation of adenosinergic system characterized by long-term robust upregulation of A2AR in cortical and
hippocampal regions, leading to an imbalance of the overall effect of adenosine with excitotoxixity phenomena, dendritic retraction and memory and synaptic plasticity impairment. Although little is known on the mechanism involved in this A2AR upsurge, different studies have found common
features between this type of dysregulation and those found in aged animals, raising an early-aging hypothesis behind neurodegeneration.
In order to clarify the involvement of different cellular subsets in the A2AR hippocampal
dysregulation, we characterized glial cell phenotype in a model of transgenic rats with a postnatal overexpression of human A2AR conditional to the glutamatergic forebrain neurons
(Tg(CaMKII-hA2A
R
)) that displays age-like alterations in hippocampal function, with cognitive, synaptic andmolecular impairments.
We found that human A2AR overexpression in forebrain neurons is sufficient to drive significant
changes in glial cell function, inducing a primed state of microglia – triggering morphological alterations that resemble early states of activation process – and an asthenic phenotype of astrocytes by decreasing GFAP expression. Therefore, the pathological process of A2AR
dysregulation derives from a synergy of synaptic and glial dysfunction that resembles features of hippocampal aging.
By highlighting the importance of considering neurodegeneration as a consequence of homeostatic failure, results give relevance to the molecular and cellular changes in glia as well as neurons, when trying to decipher the mechanisms leading to neuropathology, suggesting A2AR as a promising
multifactorial tool of therapeutic interest.
Key Words: Adenosine A2A receptor; overexpression; neurodegeneration; microglia; astrocyte;
1
INDEX
LIST OF ABBREVIATIONS ... 7
1 | INTRODUCTION ... 9
1.2 | A2AR in hippocampal physiology and disease ... 10
1.3 | Rat Model of A2AR Overexpression (Tg(CaMKII-hA2AR)) ... 11
1.4 | Glia and A2AR dysregulation ... 12
1.4.1 | Microglia... 12 1.4.2 | Astrocytes ... 17 2 | AIMS ... 21 3 | METHODS ... 23 3.1 | Animals... 23 3.2 | Genotyping ... 23
3.3 | Hippocampal Cell Dissociation ... 23
3.4 | Primary Neuronal Cultures... 24
3.5 | Immunocytochemistry ... 24
3.6 | Brain Perfusion ... 25
3.7 | Gelatin Embedding ... 26
3.8 | Immunohistochemistry ... 26
3.9 | DNA extraction and sequencing ... 27
3.10 | Sample preparation for Western Blotting ... 27
3.11 | Western blotting ... 27
3.12 | Analysis of Neuronal Cell Number ... 28
3.13 | Morphological analysis of microglial cells ... 28
3.14 | Flow Cytometry ... 29
3.15 | GFAP DAB Immunohistochemistry ... 29
3.16 | Morphological analysis of astroglial cells ... 30
3.17 | Statistics ... 30
4 | RESULTS ... 31
2
4.2 | A2AR overexpression and neuronal loss ... 33
4.2.1 | Neuronal cell counts in CA1 area ... 33
4.2.2 | Levels of markers of synaptic density ... 33
4.3 | Effects of A2AR overexpression in glial cell reactivity ... 35
4.3.1 | Characterization of Microglial Phenotype ... 35
4.3.2 | Characterization of Astroglial Phenotype ... 40
5 | DISCUSSION... 43
5.1 | Localization of human A2AR overexpression in the rat hippocampus ... 43
5.2 | Neuronal A2AR overexpression induced alterations in microglia ... 43
5.3 | Neuronal A2AR overexpression induced alterations in astrocytes ... 46
6 | CONCLUSIONS ... 49
7 | SUPPLEMENTARY DATA ... 51
8 | ACKNOWLEDGEMENTS ... 55
3
FIGURE INDEX
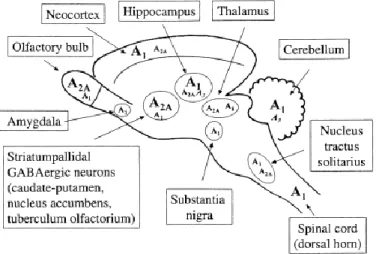
Figure 1.1 Schematic representation of the distribution of adenosine receptors in the brain...9
Figure 1.2 Schematic representation of microglial activation as a complex, multistage process...13
Figure 1.3 Schematic representation of molecular signals sent by reactive astrocytes...18
Figure 1.4 Schematic representation of pathological changes in astroglia...18
Figure 4.1 A2AR staining by immunohistochemistry...31
Figure 4.2 Distribution of human A2AR overexpression in Tg(CaMKII-hA2AR) rats...32
Figure 4.3 Neuronal cell number in the CA1 area of hippocampus...33
Figure 4.4 SNAP-25 levels in the rat hippocampus...34
Figure 4.5 PSD-95 levels in the rat hippocampus...34
Figure 4.6 Iba1 levels in the rat hippocampus...35
Figure 4.7 Morphological analysis of microglial cells...36
Figure 4.8 Area occupied by individual microglial cells of CA1 area of hippocampus...36
Figure 4.9 Elongation of individual microglial cells of CA1 area of hippocampus...37
Figure 4.10 Gating of microglial population for Flow Cytometry analysis...38
Figure 4.11 CD11b+ cell number in the hippocampus...39
Figure 4.12 CD11b Fluorescence Intensity...40
Figure 4.13 GFAP levels in the rat hippocampus...41
Figure 4.14 Overall astroglial phenotype in hippocampus...41
Figure 4.15 Length and complexity of astroglial processes in CA1 area...42
Figure 5.1 Representative images and schematic representation of differences in microglial phenotype...44
Figure 6.1 Schematic representation of functional interrelations between neuronal, microglial and astrocyctic phenotipes in Tg(CaMKII-hA2AR) model...49
Supplementary Figure 7.1 DNA construct used to generate Tg(CaMKII-hA2AR) rats………...….51
4
Supplementary Figure 7.3 FLAG staining by immunohistochemistry………...52 Supplementary Figure 7.4 Rabbit anti-FLAG antibody (Sigma-Aldrich) staining profile by Western
Blotting Analysis……...52
Supplementary Figure 7.5 Molecular Features of CaMKII-hA2AR overexpression...53
Supplementary Figure 7.6 Flow Cytometry Analysis of CD45 antibody staining profile in rat lymph
5
TABLE INDEX
Table 1.1 Cytokines produced upon microglial activation...14 Table 1.2 Principal microglial markers...15 Table 3.1 Primers used for genotyping of transgenic animals...23 Table 3.2 Primary and secondary antibodies and related conditions used in the
Immunocytochemistry experiments...25
Table 3.3 Primary and secondary antibodies and related conditions used in the
Immunohistochemistry experiments………...………...……….26
Table 3.4 Primary and secondary antibodies and related conditions used in the Western Blotting
7 LIST OF ABBREVIATIONS A1R Adenosine A1 Receptor A2AR Adenosine A2A Receptor AC Adenylate Cyclase AD Alzheimer’s Disease
AMPA α-amino-3-hydroxy-5-methyl-4-isoxazolepropionic acid ANOVA Analysis of Variation
ATP Adenosine Triphosphate
BDNF Brain Derived Neurotrophic Factor bp Base Pairs
BSA Bovine Serum Albumin BW Body Weight
CA Cornu Ammonis
CaMKII Ca2+/calmodulin-dependent protein kinase II
CD Cluster of Differentiation CNS Central Nervous System DAB 3,3'-Diaminobenzidine DG Dentate Gyrus
dH2O Distilled water
DMEM Dulbecco's Modified Eagle Medium DNA Deoxyribonucleic Acid
DTT 1,4-dithiothreitol
EAAT1 Excitatory Amino Acid Transporter 1 EAAT2 Excitatory Amino Acid Transporter 2 FBS Fetal Bovine Serum
FITC Fluorescein isothiocyanate GABA γ-Aminobutyric acid
GAPDH Glyceraldehyde 3-Phosphate Dehydrogenase GFAP Glial Fibrillary Acidic Protein
HBSS Hanks' Balanced Salt Solution
Iba1 Ionized Calcium-Binding Adapter Molecule 1 IL Interleukin
LPS Lipopolysaccharide LTD Long-Term Depression LTP Long-Term Potentiation
MAP-2 Microtubule-associated protein 2 MAPK Mitogen Activated Protein Kinase
8
MHC Major Histocompatibility Complex NMDA N-Methyl-D-aspartate
NO Nitric Oxide
PCR Polymerase Chain Reaction PD Parkinson’s Disease
PE Phycoerythrin PFA Paraformaldehyde
PIPES Piperazine-N,N′-bis(2-ethanesulfonic acid) PKA Protein Kinase A
PKC Protein Kinase C
PSD-95 Postsynaptic Density Protein 95 PVDF Polyvinylidene Fluoride
RIPA Radio-Immunoprecipitation Assay SDS Sodium Dodecyl Sulphate
SDS-PAGE Sodium Dodecyl Sulphate ‐ Polyacrylamide Gel Electrophoresis
SEM Standard Error of the Mean
SNAP-25 Synaptosomal-associated protein 25 SYP Synaptophysin
TBS Tris Buffered Saline Tg Transgenic
Tg(CaMKII-hA2AR) Transgenic rat model that overexpresses human A2AR driven by the CaMKIIα
promoter
TGF Transforming Growth Factor TNF Tumor Necrosis Factor WT Wildtype
9
1 | INTRODUCTION
1.1 | Adenosine: coordinator of brain function
Adenosine is a purine nucleoside produced through the catabolism of ATP by ecto-nucleotidases. Ubiquitously present in all cell types, its ability to modulate cell metabolism is widely described, namely in Central Nervous System (CNS), where it is considered a homeostatic coordinator of brain function, able to influence synaptic transmission, triggering or braking the activity of different neurotransmitters and neuromodulators (Ribeiro & Sebastião, 2010). Accordingly, adenosinergic system is responsible for the control of the flow of information rather than its transmission, regulating neurotransmitter release, post-synaptic excitability and the response of several brain receptors (Cunha, 2005; Sebastiao & Ribeiro, 2009). Moreover, this modulatory potential is also extended to astrocytes, microglia and oligodendrocytes, being well positioned to mediate neuron-glia communication (Daré et al., 2007).
The neuromodulatory role of adenosine is mediated by four pleiotropic receptors -– A1, A2A, A2B
and A3 – that couple to different G proteins, activating different transducing pathways according to
their degree of activation and cellular and sub-cellular localization. Nonetheless, the impact of adenosine on brain function is mostly defined by a dynamic balance between the inhibitory and excitatory actions of A1 and A2A receptors, respectively. In fact, the differential activation of these
receptors with opposing outcomes consists of a function of the activity of nerve terminals, with the effects of A1 receptors predominating at low frequencies of stimulation and a preferential activation
of A2A receptors following high frequencies (Cunha, 2005). Although A1 and A2A receptors are
widespread in the CNS, their relative proportions differ greatly according to the brain region. While A1 receptors are more abundant in the cortex, cerebellum and hippocampus, A2A display a more
restricted expression pattern with high density in basal ganglia (Ribeiro et al., 2003).
Figure 1.1 - Schematic representation of the distribution of adenosine receptors in the brain.
10
1.2 | A2AR in hippocampal physiology and disease
In spite of their low density in the hippocampus, with predominant presynaptic localization, A2A
receptors (A2AR) play an important role in the modulation of synaptic transmission, not restricted to
the control of neuronal function but also through their impact on astrocytic and microglial function. The metamodulator properties of A2AR reflect their ability to facilitate the release of most
neurotransmitter types, along with their regulation of the function of metabotropic, ionotropic and catalytic receptors of other modulatory systems (Sebastiao & Ribeiro, 2009; Ribeiro & Sebastião, 2010). Pre-synaptically, A2AR activation modulates the release or uptake of glutamate, acetylcholine
and GABA (Cunha, 2005). In glutamatergic terminals, these receptors possess release-regulating properties, leading to facilitation of glutamate release and synaptic transmission, through different mechanisms, such as: (1) a cross-talk with A1 receptors (A1R)– decreasing their binding affinity and
tonic inhibition, in a manner dependent on intracellular transduction (Lopes et al., 2002); (2) promoting K+-evoked glutamate release (Marcoli et al., 2003), and by (3) a synergistic interaction with mGlu5 receptors, enhancing their responses (Tebano et al., 2006). Moreover, their activation of Adenylate Cyclase/Protein Kinase A (AC/PKA) pathway has effects on cholinergic and GABAergic transmission, promoting acetylcholine release (Rebola et al., 2002) and enhanced GAT-1 mediated GABA transport into nerve endings (Cristóvão-Ferreira et al., 2009). Furthermore, at post-synaptic level, A2AR interact and modulate the activity of different types of receptors, namely enhancing AMPA
receptors-evoked currents and facilitating NMDA receptor functioning (Ribeiro & Sebastião, 2010; Sebastiao & Ribeiro, 2009). Additionally, their activation is a crucial requisite for the functioning of neurotrophic receptors, being able to transactivate TrkB receptors in the absence of Brain Derived Neurotrophic Factor (BDNF) (Lee & Chao, 2001). On the other hand, as A2AR are pleiotropic
receptors it is also important to highlight their ability to signal through PKA-independent pathways, including PKC (R. A. Cunha & Ribeiro, 2000), MAPK (Schulte & Fredholm, 2003), β-arrestin (Khoa et al., 2006) and Src-TrkA (Malek et al., 1999) as well as to bind to several interacting proteins, which can complement and modulate their G-protein-dependent function (Fredholm et al., 2007).
These complex interactions may justify the apparent paradoxical effects of these receptors. In fact, while A2AR activation was reported to play a protective role in cases of intracerebral hemorrhage,
hippocampal kainate-induced excitotoxicity, striatal lesion and spinal cord injury, strategies of genetic and pharmacological inactivation of the same receptor have been proven to afford neuroprotection in contexts of dopaminergic neurodegeneration, excitoxicity, β-amyloid aggregation and traumatic brain injury, as well as to reduce cognitive impairment and decrease Aβ levels in the brain of transgenic mouse models of Alzheimer’s Disease (AD) (reviewed in Dai et al., 2010).
Noteworthy, extracellular adenosine and glutamate levels rise rapidly and dramatically in response to brain insults, due to increased ATP release and altered glutamate presynaptic neuronal release/ astrocytic reversal uptake, respectively. Higher levels of adenosine activate preferentially A2AR and
11 cause A1R desensitization, favouring glutamate release (Cunha, 2005). Thus, this interplay between
adenosine and glutamate levels defines the functional outcome of A2AR, being responsible for a
feedforward loop that leads to neurodegeneration. Therefore, this dual neuroprotective potential of A2AR modulation seems to be dependent on the specific profile of the pathology and the stage of the
pathological where the exposure to agonists or antagonists occurs (Dai et al., 2010).
In fact, although tonic inhibitory activity of A1R counteracts A2AR facilitatory effects at physiological
state (Lopes et al., 2002), different noxious brain conditions - such as hypoxia, ischemia, epilepsy, stress or aging - in which there is a modification of the extracellular metabolism of adenosine, are related to a decrease in expression and density of A1R and a long term robust upregulation of A2AR
in cortical and hippocampal regions. This imbalance of the overall effect of adenosine causes greater susceptibility of brain tissue to stressful stimuli and neuronal damage, leading to excitotoxicity, dendritic retraction and memory and synaptic plasticity impairment (Cunha, 2005; Batalha et al., 2013). Accordingly, it was shown that in aged animals, A2AR-dependent glutamate release becomes
more pronounced and shifts from a PKC-mediated signalling to a PKA-dependent effect (Lopes et al., 1999), which is accompanied with behavioural deficits in hippocampal-dependent tasks (Diógenes et al., 2011).
Nonetheless, the mechanism involved in this A2AR upsurge and which exactly are the
neurotransmitters or neuronal pool directly affected are yet unknown. This process can be seen as a result of a physiological stress condition, being a compensatory mechanism to offset the loss of efficiency of functioning of brain circuits (Rosenzweig & Barnes, 2003), namely through the increase of acetylcholine release. However, this could also result in excitotoxicity phenomena, by the promotion of glutamate release and GABA transmission, which could lead to the inhibition of hippocampal interneurons, thereby reinforcing glutamatergic action. Nevertheless, it is interesting to notice that this changes concerning adenosine receptor system in aged animals are similar to that found on noxious brain conditions, which rises an early-aging hypothesis behind neurodegeneration ( Cunha, 2005; Batalha et al., 2013).
1.3 | Rat Model of A2AR Overexpression (Tg(CaMKII-hA2AR))
In order to overcome current limitations that difficult proper investigation on the dysregulation of hippocampal A2AR function, transgenic rats that overexpress human A2AR driven by the CaMKIIα
promoter have been generated (Tg(CaMKII-hA2AR)). The latter allows a profile of postnatal
overexpression conditional to the glutamatergic forebrain neurons – mainly in the hippocampus and cortex – having very restricted expression in other areas (Coelho et al., 2014), with protein levels that are comparable to that found in physiological aging, without affecting A1R levels.
Consequently, this animal model displays age-like alterations in hippocampal function, with cognitive, synaptic and molecular impairments. At the synaptic level, an increase in neuronal A2AR
12
is sufficient to increase glutamate release probability and intracellular Ca2+ levels, as well as to
enhance synaptic NMDAR currents and decrease AMPAR currents, causing a shift in LTP/LTD probability (Temido-Ferreira et al., 2015). Accordingly, these alterations in synaptic function drive an impairment in hippocampal-dependent tasks both in spatial memory and short-term reference memory.
All gathered, these features and their reversal by blocking A2AR activation strongly support the
hypothesis that A2AR dysregulation drives synaptic dysfunction leading to cognitive impairments in
hippocampal aging.
1.4 | Glia and A2AR dysregulation
Considering that any interference at the functional level of glial cells may create conditions favouring the development of degenerative processes, the key position of adenosinergic system in the control of glial function (Daré et al., 2007) has received increasing attention as a potential target in the modulation of neurodegenerative diseases, allowing to interfere at different components of the pathological condition, slowing down their progression (Fredholm et al., 2005).
1.4.1 | Microglia
Along the past years, growing evidence have generated new links between the brain and immune system, suggesting their intricate connection and significant crosstalk, both in the maintenance of homeostasis and in the progression of aging and neurodegenerative diseases (Lucin & Wyss-Coray, 2009).
Microglia, a cellular subset derived from myeloid precursors, are the gatekeepers of CNS immunology, establishing its first line of defence. Constituting approximately 10% of the total population of glial cells in the adult, their density varies considerably with anatomical region, ranging from a high of 12% in the basal ganglia to a low of 5% in the cortex of mice (Lawson et al., 1992). Considered to be the most susceptible sensors of brain pathology, microglial cells are endowed with numerous receptors capable of detecting physiological disturbances and continuously survey the entire brain parenchyma by constant extension and retraction of their thin and highly branched processes. Moreover, through a large number of signalling pathways, they are also able to communicate with neurons, astrocytes and immune cells, being key players of a functional neuroimmune interplay (Kettenmann et al., 2011). Therefore, through the integration of multifarious input signals, microglial cells display an extraordinary ability to respond rapidly and perform a broad range of functions in the modulation of CNS environment, from secretion of cytokines and chemokines which regulate the state of inflammation, to the release of mediators that control synaptic transmission, and phagocytosis of cells or cellular elements (Tambuyzer et al., 2009).
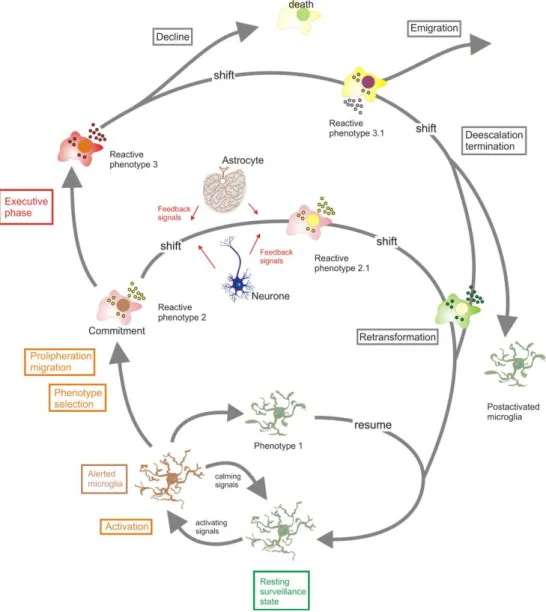
13 Following the detection of pathogens, brain lesion or nervous system dysfunction, microglia undergo a complex, multistage activation process that consists of a morphological transformation from a ramified to amoeboid appearance, in which these cells reduce the complexity of their shape and acquire characteristics resembling peripheral macrophages. Several steps and intermediate stages can be identified, including features of process withdrawal, transition or hyperramification, reflecting the high morphological plasticity of this cell subset and its functional adaption to its microenvironment (Kettenmann et al., 2011; Olah et al., 2011).
Figure 1.2 - Schematic representation of microglial activation as a complex, multistage process. Cells can commit
to distinct reactive phenotypes depending on the challenging stimuli and situational context (from Kettenmann et al., 2011)
Depending on the interpretation of a given insult, microglia can acquire a “classically activated” M1 phenotype - characterized by the secretion of proinflammatory mediators such as Tumor Necrosis Factor α (TNFα) or IL-1β, Nitric Oxide (NO), and glutamate – or an “alternatively activated” M2 phenotype with the expression of anti-inflammatory factors - IL-4 and IL-13, for instance - which can enhance neuronal survival (Ji et al., 2013). Accordingly, M1 microglia have been associated with
14
neurotoxic and neurodegenerative processes, as it has been reported in cases of AD (Mandrekar-Colucci et al., 2012), Amyotrophic Lateral Sclerosis (Liao et al., 2012), Multiple Sclerosis (Gao & Tsirka, 2011), Stroke and Traumatic Brain Injury (Hu et al., 2012; Kumar et al., 2013), whereas a shift to an M2 phenotype has been correlated with neuroprotection, recovery and repair in various disease contexts (Mikita et al., 2011; Wu et al., 2012; Shechter & Schwartz, 2013).
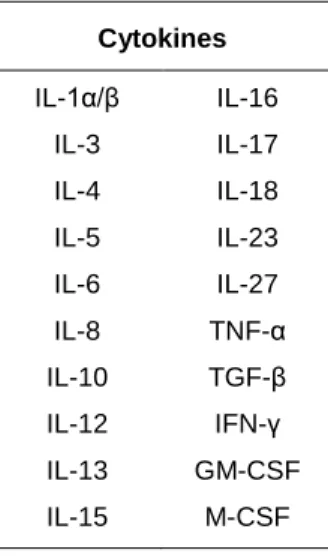
Table 1.1: Cytokines produced upon microglial activation (adapted from Tambuyzer et al., 2009)
Cytokines IL-1α/β IL-16 IL-3 IL-4 IL-5 IL-6 IL-8 IL-10 IL-12 IL-13 IL-15 IL-17 IL-18 IL-23 IL-27 TNF-α TGF-β IFN-γ GM-CSF M-CSF
Abbreviations: IL- Interleukin; TNF- Tumor Necrosis Factor; TGF – Transforming Growth Factor; GM-CSF – Granulocyte-Macrophage Colony-Stimulating Factor; M-CSF - Macrophage Colony-Stimulating Factor.
Due to the complexity of microglial cells and their high morphological and functional plasticity, histological approaches in conjunction with flow cytometry are critical to perform a full phenotypic characterization.
As a result of their myeloid lineage, the lack of specific microglial-only antigens has hampered microglial identification, since markers used for the detection of microglia are also present in macrophages. Consequently, microglial cells can be identified by a variety of cell surface-associated or intercellular/cytosolic molecules, concerning receptors, adhesion molecules and enzymes (Kettenmann et al., 2011; Hooper & Pocock, 2015), as resumed in Table 1.2.
Noteworthy, antibodies against Iba1 have proven most helpful in visualizing microglia with details of their processes (Kettenmann et al., 2011), while CD45lowCD11b/c+ phenotype has been proven to
describe ramified parenchymal microglia (Ford et al., 1995), which justifies the preferential use of these markers in the identification of this cellular subset. Nonetheless, the functional changes inherent to the activation process upregulate the expression level of many of these molecules, such as CD11b (Roy et al., 2006) and Iba1 (Ito et al., 2001), with reactive microglia expressing MHC class II antigens, CD40, CD54, CD68, CD80/86 and other surface molecules necessary for antigen presentation and phagocytosis (Kettenmann et al., 2011; Ford et al., 1995; Hooper & Pocock, 2015; Sedgwick et al., 1991).
15 Molecular Structure/Antigen Properties and Functional Relevance
CD11b/18 (αMβ2 integrin) Complement receptor 3 (CR3)
CD11c (integrin αX) Cell adhesion
CD16/32/64 (FcγRIII/II/I) Immunoglobulin Receptors
CD34 Roles in adhesion, marker for precursor cells of myeloid
origin
CD40 Tumor Necrosis Factor (TNF) Receptor
CD45 (Leucocyte Common Antigen) Transmembrane protein tyrosine phosphatase CD54 (Intracellular Adhesion Molecule 1) Stabilization of cell-cell interactions
CD68 Phagocytosis
CD80/86 (B7.1/B7.2) Antigen Presentation
CD200R Myeloid cell inhibitory signalling
Important for neuron-microglia communication
CX3CR1 Fractalkine (CX3CL1) receptor
Control of microglial activity (neuron-microglia communication)
F4/80 Suggested role in immune tolerance
Iba1 (Ionized Calcium-binding adaptor molecule 1) Suggested role in calcium homeostasis
iNOS (inducible NO synthase) Enzymatic synthesis of NO from arginine during inflammation
MHC I/ II Antigen presentation
Microglial activation is also highly influenced by neurons, through ‘on’ and ‘off’ signals, which are responsible for an inhibitory feedback in the absence of neuronal damage (Biber et al., 2007). This signalling system involve several ligands and receptors – CX3CL1-CX3CR1, CD200-CD200R, CD47-CD172a, for instance – that allow CNS to actively control local immune responses, modulating microglia number, activation and recruitment to sites of injury (Cardona et al., 2006; Olah et al., 2011).
Moreover, microglia are also considered to be active contributors in a paradigm of “quad-partite synapse” either through direct action on neurons or indirectly via astrocytes. Synaptic activity can alter microglial functioning in several aspects, including membrane potential, intracellular calcium, cytokine release and overall cellular motility, due to their ability to express receptors for and respond to neurotransmitters such as glutamate, GABA, acetylcholine, and purines, including adenosine and ATP (Schafer et al., 2013; Kettenmann et al., 2011; Pocock & Kettenmann, 2007). Conversely, in addition to their capacity to rapidly modulate their dynamics in response to neurotransmission, evidences also suggest an important role in the regulation of synaptic transmission (Ji et al., 2013; Schafer et al., 2013). Particularly in the hippocampus, several associations between soluble factors released by microglia and actions upon basal transmission and synaptic plasticity have been demonstrated, namely relating the secretion of Glycine and L-serine to the enhancement of LTP and NMDA receptor-mediated responses (Moriguchi et al., 2003; Hayashi et al., 2006), a link between
16
TNF-α and synaptic scalling (Stellwagen & Malenka, 2006) and a relation between ATP release and the modulation of basal glutamatergic transmission (Pascual et al., 2012). Lastly, besides synaptic plasticity, microglia also play dynamic roles at developing and mature synapses by the remodelling and maturation of synaptic circuits, being crucial to normal brain wiring and function (Schafer et al., 2013; Santiago et al., 2014). Therefore, this ability to shape neuronal environment according to the functional state of synapses through phagocytosis of synaptic elements, together with their role in the modulation of neurotransmission highlight the relevance of microglia as promotors of the homeostasis and long-term stability of neural networks.
The process of neuroinflammation is known to contribute to the exacerbation of neuronal damage. In fact, contexts of neurodegeneration are bolstered by dysregulation of microglial function, presenting features of abnormal synaptic transmission, aberrant synapse formation and/or elimination and abnormal phagocytosis as pathological hallmarks. Accordingly, increased levels of activated microglia have been correlated with most noxious brain conditions (Cunha, 2005) and degenerated brain regions in animal models and post-mortem examination of cases of AD and Parkinson’s Disease (PD) (McGeer et al., 1987, 1988; Su et al., 2008). In agreement, the blockade of microglia-induced neuroinflammation has been proven to attenuate neurodegeneration (Santiago et al., 2014), which further supports their involvement in the evolution of the pathological process.
Consistent with the known ability of A2AR to control the activation of different inflammatory cell
types, an increase in the expression of A2AR by microglial cells following their activation have been
reported upon different brain insults (Canas et al., 2004; Yu et al., 2008). The hypothesis of A2AR
modulation of microglia-induced neuroinflammation, controlling the genesis of the neuroinflammatory feedforward loop that leads to neurodegeneration, synaptic and cognitive impairments is supported by several studies in which A2AR blockade is sufficient to abrogate the
Lipopolysaccharide (LPS)-induced microglial activation and consequent neuronal dysfunction (Rebola et al., 2011), reduce microinflammation in different pathological conditions (Laurent et al., 2014; Yu et al., 2008; Dai et al., 2010), improve microglia response to tissue damage and reduce cognitive impairments in AD and PD animal models (Gyoneva et al., 2014; Arendash et al., 2009; Ferreira et al., 2015). Therefore, therapeutic approaches of neuroinflammation modulation may represent a strategy for the attenuation of the neurological impairment underlying neurodegeneration, exploring the functional interplay between A2AR and microglial cells.
17
1.4.2 | Astrocytes
Astrocytes are the most abundant and heterogeneous cell type in the CNS, being responsible for the promotion of homeostasis through a wide range of essential complex functions (Sofroniew & Vinters, 2010). Occupying 25% to 50% of brain volume (Magistretti & Ransom, 2002), their star-shaped morphology provides structural support to the CNS, forming the infrastructure on which other cells are anchored. Astrocytic multiple fine processes intertwine with neurons, ensheath dendrites and synapses and surround brain capillaries, integrating neuro and vascular elements within an individual astroglial territorial domain, thereby dividing brain parenchyma into independent neurovascular units (Kettenmann & Verkhratsky, 2011).
In addition to their structural role, astrocytes support and modulate synaptic transmission by means of numerous coordinated mechanisms. Through the expression of functional neurotransmitter receptors (glutamate, ATP, GABA, acetylcholine or endocanabinoids) (Oberheim et al., 2012), information shared inside and outside synapses is continuously sensed and elicits astrocytic calcium signalling, promoting the release of neuro and vasoactive substances - such as glutamate, D-serine, ATP, GABA, TNF-α, prostaglandins and peptides - which lead to feedback regulation of neuronal activity, synaptic strength, blood flow and metabolism, in a process known as gliotransmission (Stehberg et al., 2012). Moreover, astrocytic network is also crucial in spatial buffering of K+ and regulation of ion concentrations, as well as in neurotransmitter homeostasis, by ensuring glutamate-glutamine turnover, contributing to an overall neuronal protection against excitotoxicity (Magistretti & Ransom, 2002; Pekny et al., 2016).
Furthermore, reactive astrocytes are critical for tissue repair and function maintenance in the CNS. Following brain insults, astrocytes undergo a multicomponent activation process designated astrogliosis which consists on a continuum of complex changes that occur in a context-dependent manner, leading to profound changes in astrocytic biochemistry and physiology, by activation of pathways involved in inflammation, metabolism, cytoarchitecture and microenvironmental regulation. Thus, reactive astrocytes acquire the ability to release diverse molecular signals, both anti- and pro-inflammatory factors, capable of affecting the activity of different types of surrounding cells, in an attempt to increase neuroprotection (Pekny et al., 2016; Sofroniew & Vinters, 2010) (Figure 1.3).
18
Figure 1.3: Schematic representation of molecular signals sent by reactive astrocytes. Reactive astrocytes
establish complex signalling interactions with different cell types through the release of numerous growth factors, neurotransmitters, cytokines and chemokines (from Pekny et al., 2016)
Although reactive astrogliosis is protective in acute responses, limiting the extent of neurodegeneration, if it persists, long-lasting scar formation might be promoted, along with a shift towards a pro-inflammatory and potentially cytotoxic phenotype, resulting in permanent rearrangement and insult of brain parenchyma (Pekny et al., 2016; Sofroniew & Vinters, 2010).
Actually, dysfunction or maladaptative responses of astroglia are known features of neurodegenerative processes, contributing and exacerbating the progression of several diseases. At a neuropathological level, astrocyte changes are highly variable and disease specific, concerning phenotypes of exarbated astrogliosis response, pathological remodeling and atrophy with loss of function, which can be simultaneously present or emerge sequentially with disease progression (Pekny et al., 2016; Maragakis & Rothstein, 2006) (Figure 1.4)
Figure 1.4 - Schematic representation of pathological changes in astroglia. Astroglial component of
19 The complex process of astrogliosis can be induced and directly modulated by a broad range of extracellular molecules, from purines, neurotransmitters and steroid hormones to growth factors, cytokines, serum proteins or neurodegeneration-associated molecules (Pekny et al., 2016). In fact, adenosine and A2AR can modulate astrocytic function both through the control of astrogliosis and
consequent release of different substances that influence synaptic activity, or by an indirect fine-tuning of the action of other receptor systems in astrocytes (Daré et al., 2007). As A2AR activation
can inhibit EAAT2-mediated astrocytic glutamate uptake and enhance glutamate release (Cunha, 2005), the detrimental effects of high levels of adenosine deriving from prolonged or exaggerated exposure to noxious brain conditions are also result of an inflicted dysregulation of astroglial function.
21
2 | AIMS
Noxious brain conditions such as hypoxia, ischemia, epilepsy, stress or aging are known to induce an inbalance of adenosinergic system, characterized by a long term robust upregulation of A2AR in
cortical and hippocampal regions, which leads to excitotoxicity, dendritic retraction and memory and synaptic plasticity impairment. Although the mechanism involved in this A2AR upsurge and which
exactly are the neurotransmitters or neuronal pool directly affected are yet unknown, different studies have been linking this changes concerning adenosine receptor system upon brain insults with those found in aged animals, raising an early-aging hypothesis behind neurodegeneration.
Having as hypothesis that A2AR dysregulation in the genesis of synaptic dysfunction and cognitive
impairments in hippocampal aging derives from glutamatergic neurons, transgenic rats with a postnatal A2AR overexpression conditional to the glutamatergic forebrain neurons
(Tg(CaMKII-hA2AR), have been generated. Since this animal model displays age-like alterations in hippocampal
function, with cognitive, synaptic and molecular impairments, it constitutes an unprecedented model to detail A2AR dysregulation in the hippocampus.
Therefore, this study aimed to evaluate the contribution of different cellular subsets to the
pathological phenomena associated with A2A receptors dysregulation in the hippocampus.
As the modulatory potential of adenosine is also extended to the control of glial cell function, it was
assessed if this neuronal-specific overexpression of A2AR drives alterations in the reactivity
of astrocytes and microglia, exploring the contribution of these cells to the hippocampal
dysfunction. Moreover, it was also aimed to assess impacts on hippocampal circuitry, analyzing
secondary effects of a glutamatergic-specific A2AR overexpression.
Clarifying the involvement of different cellular subsets in the A2AR dysregulation underlying synaptic
and cognitive dysfunction will be helpful to improve knowledge of neuropathology, including aging and neurodegeneration.
23
3 | METHODS
3.1 | Animals
Animal procedures were performed within the rules of the Portuguese official veterinary department, which complies with European Directive 2010/63/EC and the Portuguese law transposing this Directive (DL 113/2013), and approved by the Instituto de Medicina Molecular Internal Committee and the Portuguese Animal Ethics Committee (Direcção Geral de Veterinária). Environmental conditions were kept constant: food and water ad libitum, 21±0.5°C, 60±10% relative humidity, 12 h light/dark cycles.
A model of transgenic rats that overexpress A2AR - Tg(CaMKII-hA2AR) - was used, as described in
Coelho et al. (2014). These were generated by microinjection of a linearized DNA construct
(Supplementary Figure 7.1) into male pronucleus of Sprague-Dawley rat zygotes, consisting on a
full-length human A2A cDNA cloned into an expression vector with the 8.5kb mouse CaMKIIα
promoter and a polyadenylation cassete of bovine growth hormone. Littermate WT animals were used as controls.
3.2 | Genotyping
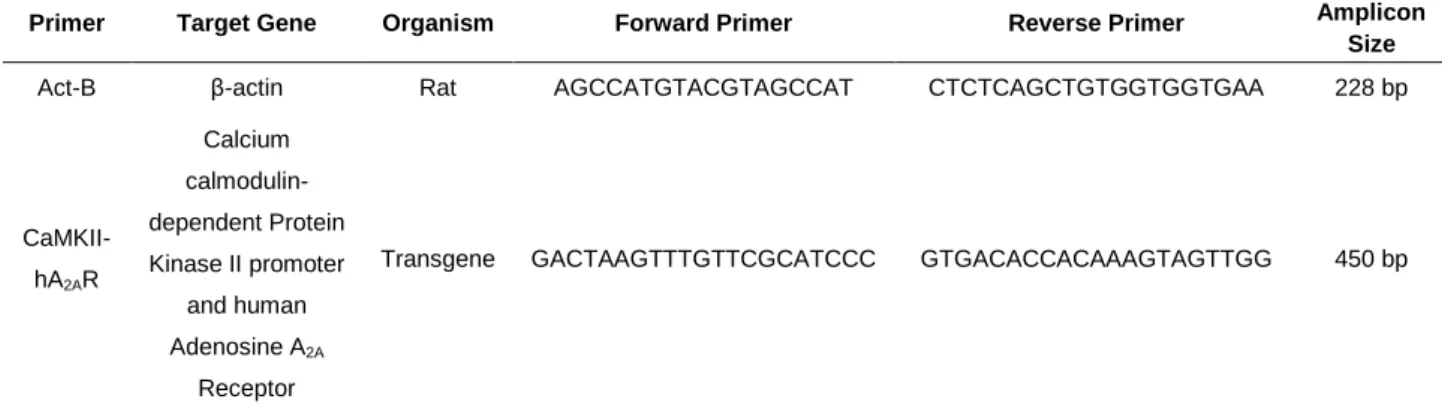
Transgenic rats were identified by Polymerase Chain Reaction (PCR) (30 cycles, 58ºC annealing temperature) of their genomic DNA isolated from ear biopsies by the use of transgene-specific primers: CaMKII-hA2AR and rat β-actin (Invitrogen, Table 3.1)
Table 3.1 - Primers used for genotyping of transgenic animals
Primer Target Gene Organism Forward Primer Reverse Primer Amplicon
Size
Act-B β-actin Rat AGCCATGTACGTAGCCAT CTCTCAGCTGTGGTGGTGAA 228 bp
CaMKII-hA2AR Calcium calmodulin-dependent Protein Kinase II promoter and human Adenosine A2A Receptor
Transgene GACTAAGTTTGTTCGCATCCC GTGACACCACAAAGTAGTTGG 450 bp
3.3 | Hippocampal Cell Dissociation
Based on Kay & Wong (1986), animals with about 8 weeks old were decapitated under deep anesthesia by Isofluorane, hippocampi were removed and sliced at 650µm thickness with a McIlwain tissue chopper. CA1 and CA3 regions of 6 slices per hippocampus were dissected and incubated at
24
32ºC for 5 minutes in an oxygen saturated dissociation solution (120mM NaCl, 5mM KCl, 1mM CaCl2, 1mM MgCl2, 25mM Glucose and 20mM PIPES) with 0.2mg/ml of Proteinase K, followed by
a 30 minutes incubation at 32ºC with 1mg/ml Trypsin diluted in oxygen saturated dissociation solution.
After chemical dissociation, slices were transferred to an oxygen saturated enzyme-free dissociation solution, briefly washed, and each slice was mechanically dissociated in 1ml of Dulbecco's Modified Eagle's Medium (DMEM) (Gibco – Life Technologies) by gentle trituration, using 2 fire polished Pasteur pipettes (1 and 0.2 mm bore). Immediately after trituration, 500µl of supernatant was plated per well on poly-D-lysine-coated coverslips in 24-well plates, and incubated for 30 minutes to promote cell decantation. After removing medium from wells, immunocytochemistry protocol was performed.
3.4 | Primary Neuronal Cultures
Primary rat neuronal cultures were obtained from 18 days rat embryos, according to Pedersen et al (2002). Briefly, a pregnant rat, previously genotyped as Transgenic (Tg(CaMKII-hA2AR)) was
decapitated under deep anesthesia with Isofluorane. The embryos were collected in Hanks’ Balanced Salt Solution (HBSS) (Corning) and rapidly decapitated. Meninges were removed, whole cortices (hippocampi and attached cortex) dissociated and incubated for 15 minutes in HBSS with 0.025% trypsin. Cells were washed once with HBSS with 30% Fetal Bovine Serum (FBS), centrifuged three times, re-suspended in Neurobasal Medium (Gibco – Life Technologies) supplemented with 2% B-27 supplement, 25 µM Glutamate, 0.5 mM glutamine, and 2 U/ml Penicillin/Streptomycin, gently dissociated and filtered through a 70µm strainer (VWR).
After counting, cells were plated on poly-D-lysine-coated coverslips in 24-well plates at density of 8x10⁴ cells/well. Neurons were grown at 37°C in a 5% CO
2 humidified atmosphere in the previously
described supplemented Neurobasal medium, in the absence of any positive selection for neurons. Medium was not replaced and cultures were used at day 9 and 14.
3.5 | Immunocytochemistry
Cells from either hippocampal dissociation or primary neuronal cultures were fixed for 10 minutes with 4% Paraformaldehyde (PFA) diluted in Phosphate Buffer Saline (PBS) (Alpha Aesar
)
. After washing thrice with PBS, cells were permeabilized for 10 minutes with 0.05% Triton-X in PBS, blocked for 30 minutes with 10% FBS in PBS and incubated overnight at 4°C with primary antibodies diluted in PBS with 0.05% Tween-20 and 4% FBS (Table 3.2).After washing three times with PBS with 0.05% Tween-20, cells were incubated for 1 hour with secondary antibodies diluted in PBS with 0.05% Tween-20 and 4% FBS (Table 3.2). In order to label cell nucleus, after washing 30 minutes with PBS with 0.05% Tween-20, coverslips were incubated
25 for 5 minutes with Hoechst (Hoechst 33342, Thermo Scientific; 12µg/ml final concentration) and washed for 30 minutes with PBS 0.05% Tween-20. After a final washing step with PBS, coverslips were mounted with Dako Fluorescent Mounting Medium (Dako) and let to dry for 24h at room temperature, protected from light exposure.
Cells were observed either with a Zeiss Axiovert 200M Fluorescence Microscope or a Zeiss LSM 710 Confocal Microscope.
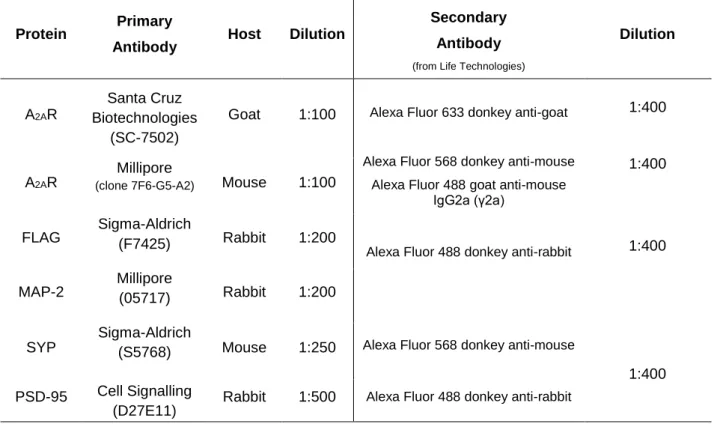
Table 3.2 - Primary and secondary antibodies and related conditions used in the Immunocytochemistry experiments.
All antibodies were diluted in PBS with 0.05% Tween-20 and 4% FBS
Protein Primary
Antibody Host Dilution
Secondary Antibody
(from Life Technologies)
Dilution
A2AR
Santa Cruz Biotechnologies
(SC-7502)
Goat 1:100 Alexa Fluor 633 donkey anti-goat Alexa Fluor 568 donkey anti-mouse
Alexa Fluor 488 goat anti-mouse IgG2a (γ2a)
Alexa Fluor 488 donkey anti-rabbit
Alexa Fluor 568 donkey anti-mouse
Alexa Fluor 488 donkey anti-rabbit
A2AR
Millipore
(clone 7F6-G5-A2) Mouse 1:100
FLAG Sigma-Aldrich (F7425) Rabbit 1:200 MAP-2 Millipore (05717) Rabbit 1:200
SYP
Sigma-Aldrich
(S5768) Mouse 1:250 PSD-95 Cell Signalling
(D27E11) Rabbit 1:500
Abbreviations: A2AR – Adenosine A2A Receptor; MAP-2 - Microtubule-associated protein 2; SYP – Synaptophysin; PSD-95 - Postsynaptic
Density Protein 95
3.6 | Brain Perfusion
Animals with 12 to 14 weeks old were deeply anaesthetized with an Intraperitonial Injection of a mixture containing Ketamine and Xylazine (120mg/KgBW Ketamine + 16mg/KgBW Xylazine) and transcardially perfused via the ascending aorta. A lateral incision was made below the sternum and xiphoid process was held with forceps. The diaphragm was cut and an incision was made parallel to the sternum to expose the thoracic cavity. A needle was inserted into left ventricle, and the right atrium perfurated to initiate perfusion. Animals were perfused with 200ml of a 0.9% NaCl solution and subsequently perfused with 500ml of 4% PFA diluted in PBS
.
After perfusion, animals were decapitated, brains were removed and cryopreserved in a 15% sucrose in PBS solution overnight at 4ºC, followed by 30% sucrose in PBS solution during 48h at 4ºC.1:400 1:500/1:1000 1:400 1:400 1:400 1:400 1:400
26
3.7 | Gelatin Embedding
After cryopreservation in 15 and 30% sucrose, brains were equilibrated with a 15% sucrose/7.5% gelatin in PBS solution for 1h at 37ºC, embeded in the same solution and left to solidify overnight at 4ºC. The included tissue was cut into blocks and slowly frozen to -70ºC by submerging in isopentane cooled with liquid nitrogen. The blocks were kept at -80ºC until use.
3.8 | Immunohistochemistry
Coronal cryostat sections of 12µm - starting at approximately -3.14mm from Bregma - were collected with a CM3050S Leica cryostat and mounted in Superfrost Slides (Thermo Scientific).
For immunohistochemistry, the slides were incubated in PBS for 10 minutes at 37ºC followed by a 20 minutes incubation with 0.1M glycine in PBS. The slices were then permeabilized and blocked with a solution of TBST-T 0.2% (Tris Buffer Saline with 0.2% Tween-20 solution, 200nM Tris, 1.5 M NaCl) containing 10% FBS and 1% BSA (Bovine Serum Albumin) for 1 hour. Incubations with primary antibodies (Table 3.3) were performed for 48h at 4ºC and slices were washed for 30 minutes in TBS-T 0.1% (Tris Buffer Saline with 0.1% Tween-20 solution, 200nM Tris, 1.5 M NaCl) before being incubated overnight at 4ºC with secondary antibodies (Table 3.3). After a 30 minutes washing with TBS-T 0.1%, slices were incubated for 10 minutes with Hoechst (Hoechst 33342, Thermo Scientific; 12µg/ml final concentration) and washed for 15 minutes with PBS. Lastly, slices were mounted in Dako Fluorescent Mounting Medium (Dako) and left to dry for 24h at room temperature protected from light exposure.
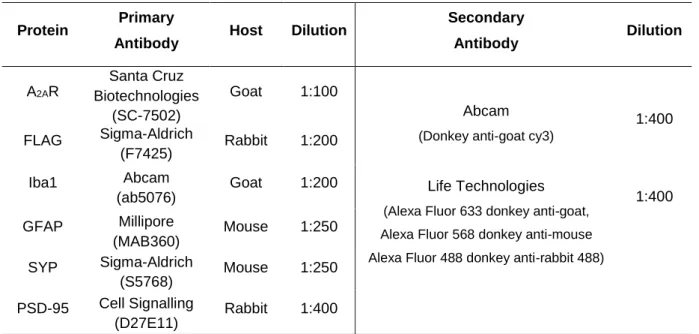
Table 3.3 Primary and secondary antibodies and related conditions used in the Immunohistochemistry experiments.
All antibodies were diluted in TBS-T 0.1% with 4% FBS.
Protein Primary
Antibody Host Dilution
Secondary Antibody Dilution A2AR Santa Cruz Biotechnologies (SC-7502) Goat 1:100 Abcam
(Donkey anti-goat cy3)
Life Technologies
(Alexa Fluor 633 donkey anti-goat, Alexa Fluor 568 donkey anti-mouse Alexa Fluor 488 donkey anti-rabbit 488)
1:400 1:400 FLAG Sigma-Aldrich (F7425) Rabbit 1:200 Iba1 Abcam (ab5076) Goat 1:200 GFAP Millipore (MAB360) Mouse 1:250 SYP Sigma-Aldrich (S5768) Mouse 1:250 PSD-95 Cell Signalling (D27E11) Rabbit 1:400
Abbreviations: A2AR – Adenosine A2A Receptor; Iba1 - Ionized Calcium-Binding Adapter Molecule 1; GFAP - Glial Fibrillary Acidic Protein;
27
3.9 | DNA extraction and sequencing
DNA was extracted using NucleoSpin Gel and PCR Clean-Up Kit (Macherey-Nagel). Briefly, after electrophoresis of PCR products of genotyping procedure, 2 bands of agarose gel containing the 450 bp fragment amplified using CaMKII-hA2AR specific primers (see Table 3.1) were excised.
After agarose was dissolved, samples were loaded into a column and centrifuged twice for 30 seconds at 11000 xg, in order to bind DNA to a silica membrane and to promote its washing. Then, the membrane was dried and DNA eluted. Lastly, DNA was analyzed with Nanodrop 2000 Spectrophotometer (Thermo Scientific) and sent for sequencing (GATC Biotech) using CaMKII-hA2AR specific primers at a 5µM concentration.
3.10 | Sample preparation for Western Blotting
Frozen hippocampal tissue was placed in 400µl of RIPA (Radio-Immunoprecipitation-Assay) buffer (50mM Tris, 1mM EDTA, 150mM NaCl, 0.1% SDS, 1% NP-40, pH 8) and homogenized by sonication. Protein was quantified using the BioRad DC Protein Assay Kit, based on Lowry (1951), due to the high levels of detergents in the sample.
After protein quantification, the appropriate volume of each sample was diluted in four volumes of water and one volume of sample buffer (350 mM Tris pH 6.8, 30% glycerol, 10% SDS, 600 mM DTT and 0.012% Bromophenol blue). The samples were denatured at 95°C for 5 minutes.
3.11 | Western Blotting
Based on the protocol of Towbin et al. (1979), samples and molecular weight markers were separated by SDS-PAGE electrophoresis in denaturing conditions, using 5% stacking gel and either a 10% or 15% resolving gel, and electro-transferred to PVDF membranes (Millipore). Membranes were blocked with 3% BSA in TBS-T 0.1% for 1 hour and incubated with primary antibody (diluted in TBS-T with 3% BSA) overnight at 4°C in a roller. After washing with TBS-T for 30 minutes, the membranes were incubated with horseradish peroxidase (HRP, EC 1.11.1.7) conjugated secondary antibody in 5% non-fat dry milk for 1 hour at room temperature (primary and secondary antibody dilutions are in Table 3.4). After 30 minutes of washing with TBS-T, chemoluminescent detection was performed with ECL Western Blotting Detection Reagent (GE Healthcare) using X-Ray films (Fujifilm) developed in Curix 60 Processor (AGFA). Optical density was determined with ImageJ software and normalized to the respective GAPDH band density.
28
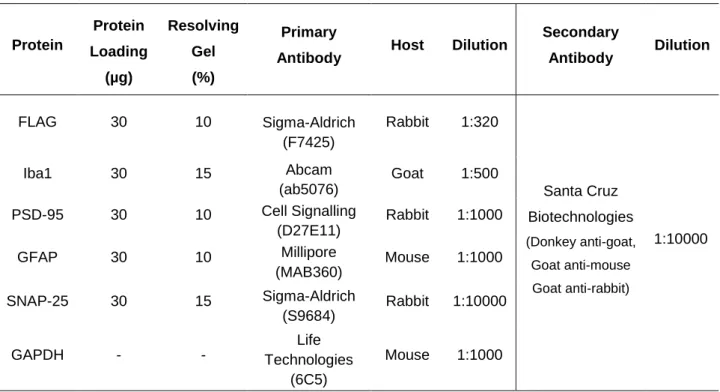
Table 3.4 - Primary and secondary antibodies and related conditions used in the Western Blotting experiments for
individual proteins. All primary antibodies were diluted in TBS-T 0.1% with 3% BSA and secondary antibodies in 5% non-fat dry milk diluted in TBS-T 0.1%
Protein Protein Loading (µg) Resolving Gel (%) Primary
Antibody Host Dilution
Secondary Antibody Dilution FLAG 30 10 Sigma-Aldrich (F7425) Rabbit 1:320 Santa Cruz Biotechnologies (Donkey anti-goat, Goat anti-mouse Goat anti-rabbit) 1:10000 Iba1 30 15 Abcam (ab5076) Goat 1:500 PSD-95 30 10 Cell Signalling (D27E11) Rabbit 1:1000 GFAP 30 10 Millipore (MAB360) Mouse 1:1000 SNAP-25 30 15 Sigma-Aldrich (S9684) Rabbit 1:10000 GAPDH - - Life Technologies (6C5) Mouse 1:1000
Abbreviations: Iba1 - Ionized Calcium-Binding Adapter Molecule 1; PSD-95 - Postsynaptic Density Protein 95; GFAP - Glial Fibrillary Acidic Protein; SNAP-25 - Synaptosomal-Associated Protein 25; GAPDH - Glyceraldehyde 3-Phosphate Dehydrogenase
3.12 | Analysis of Neuronal Cell Number
Per animal, four fields of CA1 pyramidal cell layer were randomly selected of 12µm hippocampal slices and acquired at 40x magnification using a Zeiss Cell Observer Widefield microscope. Cells labeled with Hoechst were counted using Cell Counter Plugin of ImageJ software.
3.13 | Morphological analysis of microglial cells
Confocal Z-stacks of 12µm slices stained with Iba1 were taken at 20x magnification, using a Zeiss LSM 710 Confocal Microscope.
Based on Almolda et al. (2015), a morphometric analysis of Iba1 labeled microglia was performed. For each animal, a total of 60 representative microglial cells from CA1 area were chosen from a minimum of 10 different z-stack images. Using ImageJ software, maximum intensity projection images were generated and individual cells were isolated by the tracing of their perimeter with Polygon Selection tool. Different parameters including the fitted ellipse were recorded for each cell.
29
3.14 | Flow Cytometry
After deep anesthesia with Isofluorane, rats were perfused with approximately 200ml of PBS via the left ventricle of the heart to exclude circulating and nonadherent erythrocytes and leukocytes from the brain. Brains were removed, hippocampi were dissected on ice-cold Krebs Buffer (124mM NaCl, 3mM KCl, 1.25mM Na2HPO4, 26mM NaHCO3, 1mM MgSO4, 2mM CaCl2, 10mM glucose) and
minced with a razor blade in ice-cold GKN/BSA Buffer (GKN: 8g/l NaCl, 0.4g/l KCl, 3.6g/l Na2HPO4.12H2O, 0.8g/l NaH2PO4, 2g/l D-(+)-glucose, 0.3% BSA, pH 7.4, 4ºC).
Two experimental conditions were performed. Firstly, according to Doorn et al. (2015), identical regions of 2 animals were pooled per experiment to increase microglial yield and tissue was gently dissociated in GKN/BSA Buffer, mashed through a 70µm pore size strainer (VWR) to reach a single cell suspension and centrifuged for 10 minutes at 300g at 4ºC. The supernatant was discarded and the remaining cell pellet was resuspended in 1ml of 50% Percoll diluted in GKN/BSA buffer, after which an additional 7ml 50% Percoll was added. Then, 4ml of 75% Percoll was gently under layered and subsequently 3ml GKN/BSA buffer was layered on top of the 50% Percoll layer. The Percoll gradient was centrifuged at 1300 xg, for 30min at 4ºC, with minimum acceleration and brakes off. After the removal of the top layer - composed of thick, viscous myelin – the interphase between the 50 and 75% Percoll was carefully removed using a Pasteur pipette, washed with GKN/BSA buffer and cells were resuspended in PBS buffer. 500µl aliquots of cell suspension were prepared and incubated for 30 minutes with FITC-conjugated anti-integrin αM/CD11b (OX42) antibody (Santa Cruz Biotechnologies, sc-53086, final dilution 1:200) and PE-conjugated anti-CD45 (OX30) antibody (Santa Cruz Biotechnologies, sc-53047, final dilution 1:200) at room temperature, in a rocker. Lastly, cells were rinsed in PBS, pelleted at 1200rpm for 5 minutes at 4ºC and ressuspended in 300µl PBS.
In the second experimental condition, the previous protocol was maintained with the exception of Percoll gradient, in order to obtain non-purified samples.
Data acquision was performed on a BDAccuri C6 Flow Cytometer (BD Biosciences) and analyzed using FlowJo software.
3.15 | GFAP DAB Immunohistochemistry
Coronal cryostat sections of 40µm - starting at approximately -3.14mm from Bregma - were collected with a CM3050S Leica cryostat and mounted in Superfrost Slides (Thermo Scientific) with intervals of 160µm, in order to obtain a set of non-contiguous serial sections spanning dorsal hippocampus.
Gelatin was removed from slices by incubation with PBS for 10 minutes at 37ºC. Staining was preformed using the EnVision+ System-HRP (DAB) from Dako. After washing 1 hour with Wash Buffer at room temperature, peroxidase was blocked with 3% H2O2 in methanol for 30 minutes.
30
Following washing 15 minutes with Wash Buffer, slices were blocked with Protein-Block for 40 minutes and incubated with Rabbit anti-GFAP polyclonal antibody (Dako) at a 1:500 dilution, for 2 hours at room temperature. After washing 15 minutes with Wash Buffer, slices were incubated with Anti-Rabbit antibody conjugated with HRP (Dako) for 1 hour at room temperature, and washed for 15 minutes washing with Wash Buffer. Slices were then stained with 3,3'-Diaminobenzidine (DAB) for 2 minutes and rinsed in distilled H2O (dH2O). Lastly, slices were dehydrated using a graded series
of Ethanol (70%, 96%, 100%), cleared in Xylene and mounted.
3.16 | Morphological analysis of astroglial cells
Based on Morel et al. (2015), per animal, a set of three non-contiguous 40µm coronal cryostat sections was processed by GFAP DAB Immunohistochemistry and scanned with a NanoZoomer SQ slide scanner (Hamamatsu) under 20x magnification. In each set, a total of 90 representative GFAP+ cells of CA1 area were randomly chosen and analyzed using Sholl Analysis Plugin v1.0 of ImageJ software. This technique consists of individualizing cells by precise drawing and superimposing a grid with concentric rings distributed at equal distances centered on cell body. The number of process intersections per shell was then computed in order to evaluate length and complexity of astroglial branching.
3.17 | Statistics
GraphPad Prism 5 software was used for statistical analysis. The values presented are mean ±SEM of n experiments. To test the significance of differences between WT and Tg(CamKII-hA2AR),
unpaired Student’s t-test was used. In the morphological analysis of astroglial cells, a two way ANOVA followed by a Bonferroni’s Multiple Comparison post hoc test was used. Values of P<0.05 were considered to be statistically significant.
31
4 | RESULTS
4.1 | Localization and secondary effects of A2AR overexpression
Previous results from our group have characterized the molecular features of the CaMKII-hA2AR
transgenic model (Supplementary Figure 7.5), confirming that these animals overexpress A2AR
mostly in the hippocampus, in the pre-synaptic region and from 2 weeks-old onwards. In sequence with this preliminary data, the current project had the purpose to investigate the localization of A2AR
in Tg(CaMKII-hA2AR) rat model, as well as the consequences of this upsurge in the pattern of
expression of A2AR in different cellular subsets.
In order to do so, several approaches were possible, with advantages and disadvantages that were considered in the experimental strategy. Immunohistochemistry was the first method to be chosen, due to the advantage of preserving the structure of hippocampal tissue.
A2AR signal consisted of a puncta-like staining around cell body of neurons in both conditions
(Figure 4.1), not allowing to infer a viable conclusion, as the antibody used is not specific to the
human subtype of A2AR.
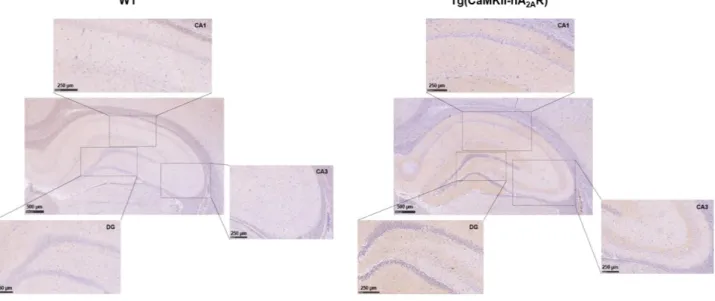
Figure 4.1 - A2AR staining by immunohistochemistry. Fluorescence immunohistochemistry images from CA1 area of
12µm rat hippocampal sections at 40x magnification. Neuronal nuclei are stained with Hoechst (blue) and A2AR are
identified by red fluorescence using goat anti-human A2AR antibody (Santa Cruz Biotechnologies). Scale Bar:25µm.
With the intention of bypassing the difficulties inherent to A2AR antibodies, we tried to use the
FLAG-tag included in the construct that generated Tg(CaMKII-hA2AR) rats (Supplementary Figure 7.1) as
a mean to locate transgenic A2AR receptor expression. Firstly, we extracted DNA from transgenic
animals and sequenced the 450bp amplicon in order to assess if the FLAG-tag was successfully inserted in the transgene and correctly in fusion with the A2AR protein. Nonetheless, even though we
confirmed that there is a FLAG epitope inserted in frame between 6 and 7th aminoacids of the N-terminal of the transgenic human A2AR protein (Supplementary Figure 7.2), anti-FLAG antibody