Climate Responsibility Premium: An Event
Study on the US Climate Policy Shock
José Gouveia
152418008
Dissertation written under the supervision of
Professor Eva Schliephake
Dissertation submitted in partial fulfilment of requirements for the MSc in
Finance, at the Universidade Católica Portuguesa.
Study on the US Climate Policy Shock
José Gouveia
152418008
Abstract
Donald Trump’s election, Scott Pruitt’s nomination and the withdrawal of the United States of America from the Paris Agreement created expectations of a weaker environmental regulation in the country. This thesis studies the stock market reactions to these events on the Russell 3000 constituents. Investors rewarded carbon-intensive industries on the short run, as naïve intuition would suggest. However, and least expected, environmentally responsible firms also benefitted from these shocks. Such results are explained by the general increase in climate awareness, sparked by these events. Over the long run, the climate responsibility premium grew until the end of the year 2017, stagnating through the whole year of 2018. Changes in Donald Trump’s political influence consistently brought two different shocks to the climate responsibility premium. One from the perceived environmental deregulation, and the other from the rise in general climate awareness. The awareness shock prevailed until the end of 2017, benefitting climate responsible firms. The deregulation shock started overriding in 2018, as an increase in the President’s popularity began negatively affecting the premium.
Estudo de Evento do Choque na Política
Climática nos EUA
José Gouveia
152418008
Sumário
A eleição de Donald Trump, a nomeação de Scott Pruitt e a saída dos EUA do Acordo de Paris criaram expectativas de uma regulação ambiental mais ténue. Esta tese estuda as reações no mercado de ações durante estes eventos, nas empresas do índice Russell 3000. Os investidores recompensaram indústrias intensivas na emissão de CO2, como seria expectável. Contudo, e menos esperado, empresas responsáveis a nível ambiental foram também beneficiadas por estes choques. Tal resultado é explicado pelo aumento geral da consciência climática, espoletado por estes eventos. No longo prazo, o prémio de responsabilidade ambiental cresceu até ao final do ano 2017, estagnando durante todo o ano de 2018. Alterações na influência política de Donald Trump trouxeram consistentemente dois choques diferentes no prémio de responsabilidade climática. Um vindo da percecionada desregulação ambiental, e outro vindo do crescimento geral da consciência ambiental. O choque na consciência prevaleceu até o final do ano 2017, beneficiando empresas ambientalmente responsáveis. O choque da desregulação subrepôs-se durante o ano 2018, com os crescimentos de popularidade do Presidente a afetar negativamente o prémio de responsabilidade climática.
Palavras Chave: Prémio de Responsabilidade Climática; ESG; CSR; Estudo de Evento; Retorno de Ações
This dissertation closes an important chapter in my academic life, and I cannot but feel thankful to a number of people that helped me throughout this journey.
First and foremost, I would like to thank my parents for the lifelong support and all the invaluable lessons that I stubbornly refused to acknowledge at first. I would also like to thank my siblings Pedro, Patrícia and Isabel for the cheerfulness they consistently brought to my life. I especially thank my nephew João, for always being this incredible source of joy, even at times of hardships. I would like as well to show my utmost gratitude to all the remaining members of my family, and hope to be with them soon, after these times of social distancing are over.
I am grateful to my supervisor Professor Eva Schliephake for guiding me through this period. Her wisdom, encouragement and humility not only helped me complete my dissertation but also contributed to making the whole process very enjoyable.
Lastly, I would like to show my gratitude to all my close friends for their constant support and incredible sense of humour. Life is not worth living without a good share of laughs, so I hope I can share with them many more in the future times to come.
2. Literature Review ... 4
Corporate Social Responsibility ... 4
Environmental & Social Responsibility and Financial Markets ... 5
E&S Performance and Companies’ Region of Origin ... 5
CSR and Firm’s Financial Markets Performance ... 6
The Impact of Climate Change on Financial Markets ... 8
Stock Price Reactions to Donald Trump’s Election in 2016 ... 8
3. Dataset and Methodology ... 9
The Events Studied ... 9
The Environmental Performance Variables ... 11
The First Hypothesis: Carbon Intensity ... 11
The Second Hypothesis: Environmental Responsibility ... 12
Relationship Among the Climate Performance Variables ... 13
Control Variables ... 15 Tax Reform ... 15 Trade Policy ... 15 Firm’s Fundamentals ... 15 Abnormal Returns... 16 4. Empirical Analysis ... 20
Industry-Wide Market Reactions... 20
Within-Industry Market Reactions ... 22
Long-Term Analysis and Trump’s Popularity ... 25
5. Robustness ... 30
Alternative Set of Returns and FF 30 Industry Classification ... 30
Alternative Environmental Variable ... 30
Different Estimation and Event Windows ... 31
Controlling for Corporate Governance and Social Responsibility ... 31
Results with Winsorized Data ... 32
Long-Term Returns with Expanding Event Window ... 32
6. Conclusion ... 33
7. References ... 35
List of Tables
Table 1. Descriptive Statistics of Environmental Performance Variables per Industry ... 14
Table 2. Descriptive Statistics of Firm Characteristics ... 16
Table 3. Descriptive Statistics on Stock Returns ... 18
Table 4. Environmental Responsibility and Stock Returns ... 23
Table 5. Environmental Responsibility, Carbon Intensity and Stock Returns ... 24
Table 6. Pricing of Climate’s Strategy and Donald Trump’s Popularity ... 29
Table A1. ASSET4 ESG Data Glossary ... 39
Table A2. Carbon-Intensity and Stock Returns ... 44
Table A3. Main Regressions, including all set of returns and Industry FE ... 45
Table A4. Alternative Regressions: E_Score_R as the Independent Variable ... 46
Table A5. Alternative Regressions: Different Estimation Windows ... 47
Table A6. Alternative Regressions: Different Event Windows ... 47
Table A7. Alternative Regressions: Using Winsorized Data ... 48
Table A8. Controlling for Corporate Governance and Social Responsibility ... 49
List of Figures
Figure 1. Scatter Plots and Correlations Between the Climate Performance Variables. ... 14Figure 2. Estimation and Event Windows ... 17
Figure 3. Abnormal Returns Subsequent to Donald Trump’s Election, by Industry ... 21
Figure 4. Distribution of R-Squares Over the Long Run ... 26
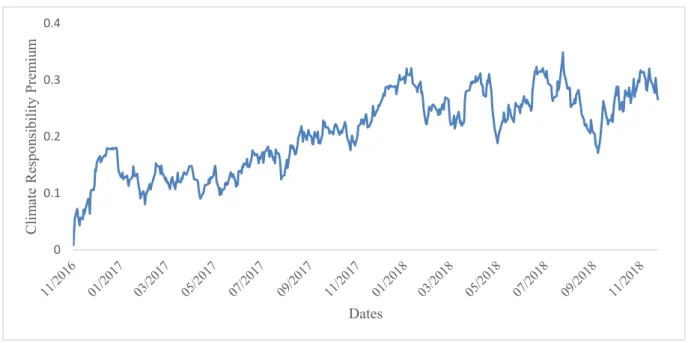
Figure 5. Climate Responsibility Premium Over the Long Run ... 28
1
1. Introduction
Over the past decades, there has been an increasing trend towards climate responsible actions, coming from a wide range of economic agents. Consumers have demonstrated growing concerns related to ethical consumer behaviour, including the consideration of ecological issues (Global CAD, 2019). Nations worldwide have signed the Paris Agreement in 2016, in a collective effort to reduce carbon emissions and fighting global warming. Firms have engaged more in corporate social responsibility, including environmental issues, especially those with higher levels of corporate governance (Ferrell, Liang, and Renneboog, 2016). Investors have not only penalized more carbon-intensive firms (Matsumura, Prakash, and Vera-Muñoz, 2014), but also increased their concerns on climate issues in their investment decisions (Krueger, Sautner, and Starks 2019).
Notwithstanding, it is still not clear to which extent investors value environmental responsibility, based on the information provided in the literature. In general, there is evidence of a climate responsibility premium, but its sources are yet to be explained and quantified. Investors may price climate performance according to real environmental concerns, such as the impacts of global warming on economies; may consider the effects of climate regulations; or may have personal preferences towards climate responsible firms.
The general direction of environmental regulation has been one of slow, but steady progress. At least until November 8, 2016, when a major climate policy shock took place in the United States. Donald Trump’s election shifted all market’s expectations regarding climate policy, as the newly elected President had shown intentions to withdraw the US from the Paris Agreement and scrap the Environmental Protection Agency’s (EPA) Clean Power Plan, during his campaign. The expectations towards environmental deregulation further increased on December 7, 2016, when Scott Pruitt, a climate change sceptic, was nominated to lead the EPA. On June 1, 2017, Trump’s promise to leave the Paris Agreement was delivered, becoming the first significant material shift in climate policy after the election.
These incidents provide a unique setting to study how investors price climate performance. Specifically, these allow to test how shifts in environmental regulation affect the climate responsibility premium. The characteristics of these shocks are also ideal for performing the desired event study. One reason is that Donald Trump’s election was extremely unexpected, with the odds of winning reaching only 17% on Betfair on that same day. Another reason is that
2
all these events had an undeniable impact on climate policy, which potentially should have shifted investors’ attention to firms’ environmental performance, and subsequently adjusting their prices.
Climate performance may be divided into two different segments: carbon intensity and environmental responsibility. Carbon intensity is reflective of a firm’s current environmental footprint (i.e., their levels of CO2 emissions in the present). Environmental responsibility is related to long-term oriented environmental actions and voluntary behaviour to reduce the carbon footprint in the future. Hence, this thesis aims to answer two research questions. Did carbon-intensive firms benefit from the climate policy shock? And were environmentally responsible firms penalized in the stock market from this same shock?
To answer these questions, a study on the stock market reactions of the firms listed in the Russell 3000 is performed, for the following three events: Donald Trump’s election, Scott Pruitt’s nomination, and Donald Trump’s announcement to withdraw the US from the Paris Agreement. The measures of carbon intensity and environmental responsibility are constructed from Refinitiv’s ASSET4 database, which contains major information on Environmental, Social and Corporate Governance (ESG) performance.
An expected result would be one that firms with higher levels of emissions benefitted from these shocks and, indeed, carbon-intensive industries were rewarded relative to others. What is a least expected is that environmentally responsible firms would gain from these events as well. However, the climate policy shock sparked the population’s attention towards climate change issues, increasing the overall environmental awareness. This effect is reflected through the positive reactions the market had on climate responsible firms.
By extending the analysis to the long run, it is possible to see that the premium increased until the end of 2017, stagnating in 2018. When checking for Donald Trump’s daily popularity scores, one can see that in 2017, during the days that his popularity rose, the climate responsibility premium increased as well. In 2018, however, this relationship turned negative. These results suggest that Trump’s political influence consistently brought two shocks on the climate responsibility premium. One coming from the expected deregulation on climate policy, benefitting less responsible firms, and the other coming from the rise in environmental awareness, favouring more responsible ones. The awareness shock prevailed over the first until the end of 2017, and the deregulation shock started overriding the other in 2018, in times the premium stopped increasing.
3
This dissertation follows the approach used in Ramelli, Wagner, Zeckhauser, and Ziegler (2019) to study the impact that the climate policy shock had on environmentally responsible firms and carbon-intensive ones. This study adds further robustness to their results, given the climate performance indicators were extracted from a different ESG data provider. This is relevant, given the construction of these variables, especially for the environmental responsibility score, can be ambiguous, and a significant change in results could occur. The Paris Agreement withdrawal was added to the analysis, to understand how an actual material shift in climate policy was perceived in the market. Furthermore, the long-term analysis was expanded to the end of 2018, including an alternative empirical method. Lastly, several robustness tests that were not included in the original paper were performed in this dissertation, such as covering different sets of event and estimation windows, controlling for corporate social responsibility and testing with winsorized data. Overall, this dissertation goes beyond the original paper by performing a broader set of robustness tests on the main empirical strategy and by presenting new findings on the expanded long-term analysis.
The remainder of the thesis is divided as follows: Section 2 provides a literature review, Section 3 details the data and methodology, Section 4 displays the results on the empirical analysis, Section 5 reports the robustness tests, Section 6 concludes and Sections 7 and 8 present the references and appendices.
4
2. Literature Review
Corporate Social Responsibility
Recent years have been characterized by a rapid growth in research discerning the relationship between firms’ environmental and social (E&S) performance and capital markets. The literature on Corporate Social Responsibility (CSR), however, is not particularly new and can be dated back to Berle and Means (1932), when they laid a new light on the neoclassical economics perspective on corporations.
The neoclassical theory indicates that the forces of supply and demand lead to an efficient allocation of resources, with some exceptions considered as market failures. It is then perceived that it is the role of the state to correct these market inefficiencies, such as externalities, and to redistribute the resources for community goals (Pigou, 1920).
Extending this line of thought, Friedman (1970) states that the sole role of businesses is to maximize their profits, and that the social issues should be scrutinized and dealt with by the government only. Additionally, environmental and social commitments not only extract resources from the firm (Friedman, 1962) but also contribute to agency problems and moral hazard (Jensen, 1986; Baron, 2008), leading to a drop in financial performance and failing to meet with shareholders’ interests.
Opposing this confined view of managers acting solely on the interests of shareholders, the stakeholder theory considers the concerns of a wider array of parties, such as employees, suppliers, customers and government, as relevant to the decision-making process of firms’ management. Berle and Means (1932) favour that firms have the moral obligation to pursue the improvement on problems relevant to society because of the special privileges provided to them. They also argue that social responsibility may bring increased social influence, which in turn brings increased economic power.
The stakeholder value approach is defended by Freeman (1984), presenting both ethical and strategic arguments. On the ethical periphery, Freeman indicates that stakeholders may have a moral allegation on firms because these have the capability to harm or benefit them. Also, it is added that people are required to treat others as ends meet themselves; hence firms should respect stakeholders rather than just treating them as a corporate end (Evan and Freeman, 1990). Freeman finally states that business and ethics discourses cannot be separated such that a
5
business decision is made with no ethical content, or an ethical decision is made with no business content. On the strategic side, by engaging in a broader stakeholder value maximization approach, companies will be able to prosper from advantageous relationships with all the stakeholders in the future. This engagement will allow the firm to have long-term benefits, which in turn will also benefit shareholders in the future. They will also be able to comply more efficiently to outside demands.
Porter et al. (2012) further improve this view, indicating that firms must play a leading role in bringing business and society back together. Michael Porter states that firms still have a narrow view of value creation, maximizing short-term economic gains while failing to address the ever-important customer needs and the vast influences that accomplish long term success. The solution lies in the concept of shared value, which involves generating financial value while also creating value to the society by addressing its needs and challenges. This principle is not represented as social responsibility, philanthropy or sustainability, but as a means to achieve financial success.
Henceforth, Freeman and Porter’s views indicate that CSR activities may be very well compatible with the neoclassical view of profit maximization, especially when the longer term is considered, as firms become more competitive by engaging in these activities (Amel-Zadeh, 2018).
Environmental & Social Responsibility and Financial Markets
The aforementioned literature promoted the rise of research on the relationship between financial markets and E&S corporate performance, thereby providing answers to an already extensive set of questions. Is the firm’s region of origin a relevant factor to its E&S score? Does CSR engagement provide negative or positive financial payoffs? Is there a premium on E&S responsibility in the capital markets, and if so, what are its origins? What is the role of institutional investors on companies’ E&S management decisions? Does climate change affect financial market prices? The section below will shed some light on what has been written by the academia on these propositions.
E&S Performance and Companies’ Region of Origin
In regards to the relationship between a firm’s region of origin perceived E&S relevance and the company’s CSR scores, there is a consensus in the literature that these two are strongly positively related. Liang and Renneboog (2017), working with CSR scores for more than 20,000 firms, from 114 countries, find that a company’s legal country of origin and its CSR rating are
6
highly correlated. The legal origin provides a superior explanation to CSR scores than do other factors such as financial performance, regulatory quality, political institutions and corporate governance at the firm level. As seen through a regression analysis, firms from civil law countries have a 7% higher CSR score than firms from common law countries, which in turn have lower sustainability ratings.
On a similar note, Di Giuli and Kostovetsky (2014), looking into US firms, discover that companies score higher on CSR when they have Democratic founders, CEOs and directors, instead of Republican’s. CSR scores are also higher when the firms’ central offices are in Democratic-leaning states rather than Republican-leaning. Democratic-inclined firms allocate, on average, $20 million more on CSR than do Republican-inclined, or, from another perspective, around 10% of their net income.
In the perspective of institutional investors, Dyck, Lins, Roth, and Wagner (2019) show that foreign institutional investors do drive companies’ E&S performance, but only when these same investors are from countries where social norms reveal an above than average demand for E&S performance.
CSR and Firm’s Financial Markets Performance
A body of research has been devoted to studying whether the expenditure in stakeholder engagement impacts a firm’s profitability. The results from these studies, however, have been inconclusive: some present a positive relation, some a negative relation, and others a mix of both.
On the work from Di Giuli and Kostovetsky (2014), no evidence is found that the companies with higher expenditures on CSR recover from their investment through increased sales. Moreover, the rise of CSR ratings is linked to negative future stock returns and a downturn in firms’ Return on Assets, implying that the gains to stakeholders from social responsibility come with the sacrifice of shareholders’ value.
Krueger (2015), performing a series of event studies to understand how markets respond to both negative and positive CSR news, shows that there are mixed reactions. Investors tend to respond strongly negatively to negative events, and weakly negatively to positive ones. The negative reaction from investors to positive CSR news is most likely related to their perception of increased agency problems. These, however, do react positively to positive CSR news when
7
they come from firms that had a history of poor stakeholder handling, being perceived as performing an “offsetting CSR”.
By examining the impact of CSR on the cost of capital on US firms, El Ghoul et al. (2011) provide supportive arguments to the view that firms engaging in socially responsible practices have higher valuations and lower risk. Applying diverse approaches to estimate companies’ ex-ante cost of equity, they find that firms with better CSR scores exhibit cheaper equity financing. Particularly, the findings indicate that investing in the development of responsible employee relations, environmental policy and product strategies enables a significant reduction on the cost of equity. Furthermore, the study shows that firms linked to “sin” business sectors, namely nuclear power and tobacco, observe higher equity financing costs.
Hong and Kacperczyk (2009) further refine the view that there is a societal norm against financing “sin” stocks. They find that stocks operating in sectors that promote vice, such as the alcohol, tobacco and gaming sectors, are less bought by institutions that are more highly constrained by social norms. For example, mutual funds, which are natural arbitrageurs, are more likely to go long on sin industries than are pension funds. In general, sin stocks not only receive less coverage from analysts relative to other stocks but also have higher expected returns.
Riedl and Smeets (2017) study why investors favour socially responsible mutual funds over others, by linking administrative data to survey replies and behaviour in incentivized experiments. Social preferences and social signalling are found to be an explanatory factor to socially responsible investing (SRI), and financial reasons are less relevant. Socially accountable investors also expect lower returns and pay higher fees on SRI funds as opposed to others.
The literature has shown that shareholders drive E&S conduct on companies across the world. Dyck, Lins, Roth, and Wagner (2019) find that greater institutional ownership is linked to higher firm-level E&S scores, presenting support as well for a causal interpretation on that finding.
Overall, despite not being clear whether firms that perform better on E&S aspects also perform better financially, it is generally agreed that these companies benefit from a premium in the market. That is, all else equal, the average investor is willing to pay more for an environmentally and socially responsible firm than others.
8
The Impact of Climate Change on Financial Markets
A more recent body of literature is showing an increased concern from investors regarding the Climate Change risks. Krueger, Sautner, and Starks (2020) show, through a survey sent to institutional investors, that these already take climate risk as a major indicator to construct their portfolio, and that these risks have already begun to materialize, particularly the regulatory ones. Bernstein, Gustafson, and Lewis (2019), looking into real estate markets, find that homes exposed to sea-level rise sell roughly 7% less than other equivalent but unexposed properties, equidistant from the beach. However, these lower prices are mostly observed in regions that the population believes in the effects of climate change, as demonstrated by Baldauf, Garlappi, and Yannelis (2020). They find that houses predicted to be affected by sea-level rise in believer neighbourhoods sell at a discount relative to homes in sceptic neighbourhoods. Shedding light on this view of collective beliefs, Choi, Gao, and Jiang (2020) show that people raise their beliefs about climate change when facing unusually warm temperatures in their region. Stocks of firms operating in carbon-intensive industries underperform relative to others in abnormally warm weather, plus retail investors are more likely to sell these carbon-intensive stocks.
Stock Price Reactions to Donald Trump’s Election in 2016
Wagner, Zeckhauser, and Ziegler (2018) analyzed how Donald Trump’s election in 2016 shifted the stock market’s expectations on corporate taxes and trade policy. In line with the expectations of future tax reductions, high-tax firms benefitted relative to others in this event. Domestic focused companies fared better than international focused ones because of the expectations of more restrictive trade policies.
To conclude, the literature does indicate that there is a premium on E&S responsible firms in the market. However, the sources of this premium are not yet well defined. According to what was detailed above, not only it isn’t clear whether environmentally and socially responsible firms perform better financially, but also, in some instances, social preferences override financial factors when it comes to investing. This dissertation sheds some lights on the sources of the climate responsibility premium by studying factors such as expectations of future environmental regulation and the general awareness of the public on climate-related issues. These factors encompass both financial and non-financial concerns.
9
3. Dataset and Methodology
The data used to perform the event study consists of the Russel 3000 constituents in the year 2016, when Donald Trump was elected. The index represents the largest 3000 US exchanged stocks, amounting to approximately 98% of all the nation’s public equity market. The selection had to be restricted to these firms only, because that is the extent to which Refinitiv’s ASSET4 database provides information on Environmental, Social and Corporate Governance (ESG) metrics, for US corporations.
The constituents list and their given stock prices were extracted from the Datastream database, as well as all the needed indicators for the calculation of firm-specific fundamentals, in the exception of the Cash Effective Tax rate, which was calculated using data from the Thomson Reuters database.
Daily data for the riskless rate, market excess returns, size and value factor returns were extracted from Kenneth R. French’s website, to compute the CAPM and Fama and French 3 Factor Model adjusted returns.
For the use of a longer-term analysis in the stock price reactions to the events, data depicting Donald Trump’s popularity score during his presidency was extracted from Rasmussen Reports’ daily presidential tracking polls.
Lastly, the indicators used to compute both measures of Carbon Intensity and Environmental Responsibility Scores were extracted from Refinitiv ASSET4 database.
The Events Studied
This study performs an analysis on the stock-price reactions to the following three events affecting climate policy in the United States: Donald Trump’s election for President of The United States on November 8, 2016; Scott Pruitt’s nomination to lead the Environmental Protection Agency (EPA) on December 7, 2016; and Donald Trump’ announcement to withdraw the US from the Paris Agreement on June 1, 2017.
These events provide unique advantages and disadvantages relative to each other to perform an analysis of investors’ reactions to the US Climate Policy shock. On an ideal setting, an event should be unexpected, and the event window shouldn’t include confounding effects. Otherwise, the reactions may be inexistent, or the results may be impacted by other shocks other than the
10
one intended to study (Kothari and Warner, 2007). The three cases examined, despite all representing a shift towards lower expected regulatory pressure on environmental responsibility, present different levels of surprise and shocks to the market.
Donald Trump’s election is an excellent example of an unexpected event. On the morning of the election day, the odds on Betfair and FiveThirtyEight for Hillary Clinton’s victory were 83% and 72%, respectively. Furthermore, the climate policy views from both candidates were poles apart. Hillary Clinton’s take on environmental concerns was similar to the then-President Barack Obama, having intentions to take further actions against global warming and making climate policy a priority1. Conversely, Donald Trump pledged to reverse this trend of greater
environmental regulation. For instance, on his campaign website, it is possible to gather his intentions to “scrap the EPA’s so-called Clean Power Plan which the government estimates will cost $7.2 billion a year”. Moreover, Trump also had intentions to exit the Paris Agreement.
These characteristics represent great strengths for Trump’s election as an event to study the stock price reactions on environmentally responsible firms. However, it comes with disadvantages as well. Trump’s election influenced expectations on many other areas besides climate policy. Controls on aspects such as tax and trade policy will need to be implemented to understand the true impact of his environmental views on firms’ stock prices. A more detailed discussion on this topic is presented on the Control Variables part of this section.
Scott Pruitt’s nomination, on the other hand, represents a less surprising event, and one that wouldn’t deviate as much regarding the views from the other rumoured nominees. However, there was still an element of surprise to his nomination, given that there were other four potential candidates commented by the media (Cama, 2016). Furthermore, Pruitt’s position on climate policy was the most hostile out of all five candidates, showing scepticism on the science of climate change, and actively advocating to dismantle the Green Power Plan (Davenport and Lipton, 2016). The main strength of Pruitt’s nomination is that it is exclusively focused on environmental concerns.
Lastly, Donald Trump’s announcement to leave the Paris Agreement is the least surprising event out of the three, given it was an intention presented throughout the candidate’s campaign. This event, however, has the advantage to represent an actual material shift on climate policy.
1 On Hillary’s campaign website, one can find proposals to “cut energy waste in American homes, schools,
hospitals and offices by a third and make American manufacturing the cleanest and most efficient in the world” (Hillary. 2016).
11
The Paris Agreement brought together, for the first time, 187 nations, representing 97% of the world’s greenhouse gas emissions, for a common cause to commit to efforts to fight climate change. Its central aim was to hold “the increase in the global average temperature to well below 2°C above pre-industrial levels and pursuing efforts to limit the temperature increase to 1.5°C above pre-industrial levels, recognizing that this would significantly reduce the risks and impacts of climate change”. By leaving this agreement, the United States’ government sent a clear message that it was moving towards environmental deregulation.
The Environmental Performance Variables
Two distinct hypotheses are tested in this thesis, one for each environmental performance variable. On one side, it is studied whether carbon-intensive firms benefited from the climate policy shock. On the other, it is tested if climate responsible firms also gained or lost from the same events studied. The empirical strategy is based on regressing abnormal returns against the environmental performance variables – Carbon Intensity and Environmental Responsibility – plus controls on firms’ characteristics.
These two variables are fundamentally different from one another. The Carbon Intensity variable represents the firm’s current environmental footprint only, and the Environmental Responsibility represents the degree of structural changes that the firm is willing to take on to improve its environmental footprint in the medium to long-term. A Company with a high score in the second variable should encompass attitudes towards climate responsibility. Such actions include delineating goals to cut down future emissions and achieving energy efficiency; raising awareness to its employees regarding climate change risks and opportunities; creating specialized teams dedicated to environmental management; being transparent in the report of its emissions; and launching products that have designated effects to improve the environment.
The First Hypothesis: Carbon Intensity
The computation of the Carbon Intensity variable is made by extracting the value of the firm’s estimated total emission of CO2 and CO2 equivalents, in tonnes, from Refinitiv’ ASSET4 database. In order to set this score in values relative to the firm’s size, the levels of emissions are divided by the firm’s Total Assets2.
2 Other valid representations of company size are the EBITDA and Market Capitalization. The results using these
12
𝐶𝑎𝑟𝑏𝑜𝑛 𝐼𝑛𝑡𝑒𝑛𝑠𝑖𝑡𝑦 = 𝑇𝑜𝑡𝑎𝑙 𝐸𝑠𝑡𝑖𝑚𝑎𝑡𝑒𝑑 𝐶𝑂2 𝐸𝑞𝑢𝑖𝑣𝑎𝑙𝑒𝑛𝑡𝑠 𝐸𝑚𝑖𝑠𝑠𝑖𝑜𝑛 𝑇𝑜𝑡𝑎𝑙 𝐴𝑠𝑠𝑒𝑡𝑠
The Second Hypothesis: Environmental Responsibility
Two different Environmental Responsibility variables are used in this thesis. One is the original Environmental Pillar score provided by Refinitiv, and the other is a variable calculated by the author of the thesis using the metrics from the original score, but excluding the carbon intensity indicators.
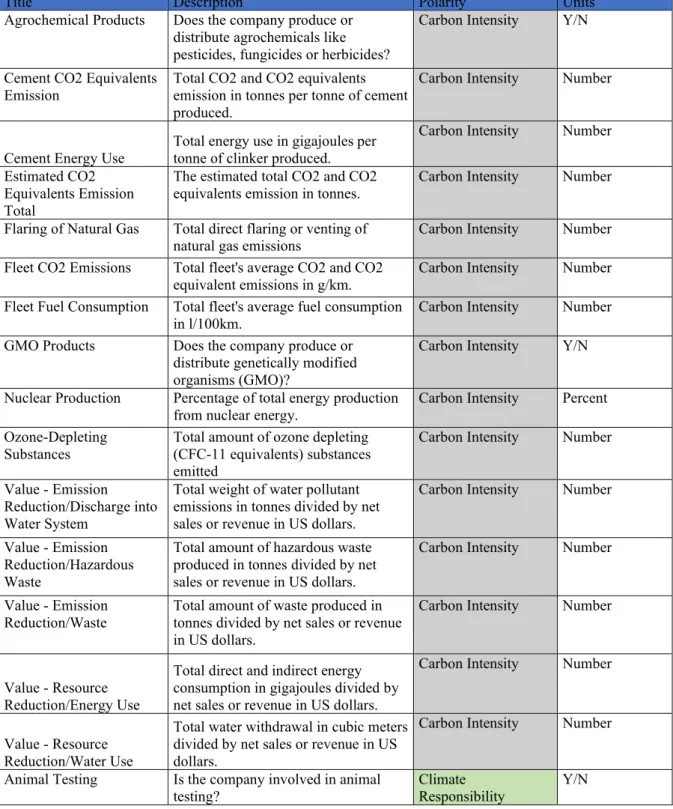
To understand why these two variables are used, it is essential to examine the structure of Refinitiv’s database and how the original score is computed. Refinitiv’s ASSET4 database provides a set of ESG scores, one being the Environmental pillar score. This score is calculated through a weighted average on 61 ESG metrics, which are all described in Table A1 in the appendix. Looking into these variables, one can see that, despite most being reflective of measures to improve future environmental sustainability, 15 of them are purely reflective of the firm’s current carbon footprint. The most evident case is the Total Estimated CO2 Equivalents
Emission variable, which is used to compute the Carbon Intensity score previously described.
Given this situation, the Refinitiv’s Environmental Pillar Score may pose the problem of encompassing both the effects of carbon intensity and climate responsibility on the stock price reactions, when only the latest was meant to be evaluated. In order to avoid this problem, another environmental score is computed, using a similar calculation method from Refinitiv (2019), but excluding all the 15 metrics that represent carbon intensity3.
These scores are denominated as follows:
E_Score_R: Original Environmental Pillar Score provided by Refinitiv;
E_Score: Environmental Score calculated through Refinitiv’s Environmental performance metrics, excluding the carbon intensity ones.
There is one strong argument favouring the inclusion of the carbon intensity indicators on the Environmental score, which relates to investors’ perception of climate responsibility. Investors
13
may not fully see the distinction between a firm’s current environmental footprint and its commitment to improving environmental performance in the medium to long-term. It should be the case that they see Environmental Responsibility as a bundle of these two characteristics, as the major ESG rating agencies build their scores in that fashion, and investors, in turn, rely on these evaluations to build their E&S responsible portfolios (Escrig-Olmedo et al. 2019). Hence, it is relevant to perform the empirical analysis using both indicators. The E_Score will be the primary variable throughout the remainder of the thesis, and the E_Score_R will be tested on robustness tests.
Computing the E_Score:
The method to compute this score is similar to the one used by Refinitiv to calculate the Environmental Pillar Score. As mentioned, all the variables used in the original are also included in this rating, except for the ones that are representative of current environmental footprint. The individual rating for each metric is computed as follows:
𝑀𝑒𝑡𝑟𝑖𝑐 𝑆𝑐𝑜𝑟𝑒 =𝑁𝑜. 𝐹𝑖𝑟𝑚𝑠 𝑊𝑖𝑡ℎ 𝑊𝑜𝑟𝑠𝑒 𝑉𝑎𝑙𝑢𝑒 +
𝑁𝑜. 𝐹𝑖𝑟𝑚𝑠 𝑊𝑖𝑡ℎ 𝐸𝑞𝑢𝑎𝑙 𝑉𝑎𝑙𝑢𝑒 2
𝑇𝑜𝑡𝑎𝑙 𝑁𝑜. 𝐹𝑖𝑟𝑚𝑠
After all individual metric scores are computed, the firm’s overall Environmental score is calculated through an equal-weighted average of all the metrics, presenting a final score between 0 and 1.
Relationship Among the Climate Performance Variables
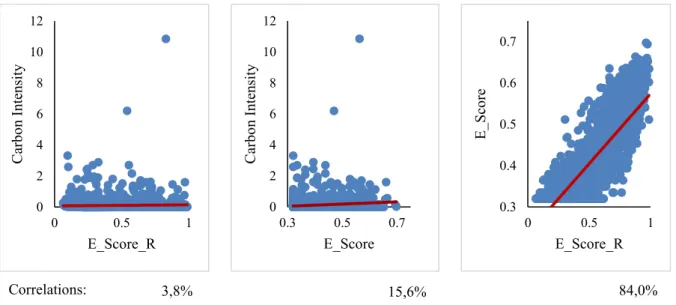
Figure 1 presents the levels of correlation between the three environmental variables on the day of Donald Trump’s election4. The low levels of correlation showcase that there is a clear
distinction between the Carbon Intensity and Environmental Responsibility variables.
4 Coincidently, the latest available scores for ESG metrics are the same on the date of Scott Pruitt’s nomination.
14
Correlations: 3,8% 15,6% 84,0%
Figure 1. Scatter Plots and Correlations Between the Climate Performance Variables.
The sample includes the Russell 3000 constituents on November 8, 2016. The values for both variables are from the latest available date prior to November 8, 2016
As expected, the E_Score_R has a lower correlation level than the E_Score, when correlating against Carbon Intensity. This is the case because the E_Score_R is also composed of metrics related to Carbon Intensity, and these subsequently affect the score negatively.
Table 1. Descriptive Statistics of Environmental Performance Variables per Industry
This table consists of descriptive statistics of the environmental performance variables computed through indicators provided by the Refinitiv’s ASSET4 database, on the Fama and French 12-industries classification. The construction of these variables is detailed on the thesis. The values for both variables are from the latest available date prior to November 8, 2016. The sample includes the Russell 3000 constituents on November 8, 2016.
Industry Carbon Intensity Environmental Score (E_Score)
min mean max sd min mean max sd
Consumer Non-Durables 0.18 6.37 47.63 8.77 12.20 49.65 93.30 23.47 Consumer Durables 0.31 6.48 60.13 8.71 6.78 41.46 86.54 22.02 Manufacturing 0.24 18.74 289.15 41.89 6.41 43.24 96.40 23.62 Energy 0.99 25.82 269.85 35.79 13.79 45.75 94.97 20.55 Chemicals 0.12 56.06 1084.82 148.79 9.72 45.31 91.87 23.47 Business Equipment 0.00 3.40 102.11 8.17 7.18 47.01 98.84 23.83 Telecomunication 0.08 1.93 14.12 2.41 12.63 39.53 90.37 23.26 Utilities 0.14 53.34 258.81 62.24 8.40 50.14 97.16 21.47 Shops 0.05 14.19 620.52 47.93 11.75 45.11 98.74 21.87 Healthcare 0.06 1.58 12.11 1.77 14.05 46.18 98.66 16.32 Money 0.00 0.60 17.46 1.49 16.18 39.50 97.01 19.20 Other 0.00 12.80 245.41 28.42 8.02 42.15 96.77 20.65 0.3 0.4 0.5 0.6 0.7 0 0.5 1 E _Sco re E_Score_R 0 2 4 6 8 10 12 0 0.5 1 C ar bo n In ten sity E_Score_R 0 2 4 6 8 10 12 0.3 0.5 0.7 C ar bo n In ten sity E_Score
15
Interestingly, Carbon Intensity is still positively correlated with both climate responsibility variables, and statistically significant for a 1% significance level. This may be explained by the fact that these types of firms have stricter regulatory requirements to fulfil, but also due to higher public exposure to environmental matters, leading to increased social pressure to better perform in that regard (Tang and Demeritt, 2017).
Control Variables
Donald Trump’s election did not just present a direct shock to climate policy. From expectations of tax reform to a potential trade war, different exogenous impacts from the election arise and must be taken into consideration in this study.
Tax Reform
Prospects of major tax reductions rose when Donald Trump won the election, especially because the Republican party would then control both houses of congress. Trump’s take on tax policy was, among other things, to reduce the corporate tax from 35 to 15 per cent, applicable to all firms (Trump, 2016a). This radically opposes Hillary Clinton’s plan, which focused on increasing taxes on selected income groups (Cole, 2016). Indeed, high tax-paying firms substantially benefitted from the results of the election, compared to low-paying taxes (Wagner, Zeckhauser, and Ziegler, 2018). To control for this effect, I use the same variable as in the just mentioned paper, the Cash Effective Tax Rate, which is the ratio of cash taxes paid to pretax income. To be more precise, it is used the five-year average of that same ratio.
Trade Policy
Wagner, Zeckhauser, and Ziegler (2018) show as well that the stock price reactions for firms with high foreign exposure were negative. The result is mainly explained by the prospects of a trade war and retaliatory tariffs. I control this effect through a variable provided by Datastream, with the percentage of foreign revenues relative to total sales in the year before the event. To simplify, I’ll call it Foreign Exposure for the remainder of the thesis.
Firm’s Fundamentals
Lastly, standard financial accounting data controls are used to control for the companies’ financial health. Return on assets (ROA) is used as a measure of firm’s profitability; debt to total assets as a control for leverage; the natural logarithm of the firm’s market value as an indicator of size; and the net sales percentage growth, relative to the previous year, as a measure of revenue growth.
16
Table 2 presents descriptive statistics on the independent variables, used for the Donald Trump’s election. The latest available data prior to the date of each event is used.
Table 2. Descriptive Statistics of Firm Characteristics
This table consists of descriptive statistics of firm characteristics, computed through indicators provided by Datastream. The construction of these variables is detailed on the thesis. The values for all variables are from the latest available date prior to November 8, 2016. The sample includes the Russell 3000 constituents on November 8, 2016, that had available information on the indicators.
Abnormal Returns
In order to compute the abnormal returns, daily stock returns were extracted from Datastream from October 1, 2015, to January 1, 2019, for all the studied firms. The daily data for the returns on the risk-free asset, market excess returns and the size and value factors were extracted from Kenneth French’s website, for that same time period.
Three sets of returns are considered in this study: Raw returns; Capital Asset Pricing Model (CAPM) adjusted returns; and Fama and French three-factor model adjusted returns.
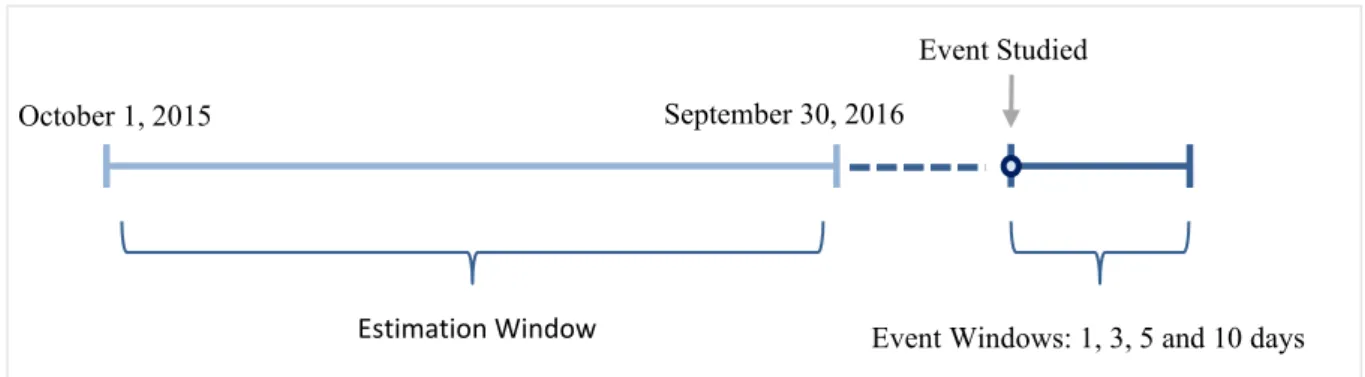
To perform the calculation of the abnormal returns, one needs to define the event and estimation windows. The period over which the stock price reactions of the firms involved are examined is defined as the event window. Event windows of 1, 3, 5 and 10 days were considered, all starting on the day of the event. For a long run analysis, the abnormal returns are also calculated on all days until the beginning of 2019.
The estimation window is used to compute parameters for the CAPM and FF 3 Factor model adjusted returns, which will enable to estimate a normal price in case the event did not occur.
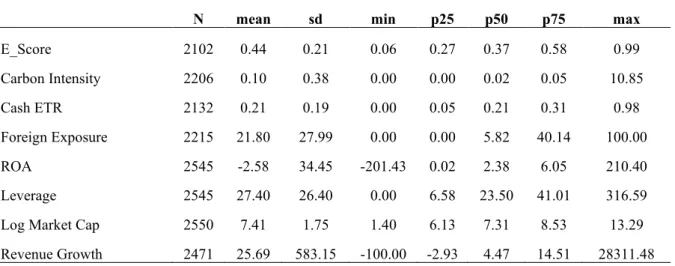
N mean sd min p25 p50 p75 max
E_Score 2102 0.44 0.21 0.06 0.27 0.37 0.58 0.99 Carbon Intensity 2206 0.10 0.38 0.00 0.00 0.02 0.05 10.85 Cash ETR 2132 0.21 0.19 0.00 0.05 0.21 0.31 0.98 Foreign Exposure 2215 21.80 27.99 0.00 0.00 5.82 40.14 100.00 ROA 2545 -2.58 34.45 -201.43 0.02 2.38 6.05 210.40 Leverage 2545 27.40 26.40 0.00 6.58 23.50 41.01 316.59 Log Market Cap 2550 7.41 1.75 1.40 6.13 7.31 8.53 13.29 Revenue Growth 2471 25.69 583.15 -100.00 -2.93 4.47 14.51 28311.48
17
That window has a length of 1 year, from the end of the third quarter of 2015 until the beginning of the fourth quarter of 20165. Figure 2 summarizes these periods.
Figure 2. Estimation and Event Windows
In the literature performing event studies, it is also common to include on the event window the days prior to its occurrence. This decision seems reasonable in scenarios when a section of the market may have had information regarding the event before it became widely known (MacKinlay (1997)). On this thesis, for the Scott Pruitt nomination and the Paris Agreement withdrawal, there is a chance that part of the market could have received the information before it went public. Thus, in the robustness section, I include event windows with the days prior to the incidents as well.
Furthermore, it is also common in the literature to use an estimation window that is close to the actual event (MacKinlay (1997)). The reason for using a common window for the three events, prior to any of them taking place, is that it avoids the parameters to be altered by the shocks from these same events. Nevertheless, on the robustness section, the results are also tested using different estimation windows, closer to the Scott Pruitt nomination and Paris Agreement withdrawal announcement dates.
With the windows defined, it is then possible to calculate CAPM adjusted returns. The measure of systematic risk (beta) is computed running an OLS regression of daily stock returns in excess of the risk-free asset versus the market excess returns, on the estimation window, for each stock. Then, for firm i and date t, the abnormal returns are calculated as follows:
5 For the stocks that didn’t have available data for the entire event window, only those with at least 120 daily
returns observations were considered for the study. This decision is made to avoid defective parameters estimations. A window of 120 daily observations, however, is already considered as one of good length (MacKinlay (1997)).
October 1, 2015 September 30, 2016
Estimation Window
Event Studied
18
𝐴𝑅𝑖,𝑡 = 𝑅𝑖,𝑡 − (𝑟𝑓𝑡+ 𝛽𝑖 × (𝑀𝑘𝑡𝑡− 𝑟𝑓𝑡))
Where ARi,t, Ri,t, rft, Bi and Mktt are the abnormal returns, raw returns, rate of the riskless asset,
market beta and market returns, respectively.
The FF adjusted returns are computed similarly. To calculate the factor exposures, the excess returns of the stocks are regressed against the market excess returns, size and value factors. The abnormal returns are then computed as follows, for firm i and date t:
𝐴𝑅𝑖,𝑡 = 𝑅𝑖,𝑡 − (𝑟𝑓𝑡+ 𝛽1𝑖× (𝑀𝑘𝑡𝑡− 𝑟𝑓𝑡) + 𝛽2𝑖× (𝑆𝑀𝐵𝑡) + 𝛽3𝑖× (𝐻𝑀𝐿𝑡))
Where β1i, β2i and β3i are the coefficients for the market excess returns (Mktt – rft), size factor
(SMBt) and value factor (HMLt).
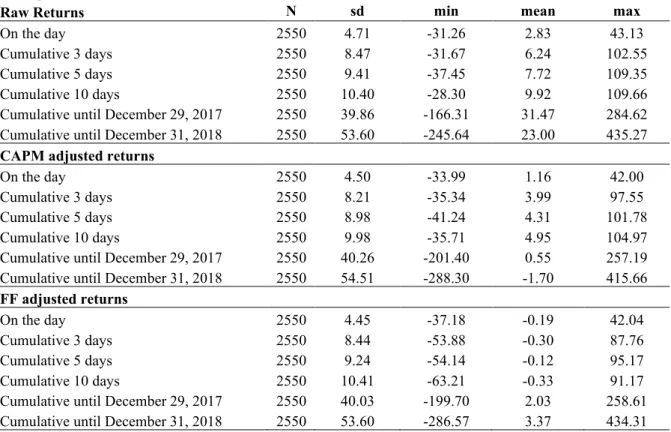
Table 3provides the descriptive statistics on the abnormal returns for all the three events.
Table 3. Descriptive Statistics on Stock Returns
This table consists of descriptive statistics of the stock returns. Panel A represents the stock returns starting on the day after Donald Trump’s election, in November 9, 2016. Panel B represents the stock returns starting on the day of Scott Pruitt’s nomination, on December 7, 2016. Panel C represents the stock returns starting on the day of the Paris agreement withdrawal, on June 1, 2017. Raw returns, CAPM adjusted returns and FF three factor model returns are considered. The computation of these returns is detailed on the thesis. The sample includes the Russell 3000 constituents on November 8, 2016, that had available information on all the indicators.
Panel A:
Trump's Election (November 9, 2016)
Raw Returns N sd min mean max
On the day 2550 4.71 -31.26 2.83 43.13
Cumulative 3 days 2550 8.47 -31.67 6.24 102.55 Cumulative 5 days 2550 9.41 -37.45 7.72 109.35 Cumulative 10 days 2550 10.40 -28.30 9.92 109.66 Cumulative until December 29, 2017 2550 39.86 -166.31 31.47 284.62 Cumulative until December 31, 2018 2550 53.60 -245.64 23.00 435.27
CAPM adjusted returns
On the day 2550 4.50 -33.99 1.16 42.00
Cumulative 3 days 2550 8.21 -35.34 3.99 97.55 Cumulative 5 days 2550 8.98 -41.24 4.31 101.78 Cumulative 10 days 2550 9.98 -35.71 4.95 104.97 Cumulative until December 29, 2017 2550 40.26 -201.40 0.55 257.19 Cumulative until December 31, 2018 2550 54.51 -288.30 -1.70 415.66
FF adjusted returns
On the day 2550 4.45 -37.18 -0.19 42.04 Cumulative 3 days 2550 8.44 -53.88 -0.30 87.76 Cumulative 5 days 2550 9.24 -54.14 -0.12 95.17 Cumulative 10 days 2550 10.41 -63.21 -0.33 91.17 Cumulative until December 29, 2017 2550 40.03 -199.70 2.03 258.61 Cumulative until December 31, 2018 2550 53.60 -286.57 3.37 434.31
19
Panel C:
Paris Agreement withdrawal (June 1, 2017)
Raw Returns N sd min mean max
On the day 2550 2.12 -19.20 1.72 26.59
Cumulative 3 days 2550 3.30 -21.31 1.72 30.62 Cumulative 5 days 2550 4.31 -22.23 1.42 43.72 Cumulative 10 days 2550 5.93 -30.99 3.02 41.26
CAPM adjusted returns
On the day 2550 2.05 -20.45 0.51 24.43 Cumulative 3 days 2550 3.26 -23.87 0.27 30.23 Cumulative 5 days 2550 4.29 -23.96 0.13 41.96 Cumulative 10 days 2550 5.86 -32.22 1.30 37.56 FF adjusted returns On the day 2550 2.12 -20.90 0.01 24.75 Cumulative 3 days 2550 3.24 -24.42 -0.13 29.69 Cumulative 5 days 2550 4.20 -25.34 -0.20 40.94 Cumulative 10 days 2550 5.85 -32.29 0.35 38.52 Panel B:
Pruitt's nomination (December 7, 2016)
Raw Returns N sd min mean max
On the day 2550 2.48 -15.33 0.88 36.81
Cumulative 3 days 2550 4.53 -27.87 2.52 50.06 Cumulative 5 days 2550 5.12 -35.99 1.64 46.64 Cumulative 10 days 2550 6.67 -41.87 2.16 49.55
CAPM adjusted returns
On the day 2550 2.62 -17.91 -0.57 34.77 Cumulative 3 days 2550 4.69 -32.07 0.13 48.71 Cumulative 5 days 2550 5.39 -38.39 -1.09 42.66 Cumulative 10 days 2550 6.89 -44.05 -0.67 45.43 FF adjusted returns On the day 2550 2.42 -15.85 -0.02 35.68 Cumulative 3 days 2550 4.66 -30.71 0.01 48.85 Cumulative 5 days 2550 5.12 -36.77 -0.03 44.28 Cumulative 10 days 2550 6.78 -41.95 -0.25 45.97
20
4. Empirical Analysis
Industry-Wide Market Reactions
The first analysis consists of an industry-wide examination of the stock price reactions to Donald Trump’s election. In the sample composed of the Russell 3000 constituents in 2016, the industries of precious metals, steelworks, utilities, chemicals, transportation, coal, petroleum and natural gas are on top in terms of carbon intensity, when looking to the full 30 Industry classification by Fama and French. These industries also represent about 74% of the full sample CO2 equivalents emissions.
A similar pattern can be found when looking into the figures provided by the Environmental Protection Agency on the Green House Gas Reporting Program (GHGRP), that includes information on the top-emitting sectors of greenhouse gas in the US. These sectors include power plants, refineries, chemicals, waste, metals, pulps and paper, petroleum and others, such as mining. Altogether, these represent 85-95% of all the US greenhouse emissions, if the information reported by the suppliers is included.
Looking into figure 3, one can see that the carbon-intensive industries benefited from Donald Trump’s election in terms of stock market reactions. The graph shows the coefficients for the 30 industry dummies when regressing the CAPM adjusted returns against these dummies, Cash ETR, Foreign Exposure and firms’ fundamentals variables. The event window is one composed of the actual day, on November 9, 2016, and another that prolongs from that same day until the end of 2016. The results are sorted from highest to lowest for the one-day event window.
Investors reacted instantly positively to “dirty” industries, such as coal, steelworks, metals and petroleum and natural gas on the election’s day. The effects towards the end of the year provide a similar picture for carbon-intensive industries, with a specific rise on the petroleum and natural gas, steelworks and transportation industries. However, it also depicts a potential overreaction from the market on the coal and precious markets on the day of the election.
The utilities’ sector was the only carbon-intensive industry that did not face a positive stock price reaction. This may be partly explained by the investors’ expectations of market growth, and their subsequent shifts from low risk to high beta industries (Wagner, Zeckhauser, and Ziegler, 2018).
21
Figure 3. Abnormal Returns Subsequent to Donald Trump’s Election, by Industry
This figure includes the industry coefficients for the regression of CAPM adjusted returns against these same dummies, the Cash ETR, Foreign Exposure and firms’ fundamentals variables, on the day after the election and through the end of the year of 2016. The 30-industry classification is taken from Fama and French’s website, and the sector left out to serve as basis was “Everything Else”. The sample includes the 2471 firms of the Russell 3000 constituents from November 8, 2016 that had available information on all the variables. The values are sorted from highest to lowest on the coefficients for the election’s day returns.
There are, of course, other exogenous shocks that Trump’s election brought to the market that would create industry-wide stock price reactions. For example, the prospects of a trade war shifted the expectations to increased costs on industries that were highly depended on imports, such as apparel, which had the lowest cumulative returns. Trump’s proposition to repeal and
-10.00% -5.00% 0.00% 5.00% 10.00% 15.00%
Utilities Tobacco Products Food Products Beer & Liquor Automobiles and Trucks Apparel Business Equipment Transportation Consumer Goods Communication Personal and Business Services Recreation Chemicals Retail Printing and Publishing Banking, Insurance, Real Estate, Trading Restaraunts, Hotels, Motels Wholesale Business Supplies and Shipping Containers Textiles Construction and Construction Materials Electrical Equipment Fabricated Products and Machinery Petroleum and Natural Gas Healthcare, Medical Equipment, Pharma Aircraft, ships, and railroad equipment Metals, Non-Metallic, Ind. Metal Mining Steel Works Etc Coal
22
replace the Obamacare with Health Savings Accounts (Trump, 2016b) brought uncertainty to the market and, despite the initial positive reaction, the healthcare sector lost significantly through the end of the year as well. On the reverse, the financial industry benefitted from the election’s outcomes, as the regulation on this industry was expected to appease.
This diverse set of policy shocks, other than the climate policy shock, could have potentially affected the market reactions on the carbon-intensive industries as well. Trump’s assertion to restore the manufacturing sector is an example of how these could have benefitted from positive responses. However, it is still remarkable how the carbon-intensive industries benefitted in relative terms to other industries.
Figure 3 does not describe, however, the effects within the industries. As previously mentioned, there was significant variability within the industries in terms of environmental performance, and the same is true for the variability in abnormal returns. The following sub-section will exploit these movements within the industries to investigate how environmental responsibility affected the stock price reactions on the three events.
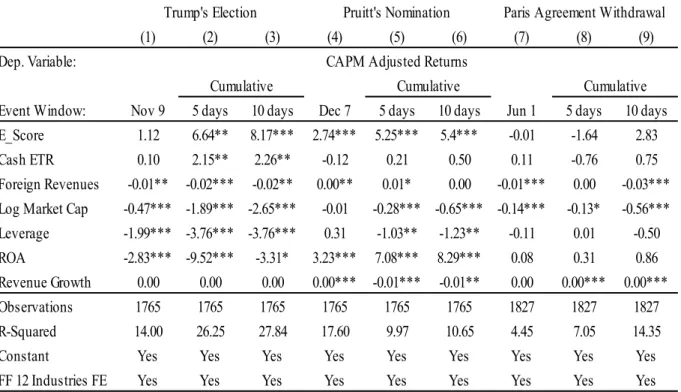
Within-Industry Market Reactions
This section runs the primary empirical strategy explained in the methodology, regressing the cumulative abnormal returns against the climate performance variables, plus controls and industry fixed effects. Table 4 presents the regression results using the CAPM adjusted returns as the dependent variable, and the E_Score as the environmental responsibility variable. For space reasons, the 3 days cumulative abnormal returns are not included in the table.
The effect of environmental responsibility on abnormal returns was not immediate, given it was not statistically significant on the day after Trump’s election. However, and most strikingly, on the 5 and 10 days event windows, one can see that the market reacted strongly positively towards environmentally responsible firms. To be precise, firms displaying a one percentage point higher in the environmental score had, on average, a 0.082 percentage points higher CAPM adjusted returns over the 10 days after the election, ceteris paribus. Economically, this represents a sizeable effect. Given the standard deviation of the environmental score is 0.21 in the sample, a one standard deviation increase in the E_Score represents a 1.47 percentage points (0.21*8.17) increase in the 10 days cumulative CAPM adjusted returns, which is 14.7% of the standard deviation of those same returns.
23
The results are strongly positive, and statistically significant, on all of Scott Pruitt’s event windows. The immediate impact of a one percentage point increase of the E_Score was a 0.028 percentage points in the abnormal returns, and 0.054 percentage points increase in the 10 days cumulative abnormal returns.
The Paris Agreement withdrawal event does not present statistically significant results for the environmental score variable, showing mixed signs throughout the event windows as well.
The coefficients of the control variables are consistent with the results from Wagner, Zeckhauser, and Ziegler (2018). High-tax firms outperformed relative to low-tax firms, and internationally oriented firms underperformed relative to domestically focused ones. Furthermore, and still consistent with their results, increased leverage presents statistically significant negative effects on firms’ performance after the election. The profitability measure (ROA), shows negative effects on Trump’s election, but positive ones on Scott Pruitt’s nomination, while no statistically significant signs on the Paris Agreement Withdrawal.
Table 4. Environmental Responsibility and Stock Returns
This table presents the OLS regression results running the CAPM adjusted returns on the environmental score (E_Score), and the set of control variables (cash ETR, foreign revenues, log market capitalization, leverage, ROA and revenue growth). The computations of these variables are described in the thesis. The sample includes the Russell 3000 constituents on November 8, 2016, that had available information on the indicators. All regressions include FF 12 industry fixed effects. Columns 1 to 3 include Donald Trump’s election day and subsequent 5 and 10-days cumulative returns, respectively. Columns 4 to 6 include Scott Pruitt’s nomination day and subsequent 5 and 10-days cumulative returns, respectively. Columns 7 to 9 include the Paris agreement withdrawal announcement day and subsequent 5 and 10-days cumulative returns, respectively. ∗∗∗ p<0.01, ∗∗ p<0.05, ∗ p<0.1
(1) (2) (3) (4) (5) (6) (7) (8) (9)
Dep. Variable:
Event Window: Nov 9 5 days 10 days Dec 7 5 days 10 days Jun 1 5 days 10 days
E_Score 1.12 6.64** 8.17*** 2.74*** 5.25*** 5.4*** -0.01 -1.64 2.83
Cash ETR 0.10 2.15** 2.26** -0.12 0.21 0.50 0.11 -0.76 0.75
Foreign Revenues -0.01** -0.02*** -0.02** 0.00** 0.01* 0.00 -0.01*** 0.00 -0.03***
Log Market Cap -0.47*** -1.89*** -2.65*** -0.01 -0.28*** -0.65*** -0.14*** -0.13* -0.56***
Leverage -1.99*** -3.76*** -3.76*** 0.31 -1.03** -1.23** -0.11 0.01 -0.50
ROA -2.83*** -9.52*** -3.31* 3.23*** 7.08*** 8.29*** 0.08 0.31 0.86
Revenue Growth 0.00 0.00 0.00 0.00*** -0.01*** -0.01** 0.00 0.00*** 0.00***
Observations 1765 1765 1765 1765 1765 1765 1827 1827 1827
R-Squared 14.00 26.25 27.84 17.60 9.97 10.65 4.45 7.05 14.35
Constant Yes Yes Yes Yes Yes Yes Yes Yes Yes
FF 12 Industries FE Yes Yes Yes Yes Yes Yes Yes Yes Yes
Trump's Election Pruitt's Nomination Paris Agreement Withdrawal
Cumulative Cumulative Cumulative
24
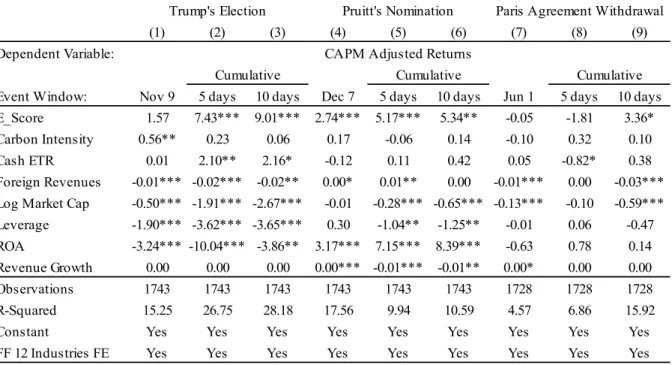
Table 5 presents the results for similar OLS regressions, now including the carbon intensity variable in the list of independent variables. The coefficients for the environmental scores are in line with the results of the first regression, except for one statistically significant positive outcome for the 10 days event window on the Paris Agreement Withdrawal.
As to the carbon intensity indicator, there was an immediate positive impact for high greenhouse gas emitters. For a 10 percentage points increase in carbon intensity, the abnormal returns increased, on average, 0.06 percentage points, all else equal. However, these effects stopped being statistically significant once the event windows were expanded, showing that the investors reexamined their positions on high emitting firms. Furthermore, the carbon intensity factor did not have substantial effects on both Scott Pruitt and Paris Agreement events. This indicates that these events did not have a significant impact on investors’ expectations towards shifts in carbon pricing, or regulatory requirements when looking on the effects within industries. These results are robust when running a regression not including the environmental performance score (Table A2 in appendix).
Table 5. Environmental Responsibility, Carbon Intensity and Stock Returns
This table presents the OLS regression results running the CAPM adjusted returns on the environmental score (E_Score), the carbon intensity measure, and the set of control variables (cash ETR, foreign revenues, log market capitalization, leverage, ROA and revenue growth). The computations of these variables are described in the thesis. The sample includes the Russell 3000 constituents on November 8, 2016, that had available information on the indicators. All regressions include FF 12 industry fixed effects. Columns 1 to 3 include Donald Trump’s election day and subsequent 5 and 10-days cumulative returns, respectively. Columns 4 to 6 include Scott Pruitt’s nomination day and subsequent 5 and 10-days cumulative returns, respectively. Columns 7 to 9 include the Paris agreement withdrawal announcement day and subsequent 5 and 10-days cumulative returns, respectively. ∗∗∗ p<0.01, ∗∗ p<0.05, ∗ p<0.1
(1) (2) (3) (4) (5) (6) (7) (8) (9)
Dependent Variable:
Event Window: Nov 9 5 days 10 days Dec 7 5 days 10 days Jun 1 5 days 10 days
E_Score 1.57 7.43*** 9.01*** 2.74*** 5.17*** 5.34** -0.05 -1.81 3.36*
Carbon Intensity 0.56** 0.23 0.06 0.17 -0.06 0.14 -0.10 0.32 0.10
Cash ETR 0.01 2.10** 2.16* -0.12 0.11 0.42 0.05 -0.82* 0.38
Foreign Revenues -0.01*** -0.02*** -0.02** 0.00* 0.01** 0.00 -0.01*** 0.00 -0.03***
Log Market Cap -0.50*** -1.91*** -2.67*** -0.01 -0.28*** -0.65*** -0.13*** -0.10 -0.59***
Leverage -1.90*** -3.62*** -3.65*** 0.30 -1.04** -1.25** -0.01 0.06 -0.47
ROA -3.24*** -10.04*** -3.86** 3.17*** 7.15*** 8.39*** -0.63 0.78 0.14
Revenue Growth 0.00 0.00 0.00 0.00*** -0.01*** -0.01** 0.00* 0.00 0.00
Observations 1743 1743 1743 1743 1743 1743 1728 1728 1728
R-Squared 15.25 26.75 28.18 17.56 9.94 10.59 4.57 6.86 15.92
Constant Yes Yes Yes Yes Yes Yes Yes Yes Yes
FF 12 Industries FE Yes Yes Yes Yes Yes Yes Yes Yes Yes
Trump's Election Pruitt's Nomination Paris Agreement Withdrawal
CAPM Adjusted Returns
25
Overall, the results oppose to the common hunch that less climate responsible firms were going to be positively affected by these shocks in environmental regulation. Right after Trump’s election, the media was clear at indicating that the rollback on many climate policies was likely going to occur (for example, Bloomberg, 2016). Furthermore, even if investors perceived this shock as a temporary change, with the natural trend of tighter regulation continuing in the future, the negative shock to these firms would not still be explained.
So, why did the environmentally responsible firms benefit relative to others? A potential explanation may be that Trump’s election brought higher levels of awareness to the general public in terms of climate change, creating increased pressure both on firms to move towards future lower emissions and investors to bet on more environmentally responsible firms. Indeed, Yale University and Gallup demonstrated, through opinion polls in 2017, that a record percentage of Americans was concerned about global warming, with 47% ‘worrying a great deal’, as opposed to 39% in 2016.
This type of reverse ripple effect isn’t new to election outcomes. Tesler (2012) shows, for example, that Obama’s legislative proposals on the Healthcare sector polarized opinions by racial issues and race. This racial divide was 20 percentage points greater in 2009-2010 than it was in 1993-1994, over President Bill Clinton’s plan that had similar proposals.
The same type of effects could have been heightened from other major political events on climate regulation, such as the nomination of Scott Pruitt to lead the EPA and US’ announcement to withdraw from the Paris Agreement. The results do indicate that this was the case for Pruitt’s nomination, but not for the Paris Agreement withdrawal.
The next section will, among other things, shed some light as to why investors may not have reacted to the Paris Agreement, looking into the long-term stock returns. Furthermore, it will also enable a further scrutinization as to why investors reacted positively to Trump’s election and Scott Pruitt’s nomination, through increased climate awareness.
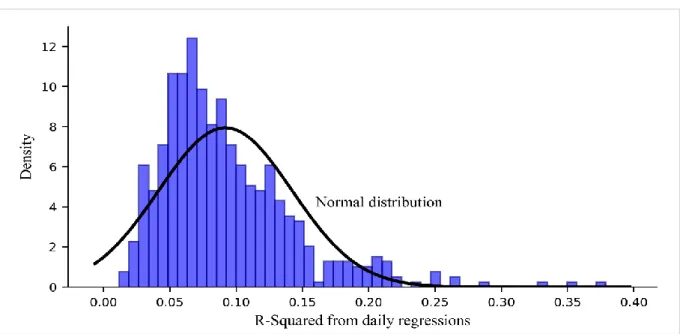
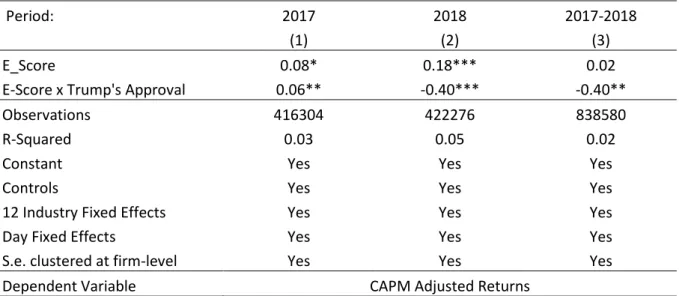
Long-Term Analysis and Trump’s Popularity
This section provides an expansion of the previous analysis to the long run. On figures 4 and 5, CAPM adjusted returns are regressed against the environmental score (plus the usual set of controls), for all days between November 9, 2016, and Dec 31, 2018. The values used for the controls and the environmental performance variable are the latest available relative to each day. The estimation windows follow a daily rolling window, starting in the original interval
26
presented in figure 2, and progressing until reaching the last quarter of 2018. Figure 4 plots the distribution of the R-squares from all these 538 daily regressions.
Figure 4. Distribution of R-Squares Over the Long Run
This figure shows the distribution of the R-squares from the OLS regressions running the daily CAPM adjusted returns on the environmental score, plus the usual set of control variables (cash ETR, foreign revenues, log market capitalization, leverage, ROA and revenue growth) from the day of Donald Trump’s election until end of December 2018. The values of all variables are updated to the most recently available prior to each day. All models include FF 12 industry fixed effects. The sample includes the Russell 3000 constituents on November 8, 2016, that had available information on the indicators each day, averaging 1836 firms. The estimation windows follow a daily rolling window, starting in the period of October 1, 2015 – September 30, 2016 and progressing until reaching the last quarter of 2018.
Most R-squares have a relatively low value, with the sample median being 8.14%. This is not surprising. Given the independent variables are regressed against returns that are already adjusted to the CAPM, one should not expect that these will have great explanatory power for the exceptional shifts on this model every single day. Indeed, these regressions should have higher explanatory power at times a major unexpected event occurs, related to climate policy6
– such as Trump’s election and Scott Pruitt’s nomination – which is the reason these were built in the same place. Notwithstanding, the long-term analysis is useful to provide an understanding as to how the climate responsibility premium evolved overtime after the policy shock.
Looking back to Table 4, one can see that the Paris Agreement withdrawal’s R-squared is only 4.45% for the one-day event window. Compared to the other days where no climate
policy-6 The highest R-squares in the sample occur at times when several updates of firms’ fundamentals are made,