FILIPE LAMEIRA QUINA
SAR IMAGE PROCESSING:
Ship Detection on Open Sea and Coastal Environment
Dissertation for obtaining a Master's Degree in Military Marine
Sciences, in the specialty of Naval Engineering - Branch of Weapons
and Electronics
Alfeite
2019
FILIPE LAMEIRA QUINA
SAR IMAGE PROCESSING:
Ship Detection on Open Sea and Coastal Environment
Dissertation for obtaining a Master's Degree in Military Marine
Sciences, in the specialty of Naval Engineering - Branch of Weapons
and Electronics
Advisor: Professor Doutor Paulo Alexandre Carapinha Marques (ISEL-IT) Co-Advisor: CTEN EN-AEL João Luís Reis Fidalgo Neves (EN)
O Aluno Mestrando
______________
_________________ _____________________________
ASPOF EN-AEL Filipe Lameira Quina Professor Doutor Paulo Alexandre Carapinha Marques
Alfeite
2019
i
Epigraphy
“To the optimist, the glass is half full. To the pessimist, the glass is half empty. To the engineer, the glass is twice as big as it needs to be.”
iii
Acknowledgments
In general, a special thanks to all who contributed in one way or another for the preparation and elaboration of this MSc dissertation.
Many thanks to my advisors who have always show a critical spirit which was fundamental to the fulfillment of this work, two extraordinary persons who were always present and available to guide and show the best path to follow by helping in finding answers and climbing obstacles that would pop up along the way, more specifically to:
- Professor Paulo Marques for the support and motivation given when all seems impossible and when the strengths flew away and also for his patience and proactivity.
- CTEN EN-AEL Fidalgo Neves for the support and the strict hand when needed and also for his availability.
To the Navy and Naval School, for the valences they provided me.
To my family for the motivation given, to my mother for always cheer me up and to my father for always trying to help and for being my inspiration.
Nonetheless, to my fellow comrades, ASPOF AEL Santos Batista, ASPOF EN-AEL Coelho Lourenço and ASPOF M Horta e Costa, for the support and motivation given.
v
Abstract and Keywords
Synthetic Aperture Radar (SAR) is a high-resolution ground-mapping technique with the ability to effectively synthesize a large radar antenna by processing the phase of a smaller radar antenna on a moving platform like an airplane or a satellite. SAR images, due to its properties, have been the focus of many applications such as land and sea monitoring, remote sensing, mapping of surfaces, weather forecasting, among many others. Their relevance is increasing on a daily basis, thus it’s crucial to apply the best suitable method or technique to each type of data collected.
Several techniques have been published in the literature so far to enhance automatic ship detection using Synthetic Aperture Radar (SAR) images, like multilook imaging techniques, polarization techniques, Constant False Alarm Rate (CFAR) techniques, Amplitude Change Detection (ACD) techniques among many others. Depending on how the information is gathered and processed, each technique presents different performance and results. Nowadays there are several ongoing SAR missions, and the need to improve ship detection, oil-spills or any kind of sea activity is fundamental to preserve and promote navigation safety as well as constant and accurate monitoring of the surroundings, for example, detection of illegal fishing activities, pollution or drug trafficking.
The main objective of this MSc dissertation is to study and implement a set of algorithms for automatic ship detection using SAR images from Sentinel-1 due to its characteristics as well as its ease access. The dissertation organization is as follows: Chapter 1 presents a brief introduction to the theme of this dissertation and its aim, as well as its structure; Chapter 2 summarizes a variety of fundamental key points from historical events and developments to the SAR theory, finishing with a summary of some well-known ship detection methods; Chapter 3 presents a basic guideline to choose the best ship detection technique depending on the data type and operational scenario; Chapter 4 focus on the CFAR technique detailing the implemented algorithms. This technique was selected, given the data set available for testing in this work; Chapter 5 presents the results obtained using the
vi
implemented algorithms; Chapter 6 presents the conclusions, final remarks and future work.
Keywords: Automatic Ship detection; Synthetic Aperture Radar; Remote Sensing; Monitoring; Mapping; Sea activity; Sentinel-1;
vii
Index
Epigraphy ... i
Acknowledgments ... iii
Abstract and Keywords ... v
Index ... vii
Figures Index ... xi
Tables Index ... xv
Equations Index ... xvii
List of abbreviations and acronyms ... xix
List of variables ... xxi
1. Chapter 1 – Introduction ... 1
1.1 SAR Technology use and Applications ... 1
1.2 Problem Statement ... 2
1.3 Dissertation Aim and Scope ... 3
1.4 Dissertation Structure ... 4
2. Chapter 2 - State of Art ... 5
2.1 Historical framework and applicability ... 5
2.2 Basic Concepts and SAR properties ... 11
2.2.1 SAR Systems Radar Equation ... 12
2.2.2 SAR Geometry and Acquisition ... 13
2.2.3 SAR Processing and Factors that affect Its Image ... 19
2.3 Ships Detection... 19
viii
2.3.2 Constant False Alarm Rate techniques ... 25
2.3.3 Polarization techniques ... 28
2.3.4 Amplitude Change Detection techniques ... 32
3. Techniques evaluation and selection ... 37
3.1 Basis Guideline ... 37
3.2 Technique Selection ... 39
3.2.1 Data Analysis ... 39
3.2.2 Scenario of application ... 44
4. Chapter 4 – The Algorithms ... 47
4.1 Read Data processing function ... 49
4.2 The dynamic Division processing function ... 50
4.3 Gaussian CFAR function ... 53
4.4 K-means with Gaussian CFAR function ... 60
4.5 Contact Type and Results ... 63
5. Chapter 5 – Results Analysis ... 65
5.1 Establishing the 𝜶 value for optimal results. ... 65
5.2 Calm sea in Near Coast and Open Sea Environment ... 67
5.3 Rough sea in Near Coast and Open Sea Environment ... 70
5.4 Final Remarks ... 72
6. Chapter 6 – Conclusions, Final Remarks and Future Work ... 75
6.1 Conclusions ... 75
6.2 Final Remarks ... 76
6.3 Future Work ... 77
ix
ANNEX 1 – Developed Algorithms ... 85
1. ReadFiles Code set ... 85
2. DynamicDiv Code Set ... 88
3. Gaussian CFAR Code set ... 89
4. K-means with Gaussian CFAR Code set ... 93
5. Contact type Settings ... 98
ANNEX 2 – Paper About Ship Detection Techniques ... 99
xi
Figures Index
Figure 1 - Major SAR Satellites timeline. Source: “Echoes in Space” course from EO College. (ESA EOCollege, 2019) ____________________________________________________________________________________________ 6 Figure 2 - Tx/Rx of a satellite. c =light speed; R = distance to target. __________________________________ 12 Figure 3 – Illustration of the Tx/Rx process of a radar signal. __________________________________________ 13 Figure 4- SAR Strip Map geometry. Source: (NASA, 2018) ______________________________________________ 14 Figure 5 - Simulation of a Synthetic Aperture. Source: (Wolff, 1983) __________________________________ 15 Figure 6 - StripMap mode (SM). Source: (P.Marques, 2016). ___________________________________________ 16 Figure 7- InSAR mode. _____________________________________________________________________________________ 17 Figure 8- Spotlight mode. Source: (P.Marques, 2016). __________________________________________________ 17 Figure 9 - ISAR mode (P.Marques, 2016). ________________________________________________________________ 18 Figure 10- SCANSAR mode. Source: (P.Marques, 2016). ________________________________________________ 19 Figure 11 - SAR Geometry. Source: (Ouchi, 1985). ______________________________________________________ 22 Figure 12 - Synthetic aperture split process. Source: (Ouchi, 1985). where N is the total of looks, L= V/T is the full synthetic aperture length and 𝑊𝑥𝑛(𝜉) is the rectangular window of look n. _________ 22 Figure 13 - Detection of a moving target. Source: (Ouchi, 1985). ______________________________________ 23 Figure 14 - RADARSAT-1 data set visualization and specs. Source: (Marques P. , 2013). ____________ 24 Figure 15 - Results obtained and explanation of the use different windows. Source: (Marques P. , 2013). _______________________________________________________________________________________________________ 25
Figure 16 - Target Area for analysis. Source: (Liao, Wang, Wang, & Jiang, 2008) ______________________ 27
Figure 17 - Ship Detection based on CFAR algorithms. (a) - alpha stable distribution; (b) - Weibull distribution and (c) - K-distribution. Source: (Liao, Wang, Wang, & Jiang, 2008) _____________________ 27 Figure 18 - Block Diagram of Segmentation based CFAR algorithm. Source: (Liao, Wang, Wang, & Jiang, 2008). ________________________________________________________________________________________________ 28
xii
Figure 19 - San Francisco Bay, USA. (a) Google Earth image of the area (b) Pauli RBG image of the RADARSAT-2 fullly polarimetric data set. (Reza Shirvany, Marie Chabert and Jean-Yves Tourneret, 2012) ________________________________________________________________________________________________________ 29 Figure 20 - (a) Nautical chart showing buoys positions. (b) - (f) Maps of the DoP over San Francisco Bay in different hybrid/compact and linear dual-pol modes. (b) HH-HV. (c) VH - VV. (d) HH-VV. (e) CL-pol. (f) 𝜋/4. Source: (Reza Shirvany, Marie Chabert and Jean-Yves Tourneret, 2012) ___________ 30 Figure 21 -(a) Pauli RGB image of test area from San Francisco Bay, RADARSAT-2 fully polarimetric data set. (b) - (f) Maps of DoP over the test area in diferent hybrid/compact and linear dual-pol modes. (b) HH-VV. (c) VH-VV. (d) HH-VV. (e) CL-pol. (e)𝜋/4. (g) ship Detection results, based on quad-pol data. Source: (Reza Shirvany, Marie Chabert and Jean-Yves Tourneret, 2012) ____________ 31 Figure 22 - Pauli RGB image of the NASA/JPL UAVSAR fully polarimetric data set from the Deep water Horizon oil spill in northern Gulf of Mexico,USA. Source: (Reza Shirvany, Marie Chabert and Jean-Yves Tourneret, 2012) _______________________________________________________________________________ 31 Figure 23 - Oil-slick property/type recognition using the Dop (DB) in dual-pol SAR. (a) VH-VV. (b) HH-VV. (c) CL-pol. (d) . The region is a subset of UAVSAR data set. Source: (Reza Shirvany, Marie Chabert and Jean-Yves Tourneret, 2012) ________________________________________________________________ 32 Figure 24 - SAR Amplitude Change Detection processing chain starting from detected input
products. Souce: (Sharma, Caves, Greene, & Fernando, 2018). _________________________________________ 33 Figure 25 - Pairwise ACD applied to RADARSAT-2 XF data for harbour monitoring near Murmansk. Chip size is +/- 2.3 x 1.3 km. Source: (Sharma, Caves, Greene, & Fernando, 2018). __________________ 34 Figure 26 - Time Series applied to RADARSAT-2 XF data for infrastructure monitoring. Top Image: Radar change map; Middle Image: orthophoto from Bundesant für Kartographie und Geodäsie; Bottom Image: SAR time series at location A. Source: (Sharma, Caves, Greene, & Fernando, 2018) 35 Figure 27 - Illustration of a phased array. Source: (Benson, 2019) ____________________________________ 40 Figure 28 - Sentinel 1 operating modes. Source: (ESA - European Space Agency, 2018) _____________ 41 Figure 29 - Processing Flow. Source: (ESA - European Space Agency, 2018) _________________________ 42 Figure 30 - Graphical Representation of Sentinel-1 Core Products. Source: (ESA - European Space Agency, 2018). ______________________________________________________________________________________________ 43 Figure 31 - IW products. Left side is IW SLC bursts and sub swaths. Right side is the IW GRD product. Source: (ESA - European Space Agency, 2018).________________________________________________ 44
xiii
Figure 32 - Portugal EEZ and the proposed platform extension (Noctula - Consultores em ambiente, 2018). _______________________________________________________________________________________________________ 45 Figure 33 - Comercial Routes around the World (The spatial organization of transportation and mobility, 2018). ____________________________________________________________________________________________ 45 Figure 34 - Algorithm's Interaction structure. ___________________________________________________________ 47 Figure 35 - SNAP Operations and Configurations. _______________________________________________________ 48 Figure 36 - Sentinel SAR image visualization, acquiered in a descending pass. _______________________ 50 Figure 37 - Sentinel-1 SAR image read from Matlab. ____________________________________________________ 50 Figure 38 - Segment Dimensions. The result will be segments of 1081x1921 pixels. ________________ 51 Figure 39 - Plot of all the created Image Segments. _____________________________________________________ 53 Figure 40 - CFAR Window formation process. ___________________________________________________________ 54 Figure 41 - Standard diagram for Gaussian distribution. _______________________________________________ 56 Figure 42 - Processing Image delimitation. ______________________________________________________________ 58 Figure 43 - Code lines to establish the pixels for each image corner. __________________________________ 58 Figure 44 - Steps to Mean Calculus. _______________________________________________________________________ 59 Figure 45 - Steps to Standard Deviation Calculus. _______________________________________________________ 59 Figure 46 - Example of the output resulting from the Gaussian CFAR algorithm implementation, 𝛼 = 6. _____________________________________________________________________________________________________________ 60 Figure 47 - Clustered Image. ______________________________________________________________________________ 62 Figure 48 – K-means with Gaussian CFAR algorithm output. ___________________________________________ 62 Figure 49 - Ships list Table. ________________________________________________________________________________ 63 Figure 50 - Gaussian CFAR algorithm output with α = 1. ________________________________________________ 66 Figure 51 - Gaussian CFAR output with α = 6. ___________________________________________________________ 66 Figure 52 - K-means with Gaussian CFAR algorithm with α = 8 ________________________________________ 66
xiv
Figure 53 - Sentinel-1B SAR image from Gribaltar Zone. _______________________________________________ 67 Figure 54 - Gaussian CFAR algorithm applied in Open sea Segment. __________________________________ 68 Figure 55 - K-means with Gaussian CFAR algorithm applied in Open sea Segment. __________________ 68 Figure 56 - Gaussian CFAR algorithm applied in Near Coast Segment under calm sea conditions. __ 69 Figure 57 - K-means with Gaussian CFAR algorithm applied in Near Coast Segment under calm sea conditions. __________________________________________________________________________________________________ 69 Figure 58 - Sentinel-1A SAR full image taken on January 3, 2019, from Portugal Coast. _____________ 70 Figure 59 - Gaussian CFAR algorithm applied in Open Sea Segment under Rough sea conditions. __ 71 Figure 60 - K-means with Gaussian CFAR algorithm applied in Open Sea Segment under Rough sea conditions. __________________________________________________________________________________________________ 71 Figure 61 - Gaussian CFAR algorithm applied in near coast region Segment under Rough sea conditions. __________________________________________________________________________________________________ 72 Figure 62 - K-means with Gaussian CFAR algorithm applied in Near Coast region Segment under Rough sea conditions. ______________________________________________________________________________________ 72 Figure 63 - Sentinel hub visualization. _________________________________________________________________ 105 Figure 64 - Sentinel hub products visualization. _______________________________________________________ 106 Figure 65 - Sentinel product's name nomenclatare. ___________________________________________________ 106 Figure 66 - Sentinel procdut's operations. _____________________________________________________________ 107
xv
Tables Index
Table 1 - Sums of the Organizations, its Satellites and its Missions. Adapted from UNAVACO,2018. Source: (Goulão, 2018). _____________________________________________________________________________________ 8 Table 2 - Basis Guideline __________________________________________________________________________________ 38
xvii
Equations Index
Equation (1) Convencional Radar Equation _____________________________12 Equation (2) SAR Radar Equation_____________________________________13 Equation(3) Real Antenna aperture resolution___________________________15 Equation(4) Returned Signal Equation_________________________________21 Equation(5) Slant Range distance Equation for Stationary targets __________21 Equation(6) Slant Range distance Equation for Moving targets _____________23 Equation(7) Amplitude Ratio equation ________________________________34 Equation(8) Segment Area Equation __________________________________52 Equation(9) Probability Density Functio Equation ________________________55 Equation(10) Gaussian Distribution Equation ___________________________55 Equation(11) Expected Value (Mean) Equation __________________________55 Equation(12) Standard Deviation Equation______________________________55 Equation(13) CFAR Numerical Method for Gaussian distribution equation _____56 Equation(14) Variance equation ______________________________________59 Equation(15) Minimal Distance equation________________________________61 Equation(16) Euclidian Distance equation_______________________________61
xix
List of abbreviations and acronyms
ACD – Amplitude Change Detection AR – Amplitude Ratio
ASI – Agenzia Spaziale Italiana CFAR – Constant False Alarm Rate
C-SAR - C-band Synthetic aperture Radar CSA – Canadian Space agency
DARA/DLR – German Aerospace Center DoP – Degree of Polarization
DLR - Deutsches Zentrum für Luft- und Raumfahrt e.V. Dual-Pol – Dual Polarization
EEZ – Exclusive Economic Zone
ERS - European Remote-Sensing Satellite ERS-1 - European Remote-Sensing Satellite-1 ERS-2 - European Remote-Sensing Satellite-2 ESA – European Space agency
EU – European Union
EW – Extra-Wide swath mode FM – Frequency Modulated FR – Full Resolutions
GRD – Ground Range Detected
IEEE - Institute of Electrical and Electronics Engineers HR – High Resolutions
InSAR – Interferometric Synthetic Aperture Radar ISAR – Inverse Synthetic Aperture Radar
xx ISRO – Italian Space Agency
IW – Interferometric Wide swath mode JAXA – Japan Aerospace Exploration Agency JPL – Jet Propulsion Laboratory
KARI - Korean Aerospace Research Institute MR – Medium Resolutions
NASA – National Aeronautics and Space Administration MATLAB - MATrix LABoratory
PDF – Probability Density Function PRT – Pulse Rate Time
Quad-Pol – Quad Polarization RCM – Range Cell Migration RGB – Red Green Blue RCS – Radar Cross Section Rx - Reception
SAR – Synthetic aperture radar
SeaSAT - Sea Satellite (Oceanographic Satellite) SIR - Shuttle Imaging Radar
SIR-C/X-SAR - Shuttle Imaging Radar with Payload C/X-SAR) SLC – Single Look Complex
SM – Strip Map
TS-CFAR – Truncated Constant False Alarm Rate Tx – Transmission
USA – United States of America UAV – Unmanned Aerial Vehicle WV – Wave mode
xxi
List of variables
Tx - Transmission signal Rx - Reception signal c - Speed of light R - Distance to target Pr - Reception power Pt - Transmission power 𝜎 - Radar cross section D - Antenna physic aperture G - Antenna gainNa - Synthetic aperture Tp - Pulse time
∆𝐴𝑅 - Dimension of a real aperture 𝛼 - Diffraction angle
𝜆 - Wavelength
𝐸0 - Scattering amplitude 𝜔 - Pulse center frequency 𝜃 - Radar look angle V - Wave velocity
L - Synthetic aperture length 𝑣𝑟 - Slant range velocity 𝑣𝑥 - Azimuth velocity 𝑔𝑛 - Stokes parameters
𝛼n - Stokes parameters for dual-pol 𝐴𝑥, 𝐴𝑦 - Amplitude vectors
xxii 𝛿𝑥, 𝛿𝑦 - Phase value 𝑡 - Time Ψ - Coherency Matrix 𝑎1, 𝑎2 - Wave amplitude 𝜃1, 𝜃2 - Phase values 𝐸𝑟 - Scattering vector 𝐸𝑡 - Transmitted vector 𝑆 - Scattering matrix 𝑞𝐴𝑅 - Amplitude ratio 𝐼1, 𝐼2 - Intensity values 𝑥𝑖 – data point
𝑐𝑘 – the centroid of k cluster 𝜎 – Standard deviation
𝜇 – Expected value (mean)
1
1. Chapter 1 – Introduction
This Chapter is divided into 4 sections: First, a brief description of the purpose of SAR technology, its advantages and its applicability are presented as a kick-off for this MSc dissertation; Second, the formulation of the problem for which it is intended to offer an effective and efficient solution is made; Third, a description of the objectives of the MSc dissertation is presented; Finally, the last section will detail the dissertation structure.
1.1 SAR Technology use and Applications
The objective of SAR technology is to synthesize an antenna with a larger aperture than the real aperture of the used antenna, i.e., SAR synthesizes an aperture of a much bigger antenna with the use of a smaller one (Owens, Marcelin, & Hunt, 1997). The antenna is carried by a moving platform, which can be, for example, an airplane or a satellite, where throughout its trajectory it processes the signals that are transmitted, forming a bigger aperture, a synthetic aperture, capable of providing high-resolution images despite any weather conditions (Oliver & Quengan, 2004). Giving this potentiality, the development of SAR technology continues increasing nowadays.
For the last few years, the use of SAR technology has been increasing exponentially. SAR data has been used for several applications not only for land recognition and monitoring such as monitoring agriculture cultures, flood mapping, soil moisture, forestry, terrain analysis and geology of surfaces, but also for sea monitoring and activities such as ship detection, illegal fishing, pollution, drug trafficking, sea state, among many others (Moreira, et al., 2013). Because of SAR characteristics, such as offering high resolution images independent of weather conditions and also because it has the ability to cover wide areas of land and sea in a single swipe, satellites use this SAR technique to gather information about any kind of activity that is occurring on Earth, in order to promote the improvement and innovation of the techniques mentioned before.
2
Nowadays there are several satellites in orbit with the purpose of supplying information for process and analyze according to the needs at hand. One of the biggest agencies in this sector is the European Space Agency (ESA) which launched several satellites such as ERS-1, ERS-2, Envisat, 1, 2 and, Sentinel-3 satellites with the purpose of studying and monitoring Earth and its resources and also its structure comprehension and Earth’s crust dynamics. The Japan Aerospace Exploration Agency (JAXA) also launched several satellites such as JERS-1, ALOS-1 and, ALOS-2 satellites where its missions are redirected to geological phenomena, land use (agriculture, forestry), observation of coastal regions, geological maps, environment, disaster monitoring, and so on. The Canadian Space Agency (CSA) with Radarsat-1 and Radarsat-2 with the main function of observing Earth to monitor climate changes. There are more agencies and organizations, with their own satellites, focused on the development of numerous applications either in civil or military context such as Japan Aerospace Exploration Agency (JAXA), Deutsches Zentrum für Luft- und Raumfahrt e.V. (DLR), Indian Space Research Organization (ISRO), Italian Space Agency (ASI), National Aeronautics and Space Administration (NASA), Land Remote-Sensing Satellite (LANDSAT), among others.
Furthermore, due to fact that Portugal has one of the biggest exclusive economic zones, with a total of 1,727,408 Km² to monitor and promote safety it’s in our navy’s best interest to use every tools to complete its missions more effectively with a higher rate of success.
1.2 Problem Statement
Due to the SAR technology applicability and its advantages as well as the dimensions of the maritime area that the Portuguese Navy is responsible to monitor and promote safety, this MSc dissertation intends to offer a solution can be formulated in the following central question (CQ):
➢ CQ: How to provide an expeditious method of detection and analysis of targets along the Portuguese coast in MATLAB using SAR Imaging?
3
From this major statement arise several derived problems that can be summarized in the following derived questions (DQ):
➢ DQ1: What types of SAR data exists?
➢ DQ2: Where can the SAR images be obtained?
➢ DQ3: What techniques are there to perform this processing?
➢ DQ4: What is the best processing technique for the type of data used? ➢ DQ5: How to validate the results obtained?
To summarize, the problem that this thesis intends to solve is to offer a reliable solution for ships detections in open sea and coastal environment in already focused SAR images by implementing a certain technique.
1.3 Dissertation Aim and Scope
In order to offer a solution to the problem stated in the previous section, the aim of this dissertation can be summarized as follows:
➢ Implement a detection algorithm using real SAR data from available Sentinel-1, A or B, products, taking into account a basic practical guideline, for all kind of sea environment users, which supports them in the selection of a technique which best suits the task at hands. To achieve this main goal this dissertation, initially, scopes a brief summary of some the most important SAR historic events, breakthroughs and developments and main SAR characteristics, concepts and principles, then a review of the most used ship detection techniques is made in order to achieve the second part of the main goal, the elaboration of the basic guideline. Secondly, in this dissertation, the chosen technique resulted from the basic guideline in Sentinel-1 SAR images is tested. Finally, the obtained results from the implementation of the chosen technique are validated through a visual analysis and statistical method.
With this main goal, an answer to the central question and its derived questions it’s presented, where the initial part of the goal described above will answer to the derived questions 1, 2 and 3, the second part will answer to the derived question 4 and finally the visual analysis and statistical method offer a way to answer the last derived question.
4
1.4 Dissertation Structure
The goal with the summary of SAR history, concepts, properties and principles, which is done in chapter 2, is to provide essential ground proof that it is a more trustworthy technology and presents better results than the conventional radars, as well as verifying the fact that its development and innovation are constantly made. Then, still in chapter 2, several techniques are described, regarding ship detection where each of them is briefly explained and also, for example, the type of data which is more suitable to implement it, some advantages and disadvantages and finally in what scenario it is more efficient. To complement this analysis, chapter 3 gives a basic guideline to remote sensing researchers, engineers or operational decision-makers for selecting the most suitable ship detection technique for the problem at hand.
Furthermore, a practical example is given by applying the proposed basic guideline to select the most appropriate ship detection technique to the data set available for this MSc Dissertation: Sentinel-1 products. The used product type and operational scenarios are described.
In chapter 4, the implemented algorithm for the selected technique (CFAR) is fully described. In chapter 5 the obtained results are analyzed and discussed in a number of different operational scenarios. This is done supported on a visual analysis of the obtained results and by comparing the results gathered by other works that use similar techniques and also the same type of data.
Finally, in chapter 6, a summary of all the work done, as well as a discussion about possible future work and advantages of implementing this line of thinking in our Navy is presented.
5
2. Chapter 2 - State of Art
This chapter presents a summary of SAR technology history, including mission timeline and table of relevant organizations using SAR data and its applications. Then a review of basic SAR concepts and properties is made to help understand the advantages, the benefits and the possibilities that come with the use of this technology. Furthermore, the most applied techniques for Ship detection in the present days are introduced listening its advantages and disadvantages, as well as describing their basic principles.
2.1 Historical framework and applicability
Since the invention of the Synthetic Aperture Radar (SAR) in 1951 by Carl A. Wiley, who then made its patenting in 1954 on the United States of America (USA) (Browm & Porcello, 1969), many researches and developments followed the path to improve and innovate this newborn technology which resulted in the launch of the SeaSAT, the first satellite with this technology incorporated, in June 27, 1978.
Figure 1 from “Echoes in Space” course, (ESA EOCollege, 2019), represents the major SAR satellites throughout time where we can highlight those that had the greatest impact on the development of SAR technology:
• SeaSAT, launched in 1978, is the first civilian radar of SAR images with an experimental mission of observation of the Earth during 106 days by the National Aeronautics and Space Administration / Jet Propulsion Laboratory (NASA / JPL). This satellite has proven its effectiveness in the collection of oceanic information, obtaining more data than those obtained during 100 years of research onboard ships (E O College - Universitat Jena, 2017).
• ERS-1 (European Remote-Sensing Satellite-1) of 1991, was the first satellite of the European Space Agency (ESA) ground observation program, after the end of its useful life and verified its performance and based on the knowledge acquired, ERS-2 was then launched in 1995 (European Space Agency, 2014).
6
• SIR-C/X-SAR (Shuttle Imaging Radar with Payload C/X-SAR) is the result of a cooperation between NASA/JPL, DARA/DLR (German Aerospace Center) and ASI (Agenzia Spaziale Italiana), which developed a radar antenna capable of operating in three different bands (C, L, and X). The hardware system allows the antenna dimensions to be carried aboard the cargo bay of the "Space Shuttle Endeavor" (E O College - Universitat Jena, 2017).
Figure 1 - Major SAR Satellites timeline. Source: “Echoes in Space” course from EO College. (ESA EOCollege, 2019)
Nowadays, the list of countries that study and use SAR Satellites is vast. Among them are Japan, Canada, India, Argentina, North Korean and the 22 members of ESA where Portugal is a member through the Space foundation program for Science and Technology, since November 14, 2000. Due to its continuous developments and shown applicability, the interest and use of SAR technology have become more and more required, and because of that, several companies, summarized in table 1, are responsible to gather the information collected from their satellites, and then share it with other countries around the world. Table 1 also summarizes the type of mission that each organization is focused on.
7
Organization Satellites Mission Type
European Space Agency (ESA)
ERS-1, ERS-2, Envisat, Sentinel-1, Sentinel-2, Sentinel-3.
Earth Monitoring, Resources management, and monitor.
Japan Aerospace Exploration Agency (JAXA)
JERS-1; ALOS-1; ALOS-2 Apps regarding:
survey of geological phenomena, land use,
geological mapping,
catastrophes monitor.
Canadian Space Agency (CSA)
Radarsat-1, Radarsat-2, Radarsat constellation
monitor the environmental change and the Earth's natural resources in the microwave region.
Deutsches Zentrum für Luft- und Raumfahrt e.V. (DLR)
TerraSAR-X, TanDEM-X; Apps such as hydrology, geology, climatology, oceanography cartography, etc.
Indian Space Research Organization (ISRO):
RISAT-1, NISAR (com NASA) Use SAR observation capability for apps like agriculture, soil humidity, marine ice, coast monitor, floods monitor, etc.
Comision Nacional de Actividades Espaciales
SAOCOM Management of emergencies
or natural disasters and monitoring of natural resources.
8
Italian Space Agency (ASI) COSMO-Skymed Observation and exploitation of military and civil community data (institutional, commercial).
Instituto National de Técnica Aeroespacial (INTA)
PAZ Earth observation for defense
and security purposes.
Korea Aerospace Research Institute (KARI)
KOMPSat-5 Image supply for apps of
geological information and monitor environmental disasters.
National Aeronautics and Space Administration (NASA)
NISAR (com ISRO) Optimized to measure subtle Earth surface changes associated with crust movements and ice surfaces.
Table 1 - Sums of the Organizations, its Satellites and its Missions. Adapted from UNAVACO,2018. Source: (Goulão, 2018).
As for its applicability, in military or civil context, table 1, it’s shows a great diversity of ways to use the obtained SAR information.
SAR technology, like other remote sensing systems, can be installed on both aerial and space platforms, airborne and spaceborne, respectively (Lacomme, Hardange, Masrchas, & Normant, 2001). Both present advantages and disadvantages while comparing with one another. Airborne systems have the advantage of being more flexible in their ability to relocate and capture data anywhere in the world at any time since the space-borne data collection geometry and timetable are limited by the pattern of the satellite orbit. However, they have the disadvantage of being influenced by variations of speed, movements of the aircraft and adverse atmospheric conditions, lacking additional equipment of navigation and correction of the movements. On the other hand, as an advantage,
9
spaceborne systems are not affected by sudden movements, presenting very stable orbits, requiring geometric correction only for the effects of rotation and the Earth's curvature, and the advantage of being able to capture images faster, in a larger area and with more consistent viewing geometry (Lacomme, Hardange, Masrchas, & Normant, 2001).
Changing focus now to civilian applicability, a very good example for this is the information collected by Sentinel-1, Sentinel-2, and Sentinel-3, on the Copernicus program, which is available to the public, free access and without any associated costs (ESA Copernicus, 2019). It becomes a great utility for maritime surveillance, such as monitoring and warnings about ships, water levels, water pollution and the detection of routes suitable for breaking the ice, identifying the best safe passage areas essential to navigation, among many others.
The Echoes in Space course (E O College - Universitat Jena, 2017) divides civilian applications in three wide areas:
• Terrestrial observation and continuous observation techniques; • Maritime observation and related activities;
• Impact on environmental disasters.
It is important to mention that all this is possible due to not only because of the unique advantage that SAR offers which is the possibility to operate during day and night, as well as being independent of atmospheric conditions, but also because some satellites have capacity to emit at different wavelengths, usually between bands1 X, L, C or P, which present different levels of penetration in the materials (E O College - Universitat Jena, 2017).
1 Radar Bands: P band [0.25 - 0.5GHz/ 60 – 120cm]; L band [0.5 - 1.5GHz/ 20 - 60cm]; C
10
The possibility of using other SAR techniques such as polarimetry, which allows images with characteristics of color, aspect, roughness, patterns and radiometric intensity to be obtained, allows different information on vegetation types, respective volumes and forest health, mapping, calculating lost and reset quantities, support age of forest support, and biomass derivation, crucial for understanding the carbon cycle, essential to climate stability, enabling monitoring. In short, SAR technology allows mapping under terrestrial biomass, glacier movements, ionosphere, terrestrial topography under large vegetation and subsurface geology. In urban areas, this technology allows monitoring the extension, structure, and growth of cities, identifying and quantifying the present objects (roads, buildings or urban vegetation), making it possible to create 3D digital surface models that are very important for planning, better planning practices. These are only a few examples of applications in the civil environment. There are countless others referred on “Applications of Satellite Imaging Radar”, (M.R. Inggs, s.d.), and on “Synthetic Aperture Radar (SAR): Principles and Applications”, (Alberto Moreira - German Aerospace Center (DLR)).
Now looking to the military field, SAR technology because of its characteristics and advantages, such as high-quality images, independence of weather conditions and the ability to provide information whether on daylight or in his absence, is used in several military mission’s scenarios.
Regarding the military context, several examples can be given, like the role of this technology for Earth mapping on “U.S. Department of Defense’s space-based radar programs”, the NASA ongoing developments such as mapping of other planets, Intelligence, Surveillance and recognition programs in battlefield scenarios, among others (Mchale, 2016). Aircraft and ships around the world already have this technology onboard and it has proven to be effective by accomplishing the goals of their missions. Examples such as the F-22 which is considered the best “air-to-air” platform capable of pursuing targets in a square mile range, target focusing and photography and be weather independence, the Boeing P-8 Poseidon with a “APY multi-mode synthetic aperture radar”, (Military-Today, 2018) (Keller, Army orders 20 MQ-1C Gray Eagle attack and reconnaissnce UAVs and control stations, 2017),
11
among many others practical examples. SAR technology is constantly originating new activities and new technologic developments, and mention all of them would be impossible. However it is possible to stay up-to-date on new upcoming technologies or innovations in this field, because there are countless magazines and journal such as “Military and Aerospace Electronics”, (MILITARY & AEROSPACE ELECTRONICS, 2019), Air & Cosmos, (Cochennec, 2019), Air and Space Power Journal, (Air and Space Power Journal, 2019), among many others.
2.2 Basic Concepts and SAR properties
To comprehend why this technique is now widely used and a growing interest in new developments and innovations, it’s important to understand how it works. For this purpose, in this subchapter, it will be made a review of some of its fundamental concepts and properties, in order to make it easier to understand its advantages and benefits. Since SAR theory is a complex and dense topic, it’s important to highlight that the next sections will only give sufficient knowledge to how this technique works.
Starting from the beginning by defining what is a SAR. A Synthetic Aperture Radar (SAR) is, accordingly to National Aeronautics Space Administration, Earth Observatory glossary, “A high-resolution ground-mapping technique that effectively synthesizes a large receiving antenna by processing the phase of the reflected radar return. The along-track resolution is obtained by timing the radar return (time-gating) as for ordinary radar. The cross-track (azimuthal) resolution is obtained by processing the Doppler phase of the radar return. The cross-track 'dimension' of the antenna is a function of the length of time over which the Doppler phase is collected”. Or, accordingly to radartuturial.eu, radar basis, “a coherent mostly airborne or space-borne side-looking radar system which utilizes the flight path of the platform to simulate an extremely large antenna or aperture electronically, and that generates high-resolution remote sensing imagery. Over time, individual transmit/receive cycles (PRT's) are completed with the data from each cycle being stored electronically. The signal processing uses magnitude and phase of the received signals over successive pulses from elements of a synthetic aperture. After
12
a given number of cycles, the stored data is recombined (taking into account the Doppler effects inherent in the different transmitter to target geometry in each succeeding cycle) to create a high-resolution image of the terrain being overflown.” (radartuturial.eu). In lighter terms, it’s a smaller radar that through a moving platform has the ability to create high resolutions images that can cover big areas of earth land or sea. To comprehend how this is possible it is required to understand the principles associated with this technique, thus a quick review is in order.
2.2.1 SAR Systems Radar Equation
For any conventional radar, its purpose is to detect targets and estimate its parameters through the emission of an electromagnetic signal and reception of corresponding echoes. Figure 2 illustrates the operating principle of conventional radars.
Figure 2 - Tx/Rx of a satellite. c =light speed; R = distance to target. It’s through the Conventional Radar Equation (1) that the SAR equation (2) is deduced. By understanding the Tx/Rx process using only one antenna, which is represented in fig. 3, the Conventional Radar Equation, as deduced in many literature works, like (ESA - Earth Online, 2018), can be written as a function of the received power, 𝑷𝒓, as follows:
𝑅𝑎𝑑𝑎𝑟 𝐸𝑞𝑢𝑎𝑡𝑖𝑜𝑛: 𝑃𝑟 = 𝑃𝑡𝑔 4𝜋𝑅2. 𝜎 4𝜋𝑅2. 𝐷 = 𝑃𝑡𝑔 (4𝜋)2𝑅4𝜎. 𝐷 . (1)
13
Figure 3 – Illustration of the Tx/Rx process of a radar signal.
Where Pt represents the transmission power, Pr the received power, σ the target Radar Cross Section, R the distance to the target, D the antenna real aperture and g the gain of the antenna. In short, the radar transmits a signal with a certain transmission power, Pt, and gain, g, which then travels a distance R, accordingly to a spherical model, respecting the factor 1
4𝜋𝑅2, until it reaches the target, then part of
the signal is reflected and received by the radar with a certain received power, Pr, traveling at the same speed (c).
What makes SAR equation (2) different from the equation (1) is that it’s based on the SAR scan process where successive signals are transmitted and received, in addition to the process of a conventional radar, i.e., the received power per pulse necessary to take into account the number of pulses in the time corresponding to the synthetic aperture, 𝑁𝐴, and the pulse time, 𝑇𝑝, resulting as follows (Goulão, 2018):
𝑆𝐴𝑅 𝑅𝑎𝑑𝑎𝑟 𝐸𝑞𝑢𝑎𝑡𝑖𝑜𝑛: 𝑃𝑟𝑆𝐴𝑅 = 𝑃𝑟∗ 𝑁𝐴 ∗ 𝑇𝑝 = 𝑃𝑡. 𝑇𝑝. 𝑃𝑅𝐹. 𝑔2𝜆3
(4𝜋)3𝑅3𝑉𝐿𝜎 . (2)
2.2.2 SAR Geometry and Acquisition
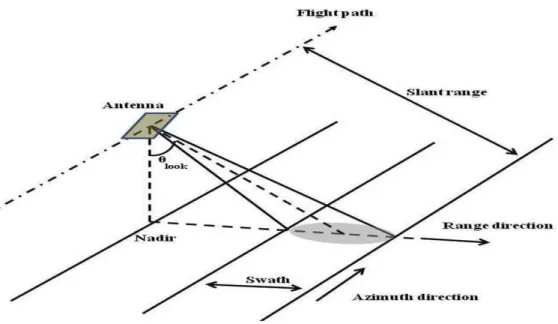
For a better understanding of SAR theory, figure 4 illustrates a Strip Map geometry, which will be explained a posteriori, for geometry acquisition.
14
Figure 4- SAR Strip Map geometry. Source: (NASA, 2018)
Through figure 4 it becomes clear how the synthetic aperture is made. Since the radar is carried along the flight path trajectory through time, the footprint changes and that’s how the simulation of a larger antenna is made, because the system will process all the collected information. Figure 5 illustrates how this processing is made.
15
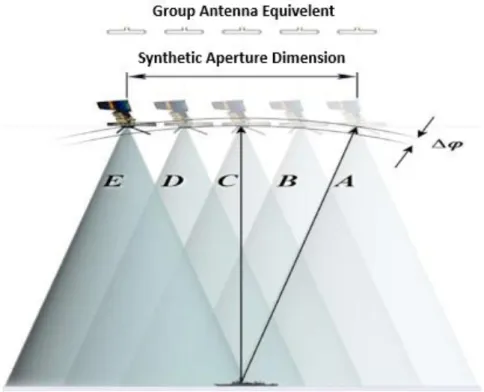
Figure 5 - Simulation of a Synthetic Aperture. Source: (Wolff, 1983)
In figure 5, where A, B, C, D, and E represent the real aperture of the antenna and then after gathering all information through time it simulates a larger antenna with the combination of each real aperture due to the satellite movement, the synthetic aperture.
The interest of simulating a larger antenna is the resolution improvement, i.e. the larger the antenna aperture, the smaller the resolution beam, given the expression:
∆𝐴𝑅= 𝑅𝛼 = 𝑅𝜆
𝐷 , (3)
where R= range and 𝛼 = 𝜆
𝐷= diffraction angle (𝜆 = wave-length and D = antenna physical aperture).
For satellite data acquisition there is a wide diversity associated geometries, such as StriMap (SM); interferometric SAR (InSAR), Spotlight, Inverse SAR (ISAR), SCANSAR, among others (P.Marques, 2016).
16
For SM, represented in figure 6, the antenna illuminates a strip of terrain and collects data continuously with a fixed nadir angle and azimuth angle. In the case of SENTINEL-1, for example, the SM mode acquires data with a visible bandwidth of 80Km and a resolution of 5m by 5m.
Figure 6 - StripMap mode (SM). Source: (P.Marques, 2016).
In the Case of InSAR, in figure 7, a pair, or more, of coherent phase from SAR signals are combined in order to provide three-dimensional information about Earth’s surface (PCI Geomatics, 2018). These coherent phases are taken from slightly different sensor positions or from two SAR signals from very similar viewing geometries of the region under observation, i.e., they can be acquired from the same satellite or two satellites that cover and have similar orbits. It’s by comparing these phases that is possible to determine the elevation and measurements of surface deformations of the terrain. This geometry has several applications such as geophysical monitoring of natural hazards: earthquakes, volcanoes and landslides, glacier motion analysis, digital elevation mapping, among others (ESA, 2018).
17 Figure 7- InSAR mode.
In Spotlight mode, illustrated in figure 8, where the radar has an antenna capable of changing its position, either mechanically or electronically, to illuminate a region of interest for a longer period of time thus synthesizing a larger antenna. In this sense, since the system detects the target much earlier and fails to see it much later, the phase excursion will increase and the resolution increases accordingly. Note that the aperture is as large as the time we are illuminating, so the limit is our mechanical or electronic capability and once again, the topography of the terrain also imposes limitations. This geometry is used when the goal is to obtain a higher resolution of a specific area (Marques P. , High resolution SAR imaging and signal processing, 2016).
18
Figure 9 represents the ISAR mode, where in this situation, the high-resolution images are extracted from a static antenna and the detection is done by moving the target relative to the antenna, processing the data coherently.
This geometry has military relevance since it is used to obtain high-resolution images of the target, i.e., it is of interest, for example, the identification of vessels in marine monitoring actions.
Figure 9 - ISAR mode (P.Marques, 2016).
Finally, the SCANSAR mode, represented in figure 10, provides a wider swath, i.e., it obtains a larger footprint, larger than the spotlight and strip map mode, by changing the illumination angle and rejoin the sub-swath images together during the data acquisition timeframe. In this case, the resolution in azimuth is degraded due to the non-continuous illumination of the terrain, when comparing to the strip map acquisition.
19
Figure 10- SCANSAR mode. Source: (P.Marques, 2016).
2.2.3 SAR Processing and Factors that affect Its Image
SAR basic image formation consists of two steps which are independent of the order they are done, i.e., they are commutative. One is Range Compression and the other one is Azimuth Compression. Combining the results of these two compressions, SAR raw Data originates a SAR image. Despite SAR images can have high resolution in order to be well interpreted, there are some factors which can lead to a not so accurate interpretation and also affects its quality in terms of resolution. Factors like the Range Cell Migration (RCM) which can cause blurring in the output image due to the data dispersion on the matrix caused by the variation of the distance between the radar and the target. Other is speckle which is an unavoidable noise that degrades the SAR image quality due to the surfaces of the materials that represent a spike on the wavelength scale. And a simple moving target can lead to an inaccurate interpretation because the target will be misplaced on the image (doppler effect).
But other factors must be mentioned as well, like Lifting Displacement, Foreshortening, Layover and Radar Shadow effect (ESA - Earth Online, 2018).
2.3 Ships Detection
After reviewing some of Radar history events and its applicability as well as its basic concepts and SAR properties with a focus on making it easier to understand
20
the fundamental aspects of its theory as well as making it more perceptible why this technique is so promising and effective, comes the subject Ship detection. The purpose of this topic has two major reasons. On one hand it’s because of the market opportunities since ESA release Sentinel-1 and Sentinel-2 data for the public use, which means access to a constant source of data to work with and on the other hand, since this is a Naval Military MSc dissertation and Portugal has ones of the largest sea areas at its responsibility, not only to promote and provide navigation safety but also to keep a constant and accurate monitoring of the area. So, for this reason, it seems fit to provide a good base of knowledge in this area by going through the most used techniques for ship detection or oils spills, for example.
As mentioned previously, several techniques have been studied, implemented and improved to enhance automatic ships detection using SAR images (F. Quina, 2019). Depending on how the information is gathered and processed each technique presents different performances and results. Nowadays there are several operational missions underway and the need to acquire better results in ships detection, oil-spill detection or any kind of sea activity monitoring, such as illegal fishing, pollution or drug trafficking, is fundamental to preserve and promote navigation safety as well as constant and accurate monitoring of the surroundings.
In regard to ship detection, either at open sea, near the coast, or in harbor, there are several studies made, such as newly proposed models or just simple demonstrations and study of techniques already known. The next sections will summarize some of the most used and well-established ship detections techniques which are multi-look imaging techniques, Constant False Alarm Rate (CFAR) based techniques, polarization techniques, and amplitude change detections (ACD) techniques. It will be made a brief summary of its principles and characteristics with studies already carried out. Furthermore, Annex 2 presents an article that was produced and present in the Oceans 2019 conference that took place in Marseille about this Ship detection techniques review as well as the elaboration of the Basis Guideline in chapter 3.
21
2.3.1 Multi-look Imaging techniques
This technique is characterized for being able to reduce the speckle at the expense of system resolution, by incoherently adding two or more statistically uncorrelated speckle patterns (Ouchi, 1985).
First, a full synthetic aperture is divided into two or more sub-apertures or “looks” in either time or frequency domain through which the corresponded sub-images are formed and summed on an intensity basis to produce a single final image (Ouchi, 1985). With this technique, stationary targets are correctly imaged, but regarding to moving targets, the scenario is different because the position of the moving targets changes between looks.
SAR multi-look processing principle for static and moving targets is well-known, and it is briefly explained in several publications like (Ouchi, 1985) and (R. K. Raney, 1971). Let us consider a random point, with coordinates x and y in ground azimuth and range direction, respectively, and if the transmitted pulse is linearly frequency modulated (FM), the return signal has the following standard form (Ouchi, 1985): 𝐸(𝑡, 𝜏, 𝑥, 𝑦) = 𝐸0 . 𝑒𝑖𝜔(𝜏−2𝑟𝑐) . 𝑒[−𝑖 𝜋𝛼 2(𝜏− 2𝑟 𝑐) 2 ] , (4) where 𝑟 is the slant range distance radar/target, which is given by:
𝑟2 = (𝑅 + 𝑦 𝑠𝑖𝑛𝜃 )2+ (𝑉𝑡 − 𝑥)2 , (5) Where 𝐸0 represents the scattering amplitude, the pulse envelope and de the far-field beam pattern of the target, 𝜔 is the pulse center frequency, 𝛼 the linear FM rate, 𝑉 and 𝑐 the platform radar and radio wave velocities, respectively, 𝜃 is the radar look angle, 𝑅 the reference slant range distance radar/target, t is the azimuth range time variable which is discrete but can be treated as continuous by providing an appropriate pulse repetition frequency to satisfy the sampling theorem and 𝜏 is the slant range time variable. Figure 11 is the SAR geometry to help understanding its mechanism.
22
Figure 11 - SAR Geometry. Source: (Ouchi, 1985).
The basic principle of this process in splitting the synthetic aperture into looks, i.e., the radar will travel a certain path in a determined period of time, from that it is acquired a synthetic aperture which it will then be divided into sub-apertures in time, the so-called looks. Each look gives different information about the targets that are being observed because these sub-apertures are synthesized at different times. It is possible to distinguish between stationary and moving targets and potentially estimate their velocities. Giving a visual of the split process figure 12 demonstrates how it’s done.
Figure 12 - Synthetic aperture split process. Source: (Ouchi, 1985).
where N is the total of looks, L= V/T is the full synthetic aperture length and 𝑊𝑥𝑛(𝜉) is the rectangular window of look n.
23
For moving targets, the principle is the same but the equation (5) is rewritten by (Ouchi, 1985):
𝑟2 = (𝑅 + 𝑣𝑟𝑡 )2+ (𝑉 − 𝑣𝑥)2𝑡2 , (6) where 𝑣𝑟 and 𝑣𝑥 are the slant range and azimuth velocity components, respectively. Figure 13 demonstrates how the process of a moving target in the range direction, where 𝑦𝑛 are where the radar sees the moving object along its trajectory, i.e., through time, and 𝑇𝑛 are the sub- looks.
Figure 13 - Detection of a moving target. Source: (Ouchi, 1985).
In (Ouchi, Tamaki, Yaguchi, & Iehara, 2004),a technique based on coherence images derived from its cross-correlation in RADARSAT-1 data is tested. This method produces a coherence image by cross-correlating two small images extracted by moving windows from multi-look images (Ouchi, Tamaki, Yaguchi, & Iehara, 2004), i.e., it grabs two sequential “looks” of a multi-look image and originates an image based on the similarities and non-similarities of those two “looks”. The detection of ships is possible because of the higher coherence between the “looks” for ships than for the sea, which it’s easily explained by saying that the sea changes between looks and the ships have always the same form. For this study
24
case, the results were quite reasonable, it was possible to detect the majority of the ships present in the region under study. The following images represent and summarize the studied area and its features and also some conclusions about the obtained results.
Figure 14 - RADARSAT-1 data set visualization and specs. Source: (Marques P. , 2013).
25
Figure 15 - Results obtained and explanation of the use different windows. Source: (Marques P. , 2013).
Another example is the application of Multi-look processing on THz SAR systems to detect moving targets mentioned in (Wuhan, Xia, Liu, & Center, 2018). Here the problem of the slowly moving targets is solved due to the characteristics of THz SAR systems in comparison with the X-band SAR systems. The results obtained in this study show that an algorithm using multi-look processing could provide good results.
2.3.2 Constant False Alarm Rate techniques
Constant False Alarm Rate (CFAR) based technique is the most used technique to detect ships. CFAR is an adaptive algorithm used in radar systems. Generally speaking, it finds a threshold to establish if there’s a ship or not in the analyzed area. This threshold is computed through the background clutter, noise or interference analysis. In its simplest form, the algorithm is a simple clutter adaptive statistic that outputs a CFAR when the background clutter is of a Gaussian distribution (Liao, Wang, Wang, & Jiang, 2008). But the Gaussian distribution is only appropriate if a large number of samples have been average (Liao, Wang, Wang, & Jiang, 2008), so
26
in order to get a better output in terms of accuracy and effectiveness, it’s necessary to determine what is the best suitable probability density function(pdf) that can model the background clutter, noise or interference.
Ship detection from sea clutter is an example of the implementation of a CFAR technique that uses an alpha-stable distribution to best identify slowly moving or nearly stationary targets, (Liao, Wang, Wang, & Jiang, 2008). Here, instead of using the ship’s wake for ship detection, it uses the difference of the radar cross-section (RCS) of a ship from the sea clutter, with an appropriate threshold. This turns out to be effective because the RCS of ships is higher than the sea clutter due to the ships structure and metallic composition which results on multiple reflections (Liao, Wang, Wang, & Jiang, 2008). Regardless of the good performance of the conventional CFAR, using a gaussian distribution, other pdf can also be used to obtain reasonable results such as Weibull or K-distributions. But each of these distributions could sometimes fail to provide a reasonable fit to the amplitude statistics of the clutter and there is where it comes in the alpha-stable distribution which, accordingly to (Liao, Wang, Wang, & Jiang, 2008), it has the potential to model well the impulsive spiky signal present in the sea clutter.
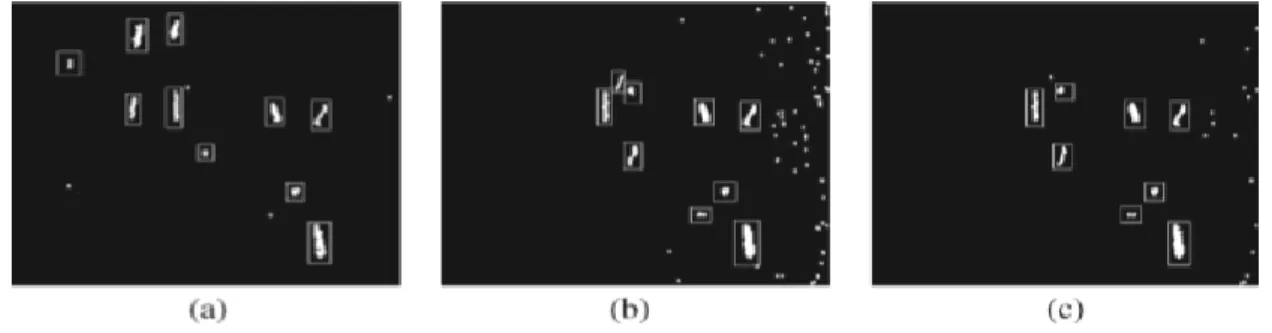
To visually demonstrate the better performance of the 𝛼 stable distribution, in comparison to others, the next figures presents a zone of the surroundings seas near Hong Kong and the outcome of the algorithms used, where each white dot represents an alarm and the ones that are within a box are the real alarm, i.e., the true ships in the area, the rest are false alarms.
27
Figure 16 - Target Area for analysis. Source: (Liao, Wang, Wang, & Jiang, 2008)
Figure 17 - Ship Detection based on CFAR algorithms. (a) - alpha stable distribution; (b) - Weibull distribution and (c) - K-distribution. Source: (Liao,
Wang, Wang, & Jiang, 2008)
Another variation of the CFAR technique is a method that suggests analyzing the sea in two regions, sea region, and buffer region, introduced in (Zhai, Li, & Su, 2016). The approach here is to divide the SAR image into zones: a region with only sea and a region where there are sea and land, i.e., the buffer regions. For sea regions, a variation of a CFAR is used, the truncated statistics CFAR (TS-CFAR), which can provide accurate background clutter modeling and fine detection performance in high-target-density situations (Liao, Wang, Wang, & Jiang, 2008). For the buffer
regions are used a technique based on saliency detection because the CFAR has difficulties regarding the inshore ship detection (Liao, Wang, Wang, & Jiang, 2008). To a better understanding of this process, figure 18 shows the steps made in this CFAR based novel.
28
Figure 18 - Block Diagram of Segmentation based CFAR algorithm. Source: (Liao, Wang, Wang, & Jiang, 2008).
Despite some small differences in each method, it’s possible to identify that CFAR methods present a very good ship detection whereas it is at sea regions, at land and sea regions and even at harbor regions. For each zone, there is a different approach of the conventional CFAR by adding mathematical weight, which, consequently, will increase the computational processing time, but it will improve the performance of ship detection.
2.3.3 Polarization techniques
SAR polarimetry or polarization techniques are more redirected not only to the ship detection but also for its characterization and, for example, oil-spill or other human-made structures such as buoys and oil or gas platforms, because measuring the full scattering matrix allows building a powerful observation space sensitive to shape, orientation and dielectric of the scatters (Moreira, et al., 2013). Each set of polarimetric data provides different information about the area of interest. For single channels polarizations (HH, VV, or HV), HH polarization permits the best ship-sea contrast, whereas VV polarization provides more information on ship-sea surface conditions (Vachon, 2004). Although single channels already provide reasonable results in ship detection and characterization, there are other methods that have been already studied such as dual-pol and quad-pol, which combine either two single channels or four, respectively (Reza Shirvany, Marie Chabert and Jean-Yves Tourneret, 2012). It’s, for example, through the degree of polarization (DoP) that it’s possible to detect and characterize either ships, oil-spills or any other man-made structure in the sea because it helps to determine the nature of the objects that
29
backscatter the electromagnetic field (Reza Shirvany, Marie Chabert and Jean-Yves Tourneret, 2012).
To illustrate the efficiency of this technique the following examples are taken from an article published on the Institute of Electrical and Electronics Engineers (IEEE) with the title “Ship and Oil-Spill Detection Using the Degree of Polarization in Linear and Hybrid/Compact Dual-Pol SAR”, (Reza Shirvany, Marie Chabert and Jean-Yves Tourneret, 2012). The following images are regarded to buoys detection where, in figure 19 and 20, each box represents a different detection mode that has been used and the RADARSAT-2 and google images of the tested area.
Figure 19 - San Francisco Bay, USA. (a) Google Earth image of the area (b) Pauli RBG image of the RADARSAT-2 fullly polarimetric data set. (Reza Shirvany,
30
Figure 20 - (a) Nautical chart showing buoys positions. (b) - (f) Maps of the DoP over San Francisco Bay in different hybrid/compact and linear dual-pol modes. (b) HH-HV. (c) VH - VV. (d) HH-VV. (e) CL-pol. (f) 𝜋/4. Source: (Reza
Shirvany, Marie Chabert and Jean-Yves Tourneret, 2012)
Accordingly to (Reza Shirvany, Marie Chabert and Jean-Yves Tourneret, 2012), the hybrid/compact modes, (e) and (f), can easily distinguish the buoys whereas the linear dual-pol modes, (b) and (c), hardly make their detection and identification. Another fact is that the results acquired from HH-VV mode, (d), are very similar to hybrid/compact modes.
31
Figure 21 -(a) Pauli RGB image of test area from San Francisco Bay, RADARSAT-2 fully polarimetric data set. (b) - (f) Maps of DoP over the test area in diferent hybrid/compact and linear dual-pol modes. (b) VV. (c) VH-VV. (d) HH-VV. (e) CL-pol. (e)𝜋/4. (g) ship Detection results, based on quad-pol data. Source:
(Reza Shirvany, Marie Chabert and Jean-Yves Tourneret, 2012)
Here in figure 21, it is also clear that hybrid/compact modes [(e) and (f)] detect more clearly the targets. Finally, a further study in this paper on oil-spill and oil-rig, detection and identification, figure 22, also points out that hybrid/compact dual-pol modes show better results. Figure 22 shows the data set used to perform the analysis in figure 23.
Figure 22 - Pauli RGB image of the NASA/JPL UAVSAR fully polarimetric data set from the Deep water Horizon oil spill in northern Gulf of Mexico,USA. Source:
32
Figure 23 - Oil-slick property/type recognition using the Dop (DB) in dual-pol SAR. (a) VH-VV. (b) HH-VV. (c) CL-pol. (d) . The region is a subset of UAVSAR data
set. Source: (Reza Shirvany, Marie Chabert and Jean-Yves Tourneret, 2012)
2.3.4 Amplitude Change Detection techniques
To successfully apply Amplitude Change Detection (ACD) techniques it is required to do a pre-processing of the input imagery to create a registered and speckle-filtered stack (Sharma, Caves, Greene, & Fernando, 2018). These techniques are best suitable to work with a stack of imagery acquired with the same viewing geometry (i.e. same look and pass direction, incidence angle, and spatial footprint) and same polarization (Sharma, Caves, Greene, & Fernando, 2018), because it’s based in amplitude differences between images to identify the possible changes that can occur. One fundamental step in these methods is reducing the speckle because it confuses visual image analysis and generates false alarms during automated change detection(Sharma, Caves, Greene, & Fernando, 2018). To solve this problem and to preserve spatial resolution over point targets and linear features, it’s used a combination of spatial and temporal filtering (Lee, 1981). Figure 24 shows the steps of the pre-processing before applying an ACD technique.
33
Figure 24 - SAR Amplitude Change Detection processing chain starting from detected input products. Souce: (Sharma, Caves, Greene, & Fernando, 2018).
Examples of these ACD techniques are Pairwise and Time-series ACD methods, that basically the first one compares a pair of co-registered SAR images to compute a changing statistic on a pixel by pixel basis and the second one uses a time series of SAR acquisitions from the same geometry for increased sensitivity to persistent changes (Sharma, Caves, Greene, & Fernando, 2018).