A Work Project, presented as part of the requirements for the Award of a Master Degree in Finance from the NOVA – School of Business and Economics.
“What are the advantages and disadvantages facing offshore floating wind energy developers and how does the future look?”
Morten Haga 2467
A Project carried out on the Master in Finance Program, under the supervision of: João Pedro Pereira
1.0 Abstract
What are the advantages and disadvantages facing offshore floating wind energy developers and how does the future look?
Offshore floating wind energy is in its infancy level of development with many improvements yet to come. Because of the early stage operation and the resulting high-expense electricity production, the attractiveness of investing in floating wind energy is low at this point in time, causing a funding problem for developers. By including government policies, learning curves and standardization into the calculations, my aim for this paper was to show the direction of the industry. Key issues are whether offshore wind will become part of the future energy mix, and if so, how long will it take to get there?
Keywords
1) State of the Industry 2) Calculation Tools
3) Assumed Cost Evolution 4) Resulting Attractiveness
2 Table of Content 1.0 Abstract 1 2.0 Introduction 3 3.0 Research Question 4 4.0 Theory 5
4.1 Levelized Cost of Energy 5
4.1.1 Life Cycle Cost Analysis 6
4.2 Cost Breakdown and Prospects 7
4.2.1 Cost Breakdown 7
4.2.2 Cost Prospects 9
4.3 Capital Intensity of Offshore Floating Wind Energy 10
4.4 Government Policies 11
4.4.1 The Price-driven Mechanisms 12
5.0 Methods 14 5.1 Sample 14 5.2 Measures Applied 14 5.3 Reliability of Measures 15 6.0 Results 16 7.0 Discussion 18
7.1 Levelized Cost of Energy and Its Implication 18
7.2 Capital Stream and Desirable Stability 19
7.2.1 Fuel Price Volatility 20
7.3 The Role of the Governments 21
8.0 Conclusion 23
2.0 Introduction
In todays market we have a great variety of energy sources. All of our sources differ in the technology applied, the natural resource that is being exploited and the level of sustainability. Combined, these different sources make what we call the energy mix. The energy mix is a hot topic nowadays due to the global warming, mainly caused by the emissions from conventional energy sources, such as crude oil, natural gas and coal. In essence, we are discussing how the world can reach its targeted low emission level through development of sustainable, zero emission energy sources.
The necessary technology is currently under development for various energy sources, with solar, wind and biomass being the leading technologies (Quelhas 2016, 26). In this paper I will focus on the offshore floating wind energy (OFWE) and use Scotland as the reference case scenario. Scotland has the potential to become a leading economy within OFWE with its well developed infrastructure, government policies and expertise from relevant industries (James and Ros 2015, 50), discussed in more detail later on.
In recent years, 33 concepts have been identified, spread across eleven countries (James and Ros 2015, 23-39), but no commercial offshore wind farm has been built to this date. There are some concepts getting closer to commercialization; an important step towards competitiveness. However, there is still a long way to go before floating offshore wind can compete on equal grounds with the conventional, less expensive energy, and reach optimization. This paper is aiming to examine the challenges and opportunities for offshore floating wind energy on its path to become an attractive part of an investment portfolio.
4
3.0 Research Question
What are the advantages and disadvantages facing offshore floating wind energy developers and how does the future look?
Hypothesis
The energy mix and the resources it will consist of is an often discussed topic with a great deal of uncertainty tied to it. Offshore floating wind energy being one of the alternatives. Today, cost of production is too high and confidence in the technology development seem to be low. My hypothesis before embarking on this research paper was that offshore floating wind energy has the potential to become a profitable, zero-emission energy source in the future. With sufficient stability of funding and government schemes in addition to synergy effects, I did believe that my analysis would support offshore wind as a future energy source for areas with suitable geographical conditions.
Disclaimer
Due to information restrictions, all statements in this paper have been based on already existing information online and in books, fairs attended and documents received from Energia de Portugal (edp 2016). Since the leading concepts are in the development phase, experiencing a highly competitive environment, I could not obtain any detailed numbers for production, cost and the prospects of such.
Author
4.0 Theory
In addition to technological challenges, the funding required to overcome these barriers is a key concern for wind developers. The upcoming sections will present the fundamental theory required to understand the investment decision making process and the factors influencing it; an important part of the financial factors affecting development of wind energy. A government will aim to improve social welfare through green energy, while a private investor will hope to get a return on the position. To map the complex funding issues, this section will include an introduction to relevant theories, external factors, valuation principles in addition to the technological challenges.
4.1 Levelized Cost of Energy
The Levelized Cost of Energy, also referred to as the LCoE, is a calculation tool for economic analysis. More specifically, it is a tool for evaluating and comparing different energy generation methods, where the final score is given as cost per output (Ebenhoch, Matha, Marathe, Munoz and Molins 2015, 109). The overall objective of the LCoE calculation tool is for companies to identify areas of improvement based on a sensitivity analysis. The improvement is done through investments in time and resources into the areas identified, aiming to reduce the costs. The LCoE calculation formula is defined as (Open Energy Information 2016):
LCoE = CAPEX x CRF x 1 − TD12
8760 MWh x Load Factor x 1 − T +
OPEX
8760 MWh x Load Factor
With the Capital Recovery Factor (CRF) being:
CRF = D 1 + D A 1 + D A− 1
6
Explanation (note that these notations may differ depending on author preferences)
:
LCoE: Levelized cost of electricity in £/MWh
D12: Weighted average cost of capital (WACC) in % T: United Kingdom Tax Rate 2015
CAPEX: Capital expenditure in £ N: Operational lifetime in years OPEX: Annual operating costs in year t
Load Factor: Period operating capacity as a percentage
When such an equation is applied using publicly available information, one can run a comparison between different offshore floating wind projects, or an offshore project relative to another energy source, for example solar energy. To illustrate the practical usage, the LCoE will be higher for OFWE when distance from shore or water depth increases. The higher cost will incur because the wind farm will require more advanced mooring systems and longer export cables, leading to a higher CAPEX (Myhr, Bjerkseter, Ågotnes and Nygaard 2014, 714). Before applying the LCoE, a life cycle cost analysis is conducted, hence I will present the LCoE more in-depth after section 4.1.1.
4.1.1 Life Cycle Cost Analysis
We have now looked briefly at what the LCoE calculation tool is and how it can be used. Now, we will look at the practical aspects of how it is applied. To initiate electricity generation from offshore floating wind farms, a significant paid up-front investment is required. More on capital intensity in Section 4.3. A typical wind project is a long-term project. The turbines and platforms have an expected life time of 20-25 years, but the site will already be grid connected and ready for new instalments when the first components reach their maturity. Because of the long-term investment horizon, it is of great interest to examine the expenses in different phases
of the project (Ebenhoch, Matha, Marathe, Munoz and Molins 2015, 109), simply to get an idea of the expected cash outflows.
To meet the desire to break down costs depending on development stage, a Life Cycle Cost Analysis (LCCA) is performed (Ebenhoch, Matha, Marathe, Munoz and Molins 2015, 109). It is more common to perform the LCCA when considering capital intensive projects, with income generation over a longer period of time, such as the offshore floating wind. The final findings of the LCCA are costs per MWh, or costs per unit of electricity, also known as LCoE as presented above. The LCCA applies a discount rate to obtain all phase-specific expenses into one common point in time.
Depending on the phase of which the concept is in, cost vary greatly, both in terms of amount and timing. Therefore, we have to discount these costs so that they are all in the same time frame (Myhr, Bjerkseter, Ågotnes and Nygaard 2014, 724). Only then can we use the information obtained to identify areas to improve or make a comparison between projects through the LCoE approach.
4.2 Cost Breakdown and Prospects
4.2.1 Cost Breakdown
The cost of offshore floating wind energy can be divided into capital expenditure (CAPEX), operational expenditure (OPEX) and decommissioning expenditure (DECEX). The deployed floating prototypes have a CAPEX equal to £5.2m/MW, estimated to decrease to £2.7m/MW once the project has been commercialized (James and Ros 2015, 126).
If we break the CAPEX down into more detail, we get each process’ percentage share of the total amount. The highest CAPEX item is the turbine, followed by platform, balance of system, installation, mooring, decommissioning and anchors, respectively (James and Ros 2015, 126).
8
The high-expense CAPEX posts requires significant R&D in the initial phases. After reaching commercialization, R&D initiatives will be reduced. What we can take from this, is that the CAPEX may experience a significant decrease once the technology and process has been validated and standardized.
The severe cost reduction is expected because before producing and installing a wind turbine today, there is an extensive work taking place in research and testing to optimize the choices made for the specific site. Examples of choices might be weight, shape and material of the anchor or platform, and platform design to ensure that there are available docks for repairs. Testing and planning every component of the structure is both costly and time consuming. Cost estimates based on the three main typologies, spar-buoy, semi-submersible and tension leg platform show that the reduction potential is greatest for the platform (16%) followed by the turbine (12%) (James and Ros 2015, 127).
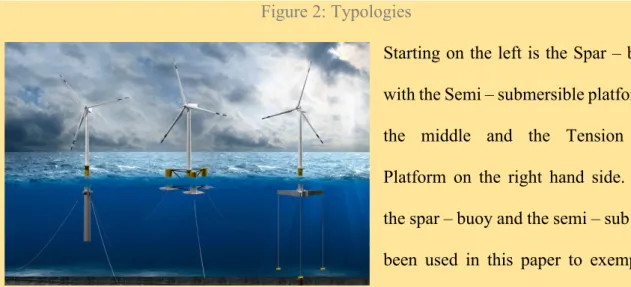
Figure 2: Typologies
Starting on the left is the Spar – buoy, with the Semi – submersible platform in the middle and the Tension Leg Platform on the right hand side. Both the spar – buoy and the semi – sub have been used in this paper to exemplify, with the Hywind and the WindFloat projects, respectively (James and Ros 2015, 18).
Operational expenditures, as with capital expenditures, carries the potential for severe cost reductions as the processes can be standardized. The OPEX is stated as £/MW/year, and it is assumed that once standardized, companies may half the OPEX associated with the prototypes (James and Ros 2015, 129).
4.2.2 Cost Prospects
The current stage of offshore floating wind energy is reflected by high values for LCoE. The LCoE levels observed today is based on the deployed prototypes and pre-commercial trials and hence not an exact measure of the final cost per megawatt hour (James and Ros 2015, 43). It is reasonable to believe that once relevant production -, installation - and maintenance processes are optimized we will experience a far lower LCoE for OFWE.
Thinking back to the introduction where it was stated that offshore floating wind energy is at its early stage of development, we have to bear in mind that the cost estimates will carry some uncertainty. For well developed industries such as the oil and gas industry, a newly discovered oil reservoir will, to some extent, enjoy predictable cost estimates based on experience from previous projects. This is not the case for companies in the early-stage of floating wind industry who are lacking knowledge about the processes and the unexpected expenditures. And so, we rely on cost evolution estimates stated by the operators for the different typologies, mapped by Carbon Trust (James and Ros 2015, 134).
As argued, the current LCoE for offshore wind is too high for it to be regarded as a competitive source in the energy mix. The prototypes have proven to be above cost parity, meaning that the companies working to promote offshore wind energy will need to achieve lower costs, quickly. It has been claimed that the LCoE will have to go as low as £85/MWh, or 8.5 cents/kWh (Energy Technologies Institute 2013). Carbon Trust (2015) emphasizes six main tools for cost reduction:
- Design standardization
- Technology improvements & design optimization - Learning effects
10 - Supply chain improvements
- Increasing yield
4.3 Capital Intensity of Offshore Floating Wind Energy
The investor desirability is key for the industry to obtain financing and fund its own development. Cash flow is one of the main aspects determining the suitability of OFWE in a portfolio. I will now present the cash flow stemming from OFWE. Let us first look at the basic concept of capital intensity, how offshore floating wind energy is characterized and the practical implications of it.
When a company, let us say Statoil with its Hywind project, requires a large amount of financing relative to its labor costs, it is capital intensive (Investopedia 2016). It is said to have a high capital-labor ratio. When an industry is labeled capital intensive, it typically consists of a small number of players due to the high entry barriers (Krohn, Morthorst and Awerbuch 2009, 113) caused by the up-front capital need. The offshore wind industry has high funding requirements compared to its expenditures from labor costs. This can both be explained by the expensive components used to produce a wind turbine and the extensive R&D initiatives required to reach commercialization.
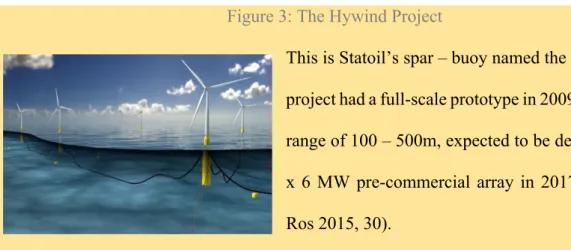
Figure 3: The Hywind Project
This is Statoil’s spar – buoy named the Hywind. The project had a full-scale prototype in 2009 with a depth range of 100 – 500m, expected to be deployed in a 5 x 6 MW pre-commercial array in 2017 (James and Ros 2015, 30).
For the investor considering a position in offshore wind, this means a great amount of capital tied up for a longer period of time (Krohn, Morthorst and Awerbuch 2009, 113). He or she will
experience high fixed cost relative to the variable cost. The variable cost of wind energy, as explained in the cost breakdown section, primarily consists of repairs and salaries, as fuel consumption is close to zero.
Research show that the teams responsible for designing the wind turbines tend to underestimate the cost associated with developing a technology. Especially in the early stage process, there is a clear tendency that actual cost exceeds expected cost (James and Ros 2015, 140).
The increasing need for funding on its way towards commercialization brings us to the next section; public funding through government policies and the need for well developed plans and their long term commitment. It is important to bear in mind that we are focusing on Scotland and that there are major differences in how countries work to stimulate renewable energy development.
4.4 Government Policies
In the cost breakdown section, we talked briefly about the competitiveness of offshore floating wind compared to other renewable energy sources. Because of its early stage progress, OFWE is still expensive per unit of energy produced. As a result, projects such as the WindFloat (Figure 4) is currently unable to compete with conventional energy sources in the open electricity market (James and Ros 2015, 50). To overcome this entry barrier, some countries have established government schemes to improve the competitiveness of zero emission energy sources. Scotland, as a leading country in offshore wind energy, offers strong market conditions for companies operating in the industry.
12
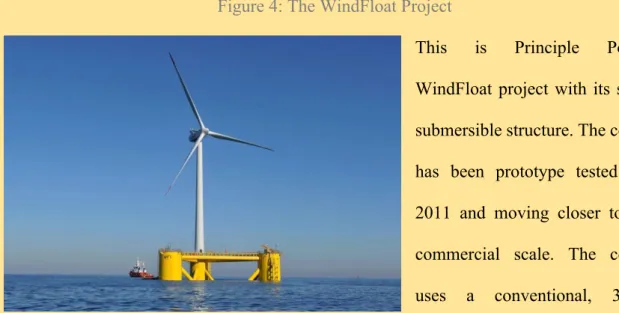
Figure 4: The WindFloat Project
This is Principle Power’s WindFloat project with its semi – submersible structure. The concept has been prototype tested since 2011 and moving closer towards commercial scale. The concept uses a conventional, 3-blade upwind, turbine and achieved 96% availability in 2014/2015. Expected to be deployed in a pre-commercial array in 2018 (WindFloat 2016).
There are various schemes present in todays market, differing in the way they stimulate to a level playing field between conventional and renewable energy sources. Today we can find pollution cost -, tax credit - or deduction schemes (Department of Energy 2016), and price or quantity regulations (Krohn, Morthorst and Awerbuch 2009, 77), to mention some. The schemes differ in how they work to shift the energy mix from sources with COC emissions as the key negative product and over to green energy. The pollution cost scheme is causing extra cost for the companies responsible for COC emissions, while the other schemes mentioned are more aimed towards the renewable energy companies and their investors directly. We will now look at the price-driven mechanism offered to the operators in Scotland.
4.4.1 The Price-driven Mechanisms
The price-driven mechanisms can vary greatly depending on which project phase the government aim to support, whether it is investment-focused or generation-based (Krohn, Morthorst and Awerbuch 2009, 77). In essence, however, it can be understood as a premium where a government offers a financial support per unit of energy. The scheme also varies in
terms of calculation method, where the achieved units of energy can be measured as installed capacity, produced energy or sold energy in the market place (Krohn, Morthorst and Awerbuch 2009, 77).
In Scotland, the scheme in place for offshore floating wind energy is defined as a generation-based strategy. The government will pay a zero-emission energy producer a fixed premium for every MWh installed. The premium helps companies enter the highly competitive marketplace quickly (Krohn, Morthorst and Awerbuch 2009, 78).
Scotland implemented the generation-based approach with a record-high 3.5 Renewable Obligation Certificates (ROCs) per MWh (James and Ros 2015, 50). In comparison, fixed-bottom offshore wind receives 2 ROCs per installed MWh. One ROC is not a fixed sum, but rather an outcome of an auction. Normally, companies can expect one ROC value to be somewhere between £40 and £50, resulting in a total received electricity price between £140 and £175 per MWh in addition to the market price of 1 MWh (James and Ros 2015, 50).
14
5.0 Methods
5.1 Sample
The methodology applied in this paper is characterized by information availability, with companies working to protect its competitive advantage. For that reason, the results here are based on publicly available data with assumptions applied to conduct the analysis. The Market and Technology Review from 2015 made calculations based on numbers from several concepts. They are then grouped depending on typology. Advantages and disadvantages with OFWE are explained and exemplified using qualitative measures, supported by quantitative procedures. Having studied existing literature, before initiating the writing process, I conducted several LCoE calculations and sensitivity analysis’ explained below, in order to gain an understanding on how the industry may evolve in the future.
5.2 Measures Applied
The calculations are based, both on thorough estimations carried out by the Carbon Trust (James and Ros 2015, 123-132) and my own assumptions for the future development. In 2015, a CAPEX breakdown indicated investments equal to £5.2m for every MW installed, with belonging £0.2m OPEX for every year operating the 1 MW. Once the wind farm has been commercialized, the Carbon Trust CAPEX and OPEX estimates are expected to be halved.
By extrapolating todays trend for offshore load factors in addition to estimated load factors on floating concepts, we can expect a 40% capacity factor for commercial stage concepts (Shukla, Reynolds and Jones 2014). I believe that the load factor estimate is rather conservative as the trend represents fixed bottom concepts and average floating wind concepts. Despite expectations of further development in technical ability to exploit wind, I have assumed a 40% load factor for all stages in order to underestimate, rather than overestimate production potential. Doing so, production equals 3 504 MWh per 1 MW at all three stages.
In the literature, turbine lifetime is given in the range from 20 to 25 years. I decided to use the lower range of the scale. This turbine lifetime has been applied to all project phases. In research papers, they estimate the costs of increasing turbine lifetime to be higher than the replacement costs, taking away the incentive to develop longer lifetime turbines.
Regarding the macroeconomic factors, we have various important aspects to consider. The first is the Renewable Obligation Certificate to expect in the years to come and the other being cost of capital. ROC, as explained in the theory, depend on an auction. I have assumed that the total subsidy in Scotland is £140 for all time periods, with one ROC valued at £40. I chose to keep the scheme stabile over the entire time period because such schemes tend to remain unchanged in order to secure predictability for the operators.
Furthermore, I have considered a 10% cost of capital because of uncertain concept outcome and resulting risk. Despite lower risk once a concept has been field proven, I have assumed the same cost of capital to maintain a buffer in case of changes in the subsidy scheme. The UK company tax rate is 20% (KPMG 2016) and the UK average whole sale price for 2015 was 41£ per MWh.
5.3 Reliability of Measures
When discussing the reliability of measures presented above, we have to stress the uncertainty elements. Costs related to investment, operation and maintenance can be reasonable accurate for the initial deployment phase, but will carry uncertainty when we move forward by 5-10 years. The same also applies for production levels, which depend both on met-ocean conditions and technology development.
16
6.0 Results
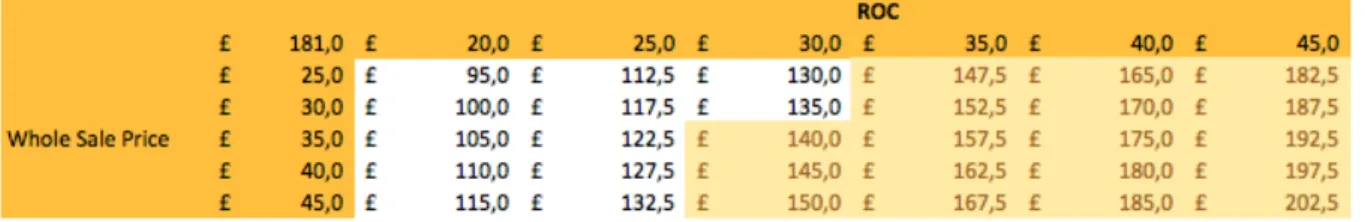
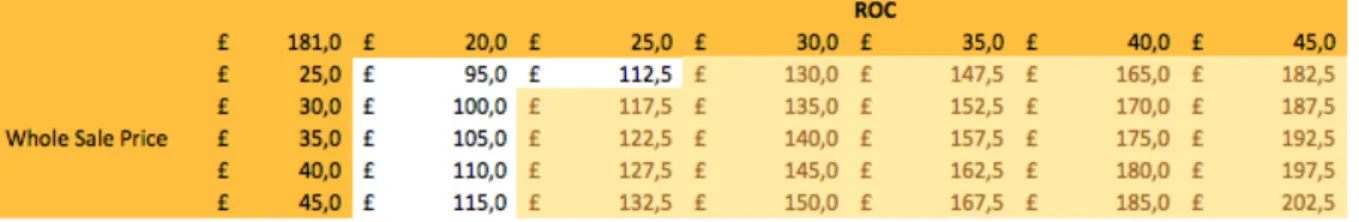
Using our assumptions, we get the estimates given below for the LCoEs and revenue sources. With the same set of assumptions, we also get the predicted influence from changing ROC values and whole sale prices. Table 2, 4 and 6 illustrate the sensitivity towards changes in the whole sale price and the value of one ROC; with profitable LCoE values marked light yellow.
Initial Deployment of Commercial Scale
With the industry-average cost and production estimates, OFWE is able to compete with
Table 1: Income and LCoE compared – Initial Commercial Scale
alternative energy sources as the LCoE is lower than the subsidy and whole sale price combined.
In Table 1 we see that the leading technologies will achieve a LCoE equal to 136.56 £/MWh, way below the 181 £/MWh generated from the subsidy scheme and the whole sale price. In Table 2, I have presented the result from a sensitivity analysis, showing how profitability is affected by changes in ROC auction and whole sale price. For an auction price at 30 £/MWh, the electricity price must exceed 35 £/MWh for it to be profitable.
Table 2: Sensitivity Towards Changes in Price and ROC – Initial Commercial Scale
5 Years After Initial Deployment
5 years after initial deployment of commercial scale concepts the results changes. Mainly due to standardized operations and concept features, the projects enjoy lower expenditures for both
Table 3: Income and LCoE compared – After 5 Years
OPEX and CAPEX. The new costs are 81.000 £/MW/yr and 2.400.000 £/MW, respectively.
With the LCoE becoming 121.67 £/MWh and (Table 3), I expect to see the leading OFWE concepts improving its competitiveness even more. As observed in Table 4, such projects can compete with an auction price of 25 £/MWh and a 35 £/MWh whole sale price.
Table 4: Sensitivity Towards Changes in Price and ROC – After 5 Years
10 Years After Initial Deployment
Finally, moving another 5 years out, according to my expectations, LCoE and sensitivity
Table 5: Income and LCoE compared – After 10 Years
estimates will continue its improvements. CAPEX and OPEX are both expected to decrease, but in a more moderate pace when compared to the first interval. With OPEX and CAPEX equal to 72 900 £/MW/yr and 2 300 000 £/MW, we get the outputs as provided in Table 5.
With the Levelized Cost of Energy being 115.25 £/MWh; well performing concepts will be profitable with a ROC value at 25 £/MWh and electricity prices at 30 £/MWh. With the growing buffer zone between probable revenue and cost, OFWE is becoming more and more profitable.
18
7.0 Discussion
7.1 Levelized Cost of Energy and Its Implication
To see when a concept becomes competitive, a good way is to compare its LCoE with the total source of revenue. It is also interesting to see how the profitability is dependent on ROC stability and the electricity prices. It will have to be profitable in order to be regarded as a desirable investment. Attractiveness will improve even more if the profitability and the prospect of such is higher for OFWE than for its alternative energy sources. For this to be the case going forward, projects are greatly depending on the government subsidies.
From the tables provided in the result section, we clearly see that the subsidies are the greatest advantage for green energy producers. The subsidy scheme enables them to compete in the market and exploit the energy in wind, despite the expensive technology required. My calculations indicate that commercial scale concepts will be able to compete in the market, and that further developments will result in continued competitiveness in the future. The result of a more transparent cash out – and inflow analysis might favor OFWE because of the so far hidden financial advantages of this energy source.
Furthermore, and relating to the breakeven price, offshore floating wind energy is expected to go through a technological evolution. To successfully reflect the costs of OFWE using the LCoE tool, we should apply a dynamic approach in which we consider the rapidly developing industry. If the developers manage to work well in relation to the six tools mentioned earlier, the projects might be developing even faster than expected, strengthening the argument for such an approach. And so, chances are good that the LCoE will decrease rapidly, perhaps in the short-run already, making OFWE more attractive.
By strictly looking at the costs of producing one unit of energy using the LCoE calculation method, we may end up with a value that is too high for it to be competitive when in reality it is able to compete with its alternative sources. Bear in mind that the calculations given in the Results section are based on conservative inputs. It is possible that CAPEX and OPEX figures will decrease even more than assumed in this paper. In addition, turbine lifetime and load factor may be underestimated here to prevent an overestimation of profitability.
7.2 Capital Stream and Desirable Stability
As discussed, OFWE is a capital intensive industry. In addition, a great deal of the necessary capital is required up-front with income generation expected to be later on. Maintenance is somewhat expensive because the installations are far from shore, but designers believe to have developed estimates of the expected repairs and the cost related to it based on experience from related industries. The oil & gas industry is a good example of related sources of costs with various existing floating platforms, mooring, cables and more. The result is a fairly predictable capital stream with high fixed costs and offsetting low variable costs, due to the independency of fuel prices (Krohn, Morthorst and Awerbuch 2009, 28).
Significant up-front cost and low per-period income compared to alternative investment opportunities might end up causing some investors not to invest in offshore floating wind. He or she will have to tie up resources for a long investment horizon with low per-period returns in addition to the risk of failure. Most investors are reluctant to enter such a position, and instead pick a safer investment. These are the cons of offshore wind energy in light of capital stream, now let us look at the pros.
Once the initial up-front investment has been made, the offshore technologies requires a low financial commitment during the project life time. In return of the investment comes revenue
20
but the horizon may be longer. Thus, it could potentially take a long time to reach the break-even point with the offsetting upside that the cash flow necessary to do so is expected to be highly predictable and stable. The predictability is lowering the overall risk and improving the desirability of OFWE. I will now discuss some reasoning for the stable income generation.
With the prospects of profitability as shown in the results section, a long repayment period and predictable cash flows, offshore floating wind energy appear to be a good investment opportunity. However, being a new technology with an uncertain outcome, it may be more relevant for governments rather than private investors today. If the LCoE calculation in this paper turns out to be fairly accurate, both private and public investors may favor a position in OFWE, but it is a high risk investment.
7.2.1 Fuel Price Volatility
For the government acting as an investor aiming to support sustainable, hopefully soon-to-become profitable technologies, fuel price volatility is another argument in favor of floating offshore wind. The reason being that a large position in, let us say an oil producer, will expose him to volatile fuel prices (Krohn, Morthorst and Awerbuch 2009, 113). Today, the majority of Europe’s energy production stems from high risk, low capital intensive energy sources (Krohn, Morthorst and Awerbuch 2009, 113).
By being heavily dependent on fuel prices, an economy such as Scotland will face the risk of severe losses if they experience unusual low oil prices, as was the case in January 2016 with crude oil prices down to $27.88 per barrel (Bloomberg 2016). One way to reduce the risk of such dependency is increasing the share of renewable sources in the energy mix. For companies, for example operating in the oil and gas industry, the arguments are quite similar, where a focus towards renewable energy sources will make sure that parts of the business will maintain its performance despite macroeconomic disadvantages for the fuel dependent areas. Being a
private investor with positions in these companies, one can of course also see the positive effects of such weighting for him or her.
“Commercial companies pursue benefit maximization or cost minimization without taking into account the global risk of the economy in which they operate” (Krohn, Morthorst and Awerbuch 2009, 114). Two researchers once examined the potential risk reduction potential through using renewable energy generation. They referred to it as the portfolio-effect, with the low fuel-dependent energy sources decreasing the production risk (Krohn, Morthorst and Awerbuch 2009, 114).
7.3 The Role of the Governments
OFWE developers will have to both innovate and standardize their concepts in order for them to reach cost competitiveness (Dickson 2016). This is a challenging and expensive phase of the process. Therefore, it is necessary to have stimulating public policies in place. In todays marketplace we see a trend that companies expand its business to countries with a safe and sound renewable scheme. One example being the Norwegian oil company Statoil, with its Hywind concept under construction in Scottish waters. In addition to favorable conditions for the spar-buoy concept (Figure 5), Scotland offers a world-leading scheme for offshore floating wind producers (Dickson 2016).
For companies like Statoil, it is key for the continued development that the government policies are long-term oriented and predictable. The company will establish budget estimates using experience from a related industry, own cost patterns, technology projectors, and of course, the expected income including the Renewable Obligation Certificates. If the ROCs, as an important part of budgeting, should change dramatically for the worse or even seize to exist, it will cause difficulties for the operator. As an example, we can discuss how the UK leaving the European
22
Union will affect long-term commercial contracts. Instability like this can become a source of risk for the developers if the schemes currently in place change dramatically as described above.
Again looking at the calculation, I will stress the importance of subsidy stability. A change in ROC will create great challenges for the operators, one example being a reduction in the auction price. Let us assume that the auction price halves from £40 to £20 per MWh, then the LCoE for my base case concept will fail to be competitive. Such a change may threaten the ability to continue operation and prevent further improvements.
On the other hand, we might say that the policies should be more dynamic to become more suitable for the dynamic industry as opposed to “one solution suits all”. As a concept is pushed through the different phases, the capital need changes and also its ability to obtain the funding from the schemes in place. A solution, possibly benefitting the offshore floating wind energy producers, would be adapting the scheme for each phase to grant a better operating environment for the companies. This will perhaps meet some resistance by the competing energy producers not entitled to the support. Having said that, a dynamic approach with adapting support still needs to be predictable. Changing, but predictable.
The proposed solution presented to OFWE developers would stress the importance of geographical location. Location is a key element for most industries, but perhaps more important for the companies developing the floating wind concepts. The government subsidy scheme is the biggest factor in play when deciding where to establish business, given its importance for the profitability. The company should probably give priority to locations offering strong subsidies. In addition, weather, seabed and ocean conditions all play an important role in determining the success of a particular project. Finally, the potential synergies with related industries is key in order to achieve the cost estimates calculated in this paper. Countries with a well developed oil & gas industry may be favourable to create learning effects.
8.0 Conclusion
The role of offshore floating wind in the future energy mix remains uncertain. As of today, the levels of cost per unit of electricity is too high if we exclude the government schemes. The industry is facing its biggest challenge, now bringing their concepts from pilot projects to commercial wind farms. There are a great amount of existing cost and revenue estimates, all carrying uncertainty for how the commercial scale concepts will perform once deployed and in the future. If the operators succeed in creating synergies with the oil & gas industry and manages to push the learning curve quickly, current analysis may be overestimating the cost of offshore floating wind.
Stability in the renewable schemes and the company focus on green energy is key for the further concept development. If both stability and continuous learning are in place, chances are good that the offshore floating wind can become a price competitor even with a level playing field. Signals from the speakers representing companies operating in the offshore floating wind industry at the ONS fair in Stavanger, Norway, indicated a strong belief that OFWE will become increasingly attractive in the years to come (Dickson 2016).
If the offshore wind operators reach their goals for cost reduction and thus profitability, I believe that an investor, both public and private, can profit on a position in the industry. The private investor can profit in terms of returns on investment and the public can achieve improved social welfare and diversification from becoming less exposed to volatile fuel prices. Initial commercial phase will be critical as concepts are to be field proven in terms of technology and economics. If cost estimates turn out to be wrong and profitability is negatively affected, then funding may become an issue for the operators.
24
9.0 Literature
Bloomberg Markets. 2016. “Generic 1st ‘CO’ Future. CO1:COM.” Accessed August 27. http://www.bloomberg.com/quote/CO1:COM
Dickson, Giles. 2016.. “Opportunities in Offshore Wind Energy”. Intpow. Offshore Northern Seas (ONS) fair
DNV GL. 2016. “Wind Typologies”. Accessed September 4.
https://www.dnvgl.com/technology-innovation/broader-view/electrifying-the-future/third-generation-wind-power.html
Ebenhoch, Raphael, D. Matha, S. Marathe, P. C. Munuz and C. Molins. 2015. “Comparative Levelized Cost of Energy Analysis.”
Energy Technologies Institute. 2013. “Technology and Innovation Challenges for UK Offshore Wind.”
KPMG. “Corporate Tax Rates Table”. Accessed August 22.
https://home.kpmg.com/xx/en/home/services/tax/tax-tools-and-resources/tax-rates-online/corporate-tax-rates-table.html
Krohn, Søren, Poul-Erik Morthorst, Shimon Awerbuch. 2009. “The Economics of Wind Energy – A Report by the European Wind Energy Association.” European Wind Energy Association.
Manuel, Luis. WindFloat Atlantic. 2016. “A step change in turning floating wind commercial”. Energia de Portugal.
Myhr, Anders, C. Bjerkseter, A. Ågotnes, T. A. Nygaard. 2014. “Levelized Cost of Energy for offshore floating wind turbines in a life cycle perspective.”
Offshore Northern Seas. 2016. “Offshore Wind Power. The state of the industry.” Open Energy Information (OEI). 2016. “Levelized Cost Calculations.” Accessed December 4. http://en.openei.org/apps/TCDB/levelized_cost_calculations.html
Quelhas, Ana. 2016. “Introduction to the Energy Sector.”. EDP. Energy Planning Department: 26.
Rhodri, James, Costa Ros. 2015. Floating Offshore Wind: “Market and Technology Review”. Carbon Trust.
Shukla, Shruti, P. Reynolds and F. Jones. 2014. “Offshore Wind Policy and Market Assessment – A Global Outlook”. FOWIND.
Statoil. 2016. “Hywind Scotland Pilot Park.” Accessed July 16.
http://www.statoil.com/en/TechnologyInnovation/NewEnergy/RenewablePowerProduction/O ffshore/HywindScotland/Pages/default.aspx
U.S. Department of Energy. 2015. “Renewable Electricity Production Tax Credit (PTC).” Accessed August 24. http://energy.gov/savings/renewable-electricity-production-tax-credit-ptc