Frequency and functional activity of Th17, Tc17 and other T-cell subsets in
Systemic Lupus Erythematosus
Ana Henriques
a,1, Luís Inês
b,1, Maura Couto
b, Susana Pedreiro
a, Catarina Santos
c, Mariana Magalhães
d,
Paulo Santos
a, Isabel Velada
a, Anabela Almeida
a, Tiago Carvalheiro
a, Paula Laranjeira
a,
José Mário Morgado
a, Maria Luísa Pais
a, José António Pereira da Silva
b, Artur Paiva
a,* aCentro de Histocompatibilidade do Centro, Portugal
b
Serviço de Reumatologia dos Hospitais Universitários de Coimbra, Portugal
c
Escola Superior de Saúde Jean Piaget/Nordeste, Portugal
d
Escola Superior de Tecnologia da Saúde de Coimbra, Portugal
a r t i c l e
i n f o
Article history:
Received 20 January 2010 Accepted 7 May 2010 Available online 11 May 2010
Keywords: Th17 Tc17 Th1 Tc1 Regulatory T cells Autoimmune disease SLE
a b s t r a c t
To compare frequency and functional activity of peripheral blood (PB) Th(c)17, Th(c)1 and Treg cells and the amount of type 2 cytokines mRNA we recruited SLE patients in active (n = 15) and inactive disease (n = 19) and healthy age- and gender-matched controls (n = 15). The study of Th(c)17, Th(c)1 and Treg cells was done by flow cytometry and cytokine mRNA by real-time PCR. Compared to NC, SLE patients present an increased proportion of Th(c)17 cells, but with lower amounts of IL-17 per cell and also a decreased frequency of Treg, but with increased production of TGF-b and FoxP3 mRNA. In active com-pared to inactive SLE, there is a marked decreased in frequency of Th(c)1 cells, an increased production of type 2 cytokines mRNA and a distinct functional profile of Th(c)17 cells. Our findings suggest a func-tional disequilibrium of T-cell subsets in SLE which may contribute to the inflammatory process and dis-ease pathogenesis.
Ó 2010 Elsevier Inc. All rights reserved.
1. Introduction
Until very recently, the dominant paradigm for understanding the pathogenesis of autoimmune diseases, including Systemic Lu-pus Erythematosus (SLE) stated that Th1 and Th2 cells orchestrate autoimmune responses[1]. Some studies suggested that Th2 cells (producers of IL-4 and IL-10) were the key mediators[2–4]while others emphasized the role of Th1 cells (producers of IFN-
c
, IL-2, TNF-a
) in SLE[5]. The discovery of a new subset of CD4+T cells,named Th17 after their signature cytokine, IL-17 is originating a major revision in this paradigm. Many recent studies suggest that Th17 cells are the primary drivers of inflammatory responses in a variety of autoimmune diseases, including Crohn’s disease, rheu-matoid arthritis and multiple sclerosis[6,7]. The role of IL-17 pro-ducing cells in SLE pathogenesis is far less clear[8]. Some studies in mouse models and in human lupus provide evidence for a role of IL-17[9–11], while others argue against this[12,13]. Studies on
the influence of IL-17 in SLE disease activity are scarce and results are contradictory[8]. In the CD8+T cell compartment, Tc1 and Tc2
subsets exist, characterized by the same hallmark cytokines as Th1 and Th2, respectively. Recently, a subpopulation of CD8+T cells
producing IL-17 (Tc17) was also discovered[14–16], but its role in SLE has not been examined. It has been suggested that regula-tory T (Treg) cells (TGF-b producers another T-cell subset with an important role in suppressing autoimmunity may be defective in SLE[17,18]. A reciprocal relationship exists between these differ-ent T-cell subsets. Developmdiffer-ent of Th1 and Th2 subsets is mutually antagonistic and both cell types suppress Th17[19,20]. Treg cells suppress other effector T cells but, surprisingly, Treg-derived TGF-b enhances Th17 differentiation[21,22].
Because SLE immune response is highly heterogeneous and in view of the reciprocal interrelationships of the T cell subpopula-tions, the role of Th(c)17 cells in SLE might be better elucidated with integrated evaluation of their cytokine production.
The aim of this study was to evaluate and compare the fre-quency and functional activity of Th17 cells and other peripheral blood T-cell subsets, namely Th(c)1, Tc17 and Treg cells, and the production of type 2 cytokines mRNA in active and inactive SLE and in healthy control subjects.
0008-8749/$ - see front matter Ó 2010 Elsevier Inc. All rights reserved. doi:10.1016/j.cellimm.2010.05.004
* Corresponding author. Address: Centro de Histocompatibilidade do Centro, Edifício São Jerónimo, 4° Piso, Praceta Mota Pinto, 3001-301 Coimbra, Portugal. Fax: +351 239480790.
E-mail address:[email protected](A. Paiva).
1 These authors contributed equally to this work.
Contents lists available atScienceDirect
Cellular Immunology
2. Materials and methods 2.1. Patients
We recruited patients with SLE fulfilling the 1997 ACR classifi-cation criteria for the disease[23,24]. Disease activity at the time of evaluation was scored according to the Systemic Lupus Erythe-matosus Disease Activity Index (SLEDAI, 2000) [25,26]. Patients were divided into two groups, according to their SLEDAI score (ac-tive disease = SLEDAI P 5)[27]. Medication at time of evaluation was recorded.
2.2. Controls
As controls, we recruited healthy age- and gender-matched bone marrow donors at the Histocompatibility Center of Coimbra. Pregnancy and age under 18 were exclusion criteria for participa-tion. The study protocol was approved by the local ethics commit-tee. All participants gave and signed informed consent.
2.3. Blood samples
One 20 mL PB sample was collected from each participant on the day of inclusion and clinical evaluation. Samples were sent to the laboratory identified with a code number and analysis was per-formed without knowledge of the participant disease status. 2.4. Immunofluorescence staining of peripheral Th(c)1 and Th(c)17 subsets after in vitro stimulation with PMA/ionomycin, in the presence of Brefeldin A
500 microliters of each PB sample were diluted L/L (vol/vol), in RPMI-1640 medium (Gibco; Painactive SLEy, Scotland, UK), supple-mented with 2 mM L-glutamine. About 50 ng/mL of phorbol 12-myristate 13-acetate (PMA; Sigma, Saint Louis, MO, USA), 1
l
g/mL of ionomycin (Boehringer Mannheim, Germany) and 10l
g/mL of Brefeldin A (Golgi plug-Sigma, Saint Louis, MO, USA) were added and the sample was incubated for 4 h at 37 °C in a humidified incubator with 5% CO2concentration.Each cultured PB sample was aliquoted and stained in three dif-ferent tubes (200 mL/tube) following an intracytoplasmatic per-meabilization and staining protocol in order to analyse separately the intracellular expression of IL-2, TNF-
a
and IFN-c
in IL-17-positive and IL-17-negative T cell subpopulations, within CD4 T cell and CD8 T-cell subsets. All cell aliquots were stained with IL-17 PE (clone 41802; R&D Systems, Europe) and separately with IL-2 (clone MQ1-17H12; BD Pharmingen, San Diego, CA, USA), TNF-a
(clone MAb11; BD Pharmingen, San Diego, CA, USA) and IFN-c
(clone 4S.B3; BD Pharmingen, San Diego, CA, USA) according to the manufacturer’s instructions for fixation and permeabiliza-tion. These mAb were added to each tube after staining cells for surface expression of mAb directed against T lymphocytes subsets – anti-CD3-PerCP (clone SK7; BD, San Jose, CA, USA) and anti-CD8 APC (clone SK1; BD, San Jose, CA, USA). Among positive CD3 cells, CD4 positive T cells were identified after exclusion ofc
d-T-cell sub-set according to their higher reactivity with anti-CD3 monoclonal antibody and typical light scatter.2.5. Immunofluorescent staining of peripheral regulatory T cells (Treg) In aliquots corresponding to Treg evaluation, anti-CD25-FITC (clone M-A251; Pharmingen BD, San Diego, CA, USA), anti-CD127 PE (clone hIL-7R-M21; BD, San Jose, CA, USA), and anti-CD4 PerCP-cy5.5 (clone SK3; BD, San Jose, CA, USA), were added and the samples were incubated for 15 min at room temperature in
darkness. After this incubation period, 2 mL of FACS Lysing Solu-tion (BDB, San Jose, CA) diluted 1:10 (vol/vol) in distilled water was added and after 10 min of incubation the cells were washed with 2 mL of PBS and resuspended in 0.5 mL of PBS before analysis in flow cytometry.
2.6. Flow cytometric analysis
Single-cell suspensions were prepared and stained for 15 min at room temperature in darkness with optimal dilutions of each mAb. Results illustrate the percentage of positive cells within each cell subset or/and their mean fluorescence intensity (MFI). T lympho-cytes were identified according to their positivity for CD3 and typ-ical light scatter. The cytokine production was evaluated within the different T-cell subsets on an electronic CD3+gating, after a first
acquisition of 20,000 of total events. The identification and quanti-fication of Treg were done based on the following phenotype: CD4+, CD25brightand CD127 /lowexpression. Finally, expression of
cell surface markers and production of cytokines were assessed using the flow cytometer (FACSCalibur; BD, San Jose, CA, USA), and data were analysed using Infinicyt software (Cytognos, Spain). 2.7. Treg cell sorting
As other researchers, we used the expression of CD127 as a via-ble surface biomarker to differentiate effector (CD127+) cells from
Treg (CD127 /low) cells in humans[12]. Thus, CD25bright/CD127 low
CD4 T cells, defined as Treg cells in our experiments, were purified using a FACSAria cell sorter (BD, San Jose, CA, USA). The purity of the isolated cell populations was evaluated and it was consistently greater than 90%.
2.8. Gene expression analysis
Study of mRNA expression of IL-4 and IL-10 from whole blood was performed in blood collected collection in PAXgene Blood RNA Tube (PreAnalytiX GmbH, Switzerland) with automated RNA purification in QIAcube (Qiagen, Hilden, Germany). Total RNA iso-lation from sorted Treg cells was performed using RNeasy Micro Kit (Qiagen, Hilden, Germany).
RNA integrity and quantification were analyzed using 6000 Nano ChipÒ Kit, in Agilent 2100 bioanalyzer (Agilent, Walbronn,
Germany). One microgram of RNA was reverse transcribed with SuperScript™ III First-Strand Synthesis System for RT-PCR (Invitro-gen, CA, USA) using oligo(dT) plus random hexamers according to manufacturer’s instructions.
Relative quantification of gene expression by real-time PCR was performed using thermocycler LightCycler 480 II (Roche, Basel, Switzerland). Normalization for gene expression quantification was performed with geNorm Housekeeping Gene Selection Human Kit (Primer Design, Southampton, UK) and geNorm software (Ghent University Hospital, Center for Medical Genetics, Ghent, Belgium) to select optimal housekeeping genes to this study[28]. Real-time PCR reactions used specific QuantiTect Primer Assays (Qiagen, Hilden, Germany) with optimized primers for IL-4 (QT00012565), IL-10 (QT00041685), FOXP3 (QT00048286), TGFB1 (QT00000728) and endogenous controls ATP5B (QT00055622), B2M (QT00088935), RRN18S (QT00199367) and SDHA (QT01668919) to-gether with QuantiTect SYBR Green PCR Kit Gene expression (Qiagen, Hilden, Germany) according to manufacturer’s instructions. Reac-tions were performed with the following thermal profile: 10 min at 95 °C plus 40 cycles of 15 s at 95 °C, 30 s at 60 °C and 30 s at 72 °C. Quantitative real-time PCR results were analyzed with Lightcycler 480 software (Roche, Basel, Germany) and quantification was per-formed in qBasePlus software package (Biogazelle, Zulte, Belgium).
2.9. Statistical analysis
Statistical evaluation of data were analysed using the non-para-metric Mann–Whitney U test and correlations between the groups were assessed by non-parametric Spearman correlation. Results were expressed as the mean ± SD (median). All statistical analyses were performed using SPSS Inc., Chicago, USA and differences were considered as statistically significant when the p value was less than 0.05.
3. Results
3.1. Study population: SLE patients with active and inactive disease and healthy controls
Forty-seven subjects were enrolled in the study, comprising thirty-four SLE patients, 15 with active disease (86.7% female, mean age 32 ± 11 years) and nineteen with inactive disease (89.5% female, mean age 34 ± 9 years). Thirteen sex-and age-matched healthy control subjects (NC group) (76.9% female, mean age 34 ± 10 years) were also included. Mean SLEDAI scores in the active SLE and inactive SLE group, was 10.3 ± 3.53 and 2.7 ± 1.52, respectively. The time since diagnosis was 9 ± 5 years in both groups. Lupus nephritis was the most prevalent major or-gan involvement, diagnosed in 66.7% of active SLE and 52.6% of inactive SLE cases. Three patients had neurolupus, all from the inactive SLE group. Prevalence of lupus arthritis was 93.3% in the active SLE group and 68.4% in the inactive SLE group. Haema-tological involvement was present in 93.3% of active SLE and in 84.2% of inactive SLE group patients. Lupus skin disease was found in 80% of active SLE and 52.6% of inactive SLE patients. At time of evaluation, patients with active SLE and inactive SLE, respectively, were receiving treatment with hydroxychloroquine in 80% and 94.7% of cases, prednisone 93.3% and 42.1% (mean daily dose 18.2 mg and 5.3 mg) and immunosuppressants (micofenolate mofetil, azatioprine or cyclosporine) in 53.3% and 31.6%, respectively.
3.2. Frequency of major peripheral T cell subpopulations
The patients with active SLE presented a lower percentage of CD4 PB T cells as compared to NC [active SLE: mean CD4 T cells = 61.1 ± 10.5%; NC: mean CD4 T cells = 72.3 ± 6.0% (p < 0.05)]. There was no statistically significant difference between NC and inactive SLE.
3.3. Functional characterization of peripheral Th1 and Tc1 cells Compared to inactive SLE and NC subjects, active SLE patients presented a significantly lower proportion of CD4 and CD8 T cells producing IL-2, TNF-
a
and IFN-c
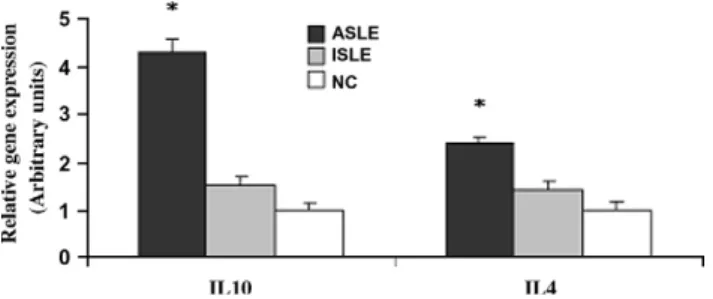
(Table 1). However, when we ana-lysed the amount of each studied cytokine at single cell level (i.e., mean fluorescence intensity, MFI), there was an increased expres-sion of IL-2 in Th1 cells of active SLE patients compared to inactive SLE and NC (p < 0.05). No other significant functional differences were found between the 3 groups, in both Th1 and Tc1 cell subsets (Table 1).3.4. Expression of IL-4 and IL-10 mRNA in whole blood collection The IL-10 and IL-4 mRNA expression was significantly higher in active SLE patients when compared to NC and inactive SLE patients (p < 0.05), without differences between inactive SLE and NC (Fig. 1).
3.5. Frequency and functional characterization of peripheral Th17 and Tc17 cells
The proportion of IL-17-producers among CD8+ cells (Tc17)
was significantly higher in active SLE compared to NC
(p < 0.05). A similar trend was observed for Th17 in both ac-tive and inacac-tive SLE, but did not reach statistical significance (Table 2). No differences were observed in the frequency of Th17 and Tc17 cells between active SLE and inactive SLE groups.
In contrast, analysis of the amount of IL-17 produced at single cell level (MFI) suggested a decreased expression of IL-17 in Th17 and Tc17 subpopulations of SLE subjects compared to NC subjects. This reached a statistical significance for both Th17 and Tc17 cells in active SLE and Th17 in inactive SLE compared to NC (p < 0.05) (Table 2).
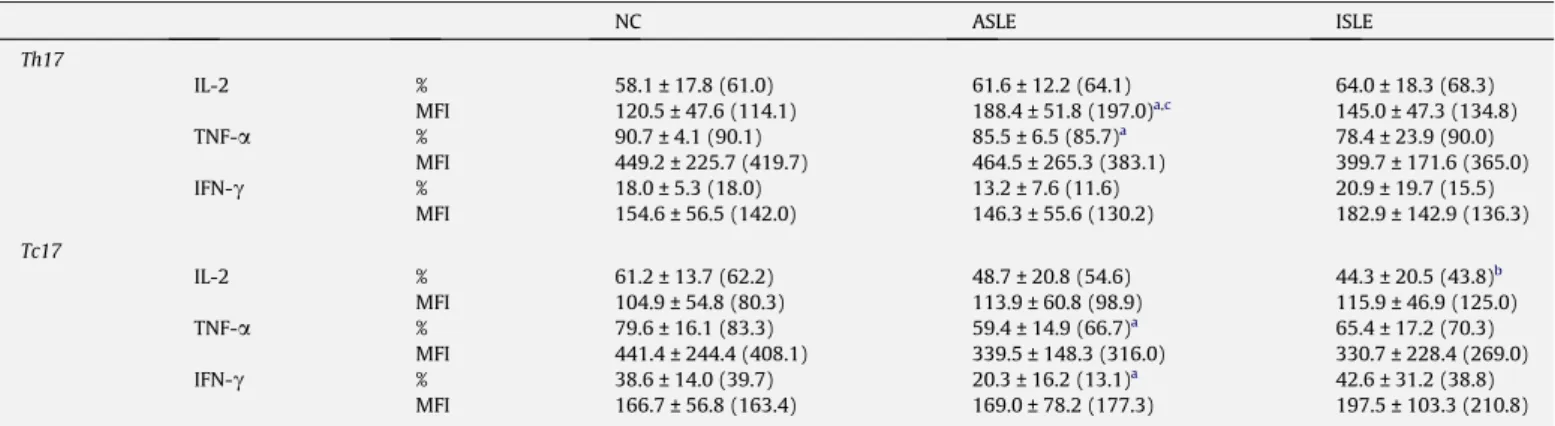
In an attempt to more thoroughly understand the functional activity of Th17 and Tc17 populations in SLE patients, we studied the frequency of those cells producing the pro-inflammatory cyto-kines IL-2, TNF-
a
and IFN-c
and the amount of each studied cyto-kine at single cell level. In NC and in both SLE groups, around 60% of Th17 cells simultaneously secreted IL-2 and 78–90% secreted TNF-a
. In contrast, less than 20% of those cells were producing IFN-c
. Likewise, 40–60% of NC and SLE Tc17 cells produce IL-2 and 60–80% secrete TNF-a
, while less than 40% were secreting IFN-c
Table 3. As shown inTable 3, there was a marked heteroge-neity in the proportion of Th17 and Tc17 cells producing pro-inflammatory cytokines, particularly for Tc17 from all groups. Both IL-17+T-cell subsets producing TNF-a
and the Tc17 producingIFN-c
showed lower frequency in active SLE compared to NC (p < 0.05). In addition, regarding pro-inflammatory cytokine levels in Th17 and Tc17 cells, we observed higher levels of IL-2 in Th17 cells from the active SLE group compared to inactive SLE and NC (p < 0.05), without other significant differences between groups. Cytokine production evaluated through MFI was much higher for TNF-a
than the other studied cytokines in Th(c)17 cells from NC and SLE subjects (Table 3).3.6. Frequency of peripheral regulatory CD25bright/CD127 lowCD4+T
cells
Considering the possible lymphopenia that may occur in pa-tients with SLE, we measured the absolute number of peripheral CD25+/CD127 lowCD4+T cells, which were defined as T
regula-tory cells (Treg) in our experiments. We found a significantly low-er absolute numblow-er (cells/
l
l of PB) and relative frequencies of Treg in active SLE and inactive SLE compared to NC (p < 0.05), particularly in the active SLE group (Table 2). On the other hand, the percentage of Treg cells in the CD4 T-cell subset was similar in the three studied groups (Table 2). The Treg frequency among CD4 T cells in the NC group was inversely correlated with the proportion of TNF-a
producing Th1 cells (p = 0.02; r2= 0.35), butno significant correlation was observed in the SLE group. No cor-relation was found between frequency of Treg and Th17 or Tc17 cells.
3.7. Functional characterization of peripheral regulatory CD25bright/
CD127 lowCD4+T cells by gene expression of FoxP3 and TGF-b1
After cell sorting of CD4+CD25brightCD127 lowTreg, we observed
in these cells a significant increase of FoxP3 and TGF-b1 mRNA in SLE patients comparatively to NC subjects (p < 0.05). Also, there was a trend for an increase in FoxP3 and TGF-b1 gene expression in the active SLE group compared to NC and inactive SLE groups (Fig. 2).
4. Discussion
A central role for the recently discovered Th17 cells as the pri-mary drivers of autoimmune diseases, including SLE, has been pro-posed [8], but the potential role of Th17 cells in SLE is far from clear. The Th17 have functional reciprocal interrelationships with
the classic Th1, Th2 and Treg cells, which are important players in regulating immune responses and in SLE pathogenesis [19,21,22]. In the CD8+ T cell compartment, a Tc17 subset was
newly discovered[14]that might also play a role in autoimmune diseases[16].
This is the first study that evaluates the relative abundance and functional activity of Th17 and Tc17 cells in parallel with Th(c)1, Treg and amount of mRNA type 2 cytokines in SLE. We showed that an increased proportion of Th17 and Tc17 are present in the PB of SLE patients. We also demonstrated that these cells produce not only IL-17 but also that a considerable proportion produce TNF-
a
and IL-2 with a minor proportion secreting IFN-c
. We found a low-er frequency of the plow-eriphlow-eral blood CD4 T-cell subset in SLE pa-tients and a significant decrease in the frequency of Th1 and Tc1 cells producing Th1-type cytokines (IL-2, TNF-a
and IFN-c
) in pa-tients with active disease, when compared with those with inac-tive SLE and controls (Table 1). Interestingly, no differences were observed between inactive disease state and NC group. In addition, when we analysed the amount of each studied cytokine at single cell level (MFI), we observed an increase only in the IL-2 content on CD4 T-cell subsets, particularly in active SLE (Table 1).Regarding the lower numbers of Th(c)1 cells observed in active SLE in our study and considering the important concept that Th1 or Th2 cells influence the homeostasis of each other[29,30], this de-crease could be due to an enhancement of Th2 cell function. In this sense, we analysed classical Th2-cytokines mRNA expression from whole blood cells and demonstrated that T cells from SLE patients could be preferentially polarized to a Th2 profile since we observed a higher amount of IL-10 and less markedly IL-4 mRNA. This may result from a strong downregulation of Th1-secreting T cell popu-lation size observed following PMA/I stimupopu-lation. It is unclear whether only a small number of T cells or other cell types are in-volved in the production of Th2 cytokines at a very high level or whether many cells express small amounts of the respective mRNA. Moreover, recent reports suggest that IL-10 might play a potent inhibitory action on both Th1 and Th2 cell responses and a major role in the development of Treg cells[31,32]. In our study, we found a higher expression of 10 mRNA, and less clearly of IL-4 in active SLE (Fig. 1), which could result in a reduction of Th(c)1 and Th(c)17 subpopulations. Indeed, a reduction in IFN-
c
-produc-ing Th(c)1 cells, may contribute to the induction and maintenance of autoimmunity in SLE by facilitating increased production of B cell stimulatory cytokines by Th2 cells and enhancing the respon-siveness of B cells to these cytokines[33]. The diverse immunosup-pressive drugs received by SLE patients in our study, especiallyTable 1
Frequency of cytokines producing T cells (Th1 and Tc1) and amount of each cytokine per cell (MIF), following PMA/ionomycin activation.
NC ASLE ISLE Th1 IL-2 % 39.2 ± 13.9 (40.4) 25.9 ± 11.3 (24.5)a,b 38.5 ± 10.6 (40.5) MFI 107.4 ± 43.9 (106.1) 172.8 ± 40.2 (177.0)a,c 131.6 ± 46.9 (119.1) TNF-a % 57.9 ± 15.7 43.2 ± 16.7 (43.6)c 55.9 ± 14.7 (60.7) MFI 327.9 ± 160.5 (265.4) 307.2 ± 157.7 (290.2) 336.4 ± 92.4 (324.3) IFN-c % 25.6 ± 6.4 (26.2) 13.1 ± 6.4 (15.3) 24.6 ± 12.1 (22.7) MIF 294.1 ± 89.0 (327.3) 309.0 ± 78.8 (321.1) 320.3 ± 75.0 (298.4) Tc1 IL-2 % 12.5 ± 6.9 (11) 8.1 ± 3.7 (7.5)a,c 16.9 ± 7.8 (16.8) MFI 60.9 ± 13.0 (64.0) 73.6 ± 18.7 (68.5) 69.9 ± 36.6 (59.5) TNF-a % 49.1 ± 14.2% (45.0) 25.2 ± 11.5 (23.4)a,c 46.8 ± 14.1 (45.8) MFI 313.1 ± 119.1 (348.6) 263.5 ± 100.2 (231.5) 334.6 ± 121.8 (297.0) IFN-c % 46.8 ± 12.6 (50.0) 29.0 ± 15.5 (25.8) 43.8 ± 15.0 (43.3) MFI 248.9 ± 79.0 (268.3) 270.9 ± 85.2 (294.3) 269.9 ± 72.9 (264.3) Results are expressed as mean ± standard deviation (median). %, percentage of positive cells; MFI, mean fluorescence intensity of positive cells. NC, healthy individuals, ASLE, active disease, ISLE, inactive disease. Statistically significant differences were considered when p < 0.05 (Mann–Whitney U test).
a
ASLE versus NC.
b
ISLE versus NC.
c
ASLE versus ISLE.
Table 2
Comparative analysis of the overall proportion of Th17, Tc17 and Treg in healthy and patient groups. NC ASLE ISLE Th17 %CD4+ 1.6 ± 0.7 1.9 ± 1.5 2.0 ± 1.2 MFI 90 ± 20 66 ± 17a 63 ± 21b Tc17 %CD8+ 0.3 ± 0.1 0.6 ± 0.4a 0.7 ± 0.8 MFI 87 ± 40 67 ± 33a 68 ± 27 Treg % 0.9 ± 0.3 0.4 ± 0.4a 0.7 ± 0.4b %CD4+ 7.1 ± 2.7 8.1 ± 3.7 8.2 ± 3.5 Cells/ll 0.07 ± 0.02 0.03 ± 0.03a 0.06 ± 0.06b
Results are expressed as mean ± standard deviation. MFI, mean fluorescence intensity of positive cells; %, percent of cells from total PB; %CD4+
, percent of cells from total peripheral CD4+
T cells; %CD8+
, percent of cells from total peripheral CD8+
T cells; NC, healthy individuals, ASLE, active disease, ISLE, inactive disease. Statistically significant differences were considered when p < 0.05 (Mann–Whitney U test).
a
ASLE versus NC.
b
ISLE versus NC.
Fig. 1. Graphic of IL-4 and IL-10 relative gene expression in whole blood cells for SLE patients group and the NC. *Statistically significant differences (p < 0.05) when compared ASLE patients with control group.
those with active disease, may have also influenced T-cell subsets [34,35]and contributed to the interindividual heterogeneity in fre-quencies and functional activity.
Although Th1 subsets are thought to be crucial player for many autoimmune diseases, like SLE, recent studies raise the possibility of involvement of other Th subsets, different from Th1 cells in the induction of autoimmunity.
IL-17 producing T cells are an effector T-cell subset involved in inducing inflammation and autoimmune tissue injury[36]. In this study, we found that the number of Th17 and Tc17 cells was ele-vated in SLE patients compared to NC subjects (Table 2). This cor-roborates the findings of the other available studies [10,11]. However, contrary to Yang et al., we did not find differences in Th17 frequencies between active and inactive SLE patients. The Tc17 showed the same trend for higher frequency in SLE compared to NC, again without differences related to SLE disease activity. To our knowledge, this is the first study to demonstrate the presence and evaluate function of Tc17 cells in SLE. The role of these cells re-mains unclear, however, their presence was demonstrated in a mouse model of multiple sclerosis[16]and in psoriasis skin pla-ques in humans[37]. Tc17 cells display a greatly suppressed cyto-toxic function and share some key features with the Th17 subset
[14,16,37]. We may speculate that Tc17 cooperate with Th17 in similar functions in inflammatory conditions, including SLE and other autoimmune diseases[16,37], infection[16,38]and antitu-mor immunity[39].
When we studied the functional activity of IL-17 producing T cells, we observed a decrease in the frequency of these cells pro-ducing Th1-type cytokines (IL-2, IFN-
c
and TNF-a
) in active SLE (Table 3). Decreased production of TNF-a
by Th(c)17 might have important functional implications, as this cytokine exhibits potent synergy with IL-17 for pro-inflammatory effects[40]. In addition, and in contrast with the findings of Yang et al.[11]we observed a functional abnormality of Th(c)17 cells, demonstrated by the lower amounts of IL-17 per cell found in both groups of SLE pa-tients (Table 2), which were not shown for type 1 cytokines. This results observed in Th(c)17 cells could be explained, at least in a certain extent, by the same reasons described for Th(c)1 cells, with the exception that the number of Th(c)17 cells seem not to be af-fected by therapy or by an increase of Th2 cytokines. We found a great functional heterogeneity of Tc17 cells in SLE patients and their sharing features with both Th1 and Th17. Production of IFN-c
and TNF-a
by Tc17 cells was previously described[16], but to our knowledge, our data are the first in SLE. Despite theappar-Table 3
Frequency of cytokines producing T cells (Th17 and Tc17) and amount of each cytokine per cell (MIF), following PMA/ionomycin activation.
NC ASLE ISLE Th17 IL-2 % 58.1 ± 17.8 (61.0) 61.6 ± 12.2 (64.1) 64.0 ± 18.3 (68.3) MFI 120.5 ± 47.6 (114.1) 188.4 ± 51.8 (197.0)a,c 145.0 ± 47.3 (134.8) TNF-a % 90.7 ± 4.1 (90.1) 85.5 ± 6.5 (85.7)a 78.4 ± 23.9 (90.0) MFI 449.2 ± 225.7 (419.7) 464.5 ± 265.3 (383.1) 399.7 ± 171.6 (365.0) IFN-c % 18.0 ± 5.3 (18.0) 13.2 ± 7.6 (11.6) 20.9 ± 19.7 (15.5) MFI 154.6 ± 56.5 (142.0) 146.3 ± 55.6 (130.2) 182.9 ± 142.9 (136.3) Tc17 IL-2 % 61.2 ± 13.7 (62.2) 48.7 ± 20.8 (54.6) 44.3 ± 20.5 (43.8)b MFI 104.9 ± 54.8 (80.3) 113.9 ± 60.8 (98.9) 115.9 ± 46.9 (125.0) TNF-a % 79.6 ± 16.1 (83.3) 59.4 ± 14.9 (66.7)a 65.4 ± 17.2 (70.3) MFI 441.4 ± 244.4 (408.1) 339.5 ± 148.3 (316.0) 330.7 ± 228.4 (269.0) IFN-c % 38.6 ± 14.0 (39.7) 20.3 ± 16.2 (13.1)a 42.6 ± 31.2 (38.8) MFI 166.7 ± 56.8 (163.4) 169.0 ± 78.2 (177.3) 197.5 ± 103.3 (210.8) Results are expressed as mean ± standard deviation (median). %, Percentage of positive cells; MFI, mean fluorescence intensity of positive cells. NC, healthy individuals, ASLE, active disease, ISLE, inactive disease. Statistically significant differences were considered when p < 0.05 (Mann–Whitney U test):
a
ASLE versus NC.
b
ISLE versus NC.
c
ASLE versus ISLE.
Fig. 2. Graphic of FoxP3 and TGF-b gene expression per cells (Treg) for SLE patients group and the NC (A and B, respectively). NC, healthy individuals; SLE, total SLE patients; ASLE, active disease; ISLE, inactive disease. *Statistically significant differences (p < 0.05) when compared total SLE patients with control group.
ent discrepancies between studies, presence of Th17 and Tc17 cells suggests they might contribute to acute and chronic inflammation in SLE[19,41,42].
The Treg plays a fundamental role in suppression of autoimmu-nity[43]and at the same time have a reciprocal relationship with the Th17 that drives it, as Treg-derived TGF-b is an important inductive cytokine for Th17 development in humans [44]. The Tc17 follow a similar developmental process induced by TGF-b [16]. We investigated the interrelationships of these subsets in SLE in our study. We found a significantly lower absolute number and relative frequencies of Treg (Table 2), but with a significant in-creased FoxP3 and TGF-b1 mRNA in SLE patients compared to NC (Fig. 2). However, there were no significant differences related to SLE activity (Fig. 2). Furthermore, no significant correlations were found between Treg and Th(c)17 or Th(c)1 subsets in these sub-jects. The published studies on the phenotype and functional activ-ity of Treg in SLE patients are contradictory. Some other studies, but not all, also report that Treg are numerically decreased in SLE [45]. Contrary to our results, several studies have suggested that Treg are functionally defective during active SLE[46–48]. Miyara et al.[17]suggested that an increased sensitivity of Treg cells in SLE patients to Fas-mediated apoptosis might account for the re-duced number of Treg cells observed, particularly in patients with active disease. The immunosuppressive treatment may also have an adverse impact on Treg cell frequency in our patients, particu-larly in those with active disease. The decreased numbers of Treg might contribute to the deregulation of T cell homeostasis via IL-10 and TGF-b production[49,50]and consequently to the path-ogenesis of SLE in humans.
In summary, we found in SLE patients compared to NC a trend for increased proportion in Th(c)17 cells, but with lower IL-17 pro-duction and also a decreased frequency of Treg, but with increased production of TGF-b and FoxP3. In active compared to inactive SLE, there is a decreased proportion of Th(c)1 cells, an increased pro-duction of type 2 cytokines mRNA and a distinct functional profile of Th(c)17 cells. Taken together, our findings suggest a functional disequilibrium of T-cell subsets in SLE that might contribute to the inflammatory process and draw novel insights on a hypothet-ical driving role of Th17 and Tc17 cells on disease pathogenesis. SLE is a very heterogeneous disease in clinical grounds and we also found high heterogeneity in T-cell subsets and respective func-tional activity. For further understanding role of T-cell subset dynamics in driving SLE disease activity, there will be needed lon-gitudinal studies.
References
[1] L. Steinman, A brief history of T(H)17, the first major revision in the T(H)1/ T(H)2 hypothesis of T cell-mediated tissue damage, Nat. Med. 13 (2007) 139–145.
[2] M. Funauchi, S. Ikoma, H. Enomoto, A. Horiuchi, Decreased Th1-like and increased Th2-like cells in systemic lupus erythematosus, Scand. J. Rheumatol. 27 (1998) 219–224.
[3] B.M. Ruger, K.J. Erb, Y. He, J.M. Lane, P.F. Davis, Q. Hasan, Interleukin-4 transgenic mice develop glomerulosclerosis independent of immunoglobulin deposition, Eur. J. Immunol. 30 (2000) 2698–2703.
[4] L. Llorente, Y. Richaud-Patin, J. Wijdenes, et al., Spontaneous production of interleukin-10 by B lymphocytes and monocytes in systemic lupus erythematosus, Eur. Cytokine Netw. 4 (1993) 421–427.
[5] A.N. Theofilopoulos, S. Koundouris, D.H. Kono, B.R. Lawson, The role of IFN-gamma in systemic lupus erythematosus: a challenge to the Th1/Th2 paradigm in autoimmunity, Arthritis Res. 3 (2001) 136–141.
[6] S. Brand, Crohn’s disease: Th1, Th17 or both? The change of a paradigm: new immunological and genetic insights implicate Th17 cells in the pathogenesis of Crohn’s disease, Gut 58 (2009) 1152–1167.
[7] H. Shen, J.C. Goodall, J.S. Hill Gaston, Frequency and phenotype of peripheral blood Th17 cells in ankylosing spondylitis and rheumatoid arthritis, Arthritis Rheum. 60 (2009) 1647–1656.
[8] L.A. Garrett-Sinha, S. John, S.L. Gaffen, IL-17 and the Th17 lineage in systemic lupus erythematosus, Curr. Opin. Rheumatol. 20 (2008) 519–525.
[9] H.C. Hsu, P. Yang, J. Wang, et al., Interleukin 17-producing T helper cells and interleukin 17 orchestrate autoreactive germinal center development in autoimmune BXD2 mice, Nat. Immunol. 9 (2008) 166–175.
[10] C.K. Wong, L.C. Lit, L.S. Tam, Li. EK, P.T. Wong, C.W. Lam, Hyperproduction of IL-23 and IL-17 in patients with systemic lupus erythematosus: implications for Th17-mediated inflammation in auto-immunity, Clin. Immunol. 127 (2008) 385–393.
[11] J. Yang, Y. Chu, X. Yang, D. Gao, L. Zhu, X. Yang, L. Wan, M. Li, Th17 and natural Treg cell population dynamics in systemic lupus erythematosus, Arthritis Rheum. 60 (2009) 1472–1483.
[12] J. Dai, B. Liu, D.J. Cua, Z. Li, Essential roles of 12 and dendritic cells but not IL-23 and macrophages in lupus-like diseases initiated by cell surface HSP gp96, Eur. J. Immunol. 37 (2007) 706–715.
[13] K. Kurasawa, K. Hirose, H. Sano, H. Endo, H. Shinkai, Y. Nawata, K. Takabayashi, I. Iwamoto, Increased interleukin-17 production in patients with systemic sclerosis, Arthritis Rheum. 43 (2000) 2455–2463.
[14] T. Kondo, H. Takata, F. Matsuki, M. Takiguchi, Cutting edge: Phenotypic characterization and differentiation of human CD8+
T cells producing IL-17, J. Immunol. 182 (2009) 1794–1798.
[15] B. Ciric, M. El-behi, R. Cabrera, G.X. Zhang, A. Rostami, IL-23 drives pathogenic IL-17-producing CD8+
T cells, J. Immunol. 182 (2009) 5296–5305.
[16] M. Huber, S. Heink, H. Grothe, A Th17-like developmental process leads to CD8(+) Tc17 cells with reduced cytotoxic activity, Eur. J. Immunol. 39 (2009) 1716–1725.
[17] M. Miyara, Z. Amoura, C. Parizot, et al., Global natural regulatory T cell depletion in active systemic lupus erythematosus, J. Immunol. 175 (2005) 8392–8400.
[18] J.C. Crispin, A. Martinez, J. Alcocer-Varela, Quantification of regulatory T cells in patients with systemic lupus erythematosus, J. Autoimmun. 21 (2003) 273– 276.
[19] H. Park, Z. Li, X.O. Yangm, et al., A distinct lineage of CD4 T cells regulates tissue inflammation by producing interleukin 17, Nat. Immunol. 6 (2005) 1133–1141.
[20] L.E. Harrington, R.D. Hatton, P.R. Mangan, H. Turner, T.L. Murphy, K.M. Murphy, C.T. Weaver, Interleukin 17-producing CD4+
effector T cells develop via a lineage distinct from the T helper type 1 and 2 lineages, Nat. Immunol. 6 (2005) 1123–1132.
[21] E. Volpe, N. Servant, R. Zollinger, S.I. Bogiatzi, P. Hupe, E. Barillot, V. Soumelis, A critical function for transforming growth factor-beta, interleukin 23 and proinflammatory cytokines in driving and modulating human T(H)-17 responses, Nat. Immunol. 9 (2008) 650–657.
[22] L. Xu, A. Kitani, I. Fuss, W. Strober, Cutting edge: regulatory T cells induce CD4+
CD25-Foxp3- T cells or are self-induced to become Th17 cells in the absence of exogenous TGF-beta, J. Immunol. 178 (2007) 6725–6729. [23] M.C. Hochberg, Updating the American College of Rheumatology revised
criteria for the classification of systemic lupus erythematosus, Arthritis Rheum. 40 (1997) 1725.
[24] E.M. Tan, A.S. Cohen, J.F. Fries, et al., The 1982 revised criteria for the classification of systemic lupus erythematosus, Arthritis Rheum. 25 (1982) 1271–1277.
[25] C. Bombardier, D.D. Gladman, M.B. Urowitz, D. Caron, C.H. Chang, Derivation of the SLEDAI. A disease activity index for lupus patients. The Committee on Prognosis Studies in SLE, Arthritis Rheum. 35 (1992) 630–640.
[26] D.D. Gladman, D. Ibanez, M.B. Urowitz, Systemic lupus erythematosus disease activity index 2000, J. Rheumatol. 29 (2002) 288–291.
[27] B. Griffiths, M. Mosca, C. Gordon, Assessment of patients with systemic lupus erythematosus and the use of lupus disease activity indices, Best Pract. Res. Clin. Rheumatol. 19 (2005) 685–708.
[28] J. Vandesompele, K. De Preter, F. Pattyn, B. Poppe, N. Van Roy, A. De Paepe, F. Speleman, Accurate normalization of real-time quantitative RT-PCR data by geometric averaging of multiple internal control genes, Genome Biol. 3 (2002). [29] P.A. Morel, T.B. Oriss, Crossregulation between Th1 and Th2 cells, Crit. Rev.
Immunol. 18 (1998) 275–303.
[30] A.K. Abbas, K.M. Murphy, A. Sher, Functional diversity of helper T lymphocytes, Nature 383 (1996) 787–793.
[31] S. Specht, L. Volkmann, T. Wynn, A. Hoerauf, Interleukin-10 (IL-10) counterregulates IL-4-dependent effector mechanisms in Murine Filariasis, Infect. Immun. 72 (2004) 6287–6293.
[32] K.H. Mills, Regulatory T cells: friend or foe in immunity to infection?, Nat Rev. Immunol. 4 (2004) 841–855.
[33] B.S. Handwerger, V. Rus, L. da Silva, CS Via, The role of cytokines in the immunopathogenesis of lupus, Springer Semin. Immunopathol. 16 (1994) 153–180.
[34] J. Ermann, B.L. Bermas, The biology behind the new therapies for SLE, Int. J. Clin. Pract. 61 (2007) 2113–2119.
[35] F. Ramirez, D.J. Fowell, M. Puklavec, S. Simmonds, D. Mason, Glucocorticoids promote a TH2 cytokine response by CD4+
T cells in vitro, J. Immunol. 156 (1996) 2406–2412.
[36] C.A. Murphy, C.L. Langrish, Y. Chen, W. Blumenschein, T. McClanahan, R.A. Kastelein, J.D. Sedgwick, D.J. Cua, Divergent pro- and antiinflammatory roles for IL-23 and IL-12 in joint autoimmune inflammation, J. Exp. Med. 198 (2003) 1951–1957.
[37] C. Ortega, A.S. Fernandez, J.M. Carrillo, P. Romero, I.J. Molina, J.C. Moreno, M. Santamaria, IL-17-producing CD8+
T lymphocytes from psoriasis skin plaques are cytotoxic effector cells that secrete Th17-related cytokines, J. Leukoc. Biol. 86 (2009) 435–443.
[38] H. Hamada, L. Garcia-Hernandez Mde, J.B. Reome, et al., Tc17, a unique subset of CD8 T cells that can protect against lethal influenza challenge, J. Immunol. 182 (2009) 3469–3481.
[39] C.S. Hinrichs, A. Kaiser, C.M. Paulos, et al., Type 17 CD8+T cells display
enhanced antitumor immunity, Blood 114 (2009) 596–599.
[40] F. Shen, S.L. Gaffen, Structure-function relationships in the IL-17 receptor: implications for signal transduction and therapy, Cytokine 41 (2008) 92–104.
[41] V. Dardalhon, T. Korn, V.K. Kuchroo, A.C. Anderson, Role of Th1 and Th17 cells in organ-specific autoimmunity, J. Autoimmun. 31 (2008) 252–256. [42] L. Steinman, A rush to judgment on Th17, J. Exp. Med. 205 (2008)
1517–1522.
[43] J. Milner, J. Ward, A. Keane-Myers, B. Min, W.E. Paul, Repertoire-dependent immunopathology, J. Autoimmun. 29 (2007) 257–261.
[44] L. Yang, D.E. Anderson, C. Baecher-Allan, W.D. Hastings, E. Bettelli, M. Oukka, V.K. Kuchroo, D.A. Hafler, IL-21 and TGF-beta are required for differentiation of human T(H)17 cells, Nature 454 (2008) 350–352.
[45] S. Mellor-Pita, M.J. Citores, R. Castejon, P. Tutor-Ureta, M. Yebra-Bango, J.L. Andreu, J.A. Vargas, Decrease of regulatory T cells in patients with systemic lupus erythematosus, Ann. Rheum. Dis. 65 (2006) 553–554.
[46] X. Valencia, C. Yarboro, G. Illei, P.E. Lipsky, Deficient CD4+CD25highT regulatory
cell function in patients with active systemic lupus erythematosus, J. Immunol. 178 (2007) 2579–2588.
[47] Y. Chen, C. Cuda, L. Morel, Genetic determination of T cell help in loss of tolerance to nuclear antigens, J Immunol. 174 (2005) 7692–7702.
[48] E.Y. Lyssuk, A.V. Torgashina, S.K. Soloviev, E.L. Nassonov, S.N. Bykovskaia, Reduced number and function of CD4+
CD25high
FoxP3+
regulatory T cells in patients with systemic lupus erythematosus, Adv. Exp. Med. Biol. 601 (2007) 113–119. [49] O. Annacker, R. Pimenta-Araujo, O. Burlen-Defranoux, T.C. Barbosa, A. Cumano,
A. Bandeira, CD25+
CD4+
T cells regulate the expansion of peripheral CD4 T cells through the production of IL-10, J. Immunol. 166 (2001) 3008–3018. [50] M. Murakami, A. Sakamoto, J. Bender, J. Kappler, P. Marrack, CD25+
CD4+
T cells contribute to the control of memory CD8+
T cells, Proc. Natl. Acad. Sci. USA 99 (2002) 8832–8837.