UNIVERSIDADE DE LISBOA FACULDADE DE CIÊNCIAS
DEPARTAMENTO DE BIOLOGIA ANIMAL
Study of the factors that regulate the expression of
Jagged-2
Ana Raquel Machado Duarte
DISSERTAÇÃO
MESTRADO EM BIOLOGIA HUMANA E AMBIENTE 2013
III UNIVERSIDADE DE LISBOA
FACULDADE DE CIÊNCIAS
DEPARTAMENTO DE BIOLOGIA ANIMAL
Study of the factors that regulate the expression of
Jagged-2
Ana Raquel Machado Duarte
DISSERTAÇÃO
MESTRADO EM BIOLOGIA HUMANA E AMBIENTE
Dissertação orientada pelo Doutor Sérgio Jerónimo Dias, Unidade de Neovascularização, Instituto de Medicina Molecular da Faculdade de Medicina da Universidade de Lisboa e pela Professora Doutora Ana Maria Crespo; Departamento de Biologia Animal; Faculdade de Ciências da Universidade de Lisboa.
V Pai.
As adversidades da vida nunca te fizeram desistir. Hoje dedico especialmente a ti a minha tese, pois a mais ninguém pode ela significar tanto.
Mãe.
Pelo simples e grandioso facto de seres minha mãe, única, insubstituível, inigualável e incansável. Vocês são, sempre foram e para sempre serão o meu exemplo e o meu orgulho para a vida.
Hardships often prepare ordinary people for an extraordinary destiny
VII
N
OTAP
RÉVIAPara a elaboração da presente tese de mestrado foi escolhida uma revista científica na área, na qual foi baseada a formatação desta dissertação de mestrado em Biologia Humana e Ambiente. A revista científica, por mim, escolhida foi a:
NATURE REVIEWS | CANCER
O trabalho prático da dissertação foi elaborado na Unidade SDias, no Instituto de Medicina Molecular da Faculdade de Medicina da Universidade de Lisboa.
IX
A
GRADECIMENTOSEmbora a dissertação da tese seja individual, não posso deixar de expressar aqui os meus sinceros agradecimentos a todos os que de alguma forma contribuíram para este trabalho.
Em primeiro lugar gostaria de agradecer ao Prof. Doutor Sérgio Dias por me ter dado a oportunidade de trabalhar neste projecto e dado todo o apoio e orientação durante este ano. Pelo tempo que generosamente me dedicou, pelo conhecimento transmitido, pelas sugestões, e também pelos merecidos “puxões de orelhas” quando necessários. À Prof. Doutora Ana Crespo pela disponibilidade de aceitar co-orientar este meu trabalho e pela simpatia que demonstrou durante todo este percurso.
À Prof. Doutora Deodália Dias por ter sido desde o primeiro momento um grande apoio, pelo tempo que generosamente me dedicou, pela transmissão de conhecimentos, pelas críticas e sugestões prestadas no decorrer do trabalho e pela amizade
À Doutora Maria Soares, investigadora neste instituto, pelo auxílio e disponibilidade prestada, assim como a transmissão de conhecimentos nos estudos de citometria de fluxo.
À Doutora Diana Martins, por generosamente ter cedido as amostras de sangue do cordão umbilical, fulcral para o desenvolvimento deste trabalho.
À Ana Magalhães, que tanto contribuiu para o desenvolvimento de meu trabalho. Pelo apoio incondicional, pelo estímulo e entusiasmo, pelas críticas e sugestões, a disponibilidade, a paciência e o sorriso sempre presente.
Á grande equipa SDias, pelas dicas e integração na vida de bancada. Assim como a ajuda e sabedoria que tantas vezes me dispensaram para a realização das minhas experiências e por conseguirem transformar tantos momentos complicados em verdadeiros momentos felizes.
À Andreia e à Celina pela excelente amizade que criámos, por toda a ajuda, apoio, companheirismo, momentos e sonhos partilhados.
E de um modo geral a todos aqueles que directa ou indirectamente me foram ajudando, fornecendo informações, ideias e críticas, algumas das quais essenciais para a prossecução deste trabalho.
Aos meus amigos, pela presença, estímulo, apoio contínuo e pelas risadas constantes. Principalmente à Carina, Daniela, Cláudia, Andreia, Cláudio e Valter pela paciência, compreensão, desabafos e palavras de encorajamento. O que seria de mim sem vocês! À minha família, que tanto me tem apoiado nos momentos mais difíceis.
Aos meus pais, que são as melhores pessoas que alguma vez conheci. Que são o meu porto de abrigo de sempre e para sempre! Pelo apoio incondicional, compreensão, confiança, conforto e dedicação.
Ao meu irmão João, que sem o perceber não me deixa desanimar e encoraja sempre a seguir em frente ultrapassando todos os obstáculos. Obrigada pela amizade e por todos os bons momentos.
XI
P
ALAVRAS-
CHAVECélulas derivadas da medula óssea; EMT; Jagged-2; metástases
R
ESUMOTodos os dias, o organismo humano produz milhares de células, através de um processo denominado hematopoiese. As células hematopoiéticas estão envolvidas em processos fisiológicos e patológicos. A hematopoiese é regulada por factores genéticos e pelo ambiente circundante. É esta interacção que determina o destino de cada tipo celular, bem como regula a sua proliferação, diferenciação, a autorrenovação, a apoptose, ou se permanecem em repouso (quiescência). Assim, o controle inadequado de manutenção da hematopoiese está intimamente ligado ao desenvolvimento de neoplasias hematológicas. Compreender a biologia da hematopoiese e a regeneração da imunidade celular, pode resultar na diminuição da morbidade, mortalidade associada a patologias hematológicas e na descoberta de novas terapias.
A angiogénese, outro dos processos envolvidos na manutenção e crescimento celular, é indispensável para o crescimento tumoral e formação de metástases envolvendo a formação de novos vasos sanguíneos capilares a partir de vasos pré-existente. Outros mecanismos de formação de vasos sanguíneos têm sido sugeridos, nomeadamente a vasculogénese, envolvendo o recrutamento de células derivadas da medula óssea.
Na última década foi ainda sugerido que a formação de metástases tumorais possa envolver a contribuição de células não-malignas nomeadamente por populações de células derivadas da medula óssea. Numa tentativa de compreender a formação de metástases, como um evento "sistémico" do cancro, vários foram os autores que estudaram o papel das células derivadas da medula óssea, capazes de induzir angiogénese no tumor primário e também na formação do nicho pré-metastático. No entanto, o papel directo das células derivadas da medula óssea na formação de metástases do tumor primário não tinha sido descrito até recentemente, por estudos do nosso laboratório.
Jagged-2 é uma proteína transmembranar que se caracteriza por um terminal-N de domínio DSL (Delta, Serrate, LAG- 2) que é essencial para a interacção com o receptor Notch. Este ligando pertence à via de sinalização Notch, uma via conservada evolutivamente que é necessária para o desenvolvimento embrionário, a regulação da homeostase dos tecidos e para a manutenção de células estaminais em adultos. Esta
XII
via está entre os canais de comunicação mais utilizados em células animais. A via de sinalização Notch tem vários papéis na especificação do destino final da célula, na padronização dos tecidos e na morfogénese através dos efeitos sobre a diferenciação, proliferação, sobrevivência e apoptose. Um aspecto interessante da via Notch é a sua função aparentemente contraditória no desenvolvimento de tumores, pois pode actuar como um oncogene ou como um gene supressor do tumor. Devido à importância da via de sinalização Notch no desenvolvimento embrionário e adulto, há várias doenças humanas associadas a defeitos nos genes que estão envolvidos na sinalização Notch. Mutações na via de sinalização Notch podem causar o desenvolvimento de fenótipos que afetam o fígado, o esqueleto, o coração, os olhos, o rosto, os rins e o sistema vascular. Outra condição muito grave causada pela desregulamentação da atividade de sinalização da via Notch resulta da transformação de células-T que causam leucemia linfoblástica aguda. Com a possível exceção de algumas neoplasias epidérmicas humanas, a inibição da via de sinalização Notch é uma estratégia viável para o tratamento de certos tumores sólidos e hematopoiéticos.
Novas evidências indicam que para se controlar efetivamente o cancro é preciso considerar o mesmo como uma doença que envolve complexas interações multicelulares heterotípicas dentro de um tecido recém-formado, o tecido cancerígeno. A progressão do tumor envolve várias etapas, até as células cancerígenas adquirirem a capacidade de invasão para outros locais mais distantes do corpo.
A formação de metástases é o resultado de um processo complexo, que possui múltiplos passos e é muitas vezes denominado de cascata de invasão de metástases. Um dos principais processos que regulam a invasão local de tumores epiteliais é denominado epitelial-mesenquimal (EMT). A progressão tumoral está associada à aquisição do fenótipo mesenquimal, que é acompanhada pela perda de expressão de marcadores epiteliais e aumento de marcadores moleculares mesenquimatosos. Assim, EMT é um processo caracterizado por uma transdiferenciação ao nível das células do tumor, e por uma diminuição nos marcadores epiteliais, tais como sub-regulação e relocalização de E-caderina; perda de adesão célula-a-célula; polaridade apical-basal; reorganização do citoesqueleto de actina bem como a regulação negativa e a translocação de β-catenina da membrana da célula para o núcleo e da aquisição de marcadores mesenquimatosos, tais como vimentina; fibronectina e N-caderina associados com o aumento da motilidade celular e a capacidade de invasão.
Através de Jagged-2, ligando da via de sinalização Notch, envolvido nas junções célula-a-célula e, consequentemente, na formação de metástases, foram estudados os
XIII factores envolvidos na expressão de Jagged-2. O objetivo principal deste trabalho foi investigar os fatores que regulam a expressão de Jagged-2 e que possam estar presentes no microambiente tumoral. Para atingir este objectivo, fomos estudar as células mononucleares do sangue periférico e do sangue do cordão umbilical de indivíduos saudáveis, na tentativa de determinar quais as células circulantes com maior expressão de Jagged-2 e descobrir os factores envolvidos na regulação da expressão de Jagged-2.
Começamos por determinar qual a expressão de Jagged-2 em circulação, no sangue periférico de pessoas saudáveis e no sangue do cordão umbilical. No sangue periférico e no sangue do cordão umbilical de pessoas saudáveis foram encontradas diferenças significativas a nível da expressão de Jagged-2, tanto por RT- qPCR como por citometria de fluxo.
Para percebermos quais os factores que regulam a expressão de Jagged-2, utilizamos alguns ensaios in vitro. Submetemos células leucémicas a várias condições de hipoxia. Os nossos resultados sugerem que o CoCl2 que induz hipoxia em células leucémicas e regula a expressão de Jagged-2. Outro dos nossos ensaios in vitro foi a presença ou ausência de FBS nas mesmas células, estes resultados também sugerem que a ausência de FBS regula a expressão de Jagged-2.
Este é apenas um ponto de partida para uma futura investigação, tanto a nível dos “ligandos” da via de sinalização Notch, nomeadamente o Jagged-2, como na formação de metástases presentes num grande número de cancros. Se todos os factores que regulam a expressão de Jagged-2 forem estudados e combinados com alguns tipos de cancro metastático pode ser possível criar terapias específicas que atrasem o aparecimento de metástases.
XV
K
EYWORDSBone marrow derived cells; EMT; Jagged2, metastasis
A
BSTRACTOver the last decade there has been an increase in the understanding of the regulate factors in the tumor progression and metastasis formation. In an attempt to understand metastases formation as a “systemic” event of cancer, several authors have reported the role of Bone Marrow (BM) derived cells in inducing primary tumor angiogenesis and also in the formation of the pre-metastatic niche.
The main objective of this thesis was to investigate the factors that regulate the expression of Jagged-2. Jagged-2 is a transmembrane protein and it is a ligand of the Notch signaling pathway, required for embryonic development, the regulation of tissue homeostasis, and the maintenance of stem cells in adults. The Notch pathway has multiple roles in cell fate specification, tissue patterning, and morphogenesis through effects on differentiation, proliferation, survival, and apoptosis. An interesting aspect of the Notch pathway are it apparently opposite functions in tumor development, because it can act as an oncogene or as a tumor suppressor. In many individuals, the endpoint of multistep tumor progression involves, unfortunately, the acquisition by cancer cells of the ability to invade and to metastasize from the primary tumor to distant sites in the body - the manifestations of high-grade malignancy. One of the major processes regulating local invasion in epithelial tumors is termed Epithelial to Mesenchymal Transition (EMT) which is associated with the acquisition of mesenchymal phenotype, which is accompanied by the loss of epithelial marker expression and up-regulation of mesenchymal molecular markers.
Through the expression of Jagged 2 ligand of Notch pathway involved in junction cell-to-cell and consequently the formation of metastases, we studied the factors involved in the expression of Jagged 2. Our findings suggested that hypoxia-induced CoCl2 in leukemic cells regulates the expression of Jagged2 and that the absence of the FBS also regulates the expression of Jagged2. Using both by qRT-PCR and flow cytometry methods, differences in the expression levels of Jagged 2 were found in peripheral and umbilical cord bloods of healthy people. This could be a starting point for a viable strategy for treatment and new targeted therapies.
XVII
XIX
Nota Prévia VII
Agradecimentos IX
Palavras-chave XI
Resumo XI
Keywords XV
Abstract XV
List of Figures XXI
List of tables XXII
List of Abbreviations XXIII
1 Introduction ... 1
1.1 Hematopoiesis 3
1.2 The Vascular System 4
1.2.1 Vasculogenesis 4
1.2.2 Angiogenesis 5
1.3 the contribution of Bone-Marrow Derived Cells in angiogenesis and
metastases formation 5
1.4 Metastasis Formation 6
1.4.1 Epithelial to Mesenchymal Transition (EMT) 7
1.5 Notch-Delta Signaling Pathway 9
1.5.1 Receptors and Ligands of the Notch pathway 10
1.5.2 the Notch Pathway in disease 11
1.4.3 Notch pathway in cancer 12
1.6 Objectives of this thesis 13
2 Materials and Methods ... 15
2.1 Sample Collection 17
2.2 Isolation of mononuclear cells 17
2.3 Cell culture 17
XX
2.3.2 In vitro assays 18
2.4 RNA extraction 18
2.5 cDNA synthesis 19
2.6 Quantitative Real-Time Polymerase Chain Reaction (qRT-PCR) 19
2.7 Flow Cytometry 19
2.8 Statistical Analysis 20
3 Results ... 21
3.1 Maintenance of mononuclear cells in different conditions 23 3.1.1 Standard Medium Culture 23 3.1.2 PFA fixation 24 3.1.3 PBS 24 3.2 CD11b and Jagged-2 expressed in peripheral blood 25 3.2.1 flow cytometry results 25 3.2.2 qRT-PCR results 26 3.3 CD11b and Jagged-2 expressed in umbilical cord blood samples 27 3.3.1 flow cytometry results 27 3.3.2 qRT-PCR results 28 3.4 Jagged-2 expression on leukemia cell lines 29 3.4.1 Jurkat cells line 31 3.4.2 Influence of the FBS in cell viability 32 3.4.3 Influence of the Hypoxia on cell viability 33 3.4.4 Effect of FBS and Hypoxia on Jagged-2 expression by Jurkat cells 34 4 Discussion ... 35
5 Conclusion ... 41
6 References ... 45
XXI
L
IST OFF
IGURESFigure 1| Hematopoietic and stromal cell differentiation.5 4
Figure 2| The invasion-metastasis cascade. 6
Figure 3| Epithelial-to-mesenchymal transition (EMT). 8 Figure 4| Schematic representation of the Notch-Delta signalling pathway. 10 Figure 5| PBMCs in culture expressed CD11b/Jagged2 by flow cytometry. 23 Figure 6| PBMCs fixed with 4% PFA expressed CD11b/Jagged2 by flow
cytometry 24
Figure 7| PBMCs in PBS expressed CD11b/Jagged2 by flow cytometry 25 Figure 8| Mononuclear cells stained (CD11b and Jag2) present in PB 26 Figure 9| Jagged2 expressed in peripheral blood mononuclear cells 27 Figure 10| Mononuclear cells stained (CD11b and Jag2) present in CB. 28 Figure 11| Jagged2 expressed in peripheral blood mononuclear cells. 29
Figure 12| Jagged2 expressed in different cells 29
Figure 13| Jagged2 expressed in different cells. 31 Figure 14| Jurkat cells survival under standard culture conditions. 32 Figure 15| Effect of FBS and CoCl2 in Jurkat cells viability. 33 Figure 16| Jagged 2 expression by Jurkat cells under different culture conditions 34
XXII
L
IST OF TABLESTable 1| Diseases caused by altered Notch signalling 12 Table 2| Abnormal Notch signalling in turmorigenesis. 13
XXIII
L
IST OFA
BBREVIATIONSADAM – a Disintegrin and Metalloproteinase APC – Allophycocyanin
ATCC – American Type Culture Collection BM – Bone Marrow
BSA – Bovine Serum Albumine
CADASIL – Cerebral Autosomal Dominant Arteriopathy with Subcortical Infarcts and Leukoencephalopathy
CB – Cord Blood
CBMC’s – Cord Blood Mononuclear Cells CO2 – Carbon Dioxide
CoCl2 – Cobalt (II) Chloride
DEPC – Deithylpyrocarbonate Dll – Delta-like
DMSO – Dimethyl Sulfoxide DNA – Deoxyribonucleic Acid dNTPs – deoxynucleotides DSL – Delta; Serrate; LAG-2
EDTA – Ethylenediamine Tetraacetic Acid EGF – Epidermal Growth Factor
EMT – Epithelial to Mesenchymal Transition EPC’s – Endothelial Progenitor Cells
FACS – Fluorescense-activated cell sorting FBS – Fetal Bovine Serum
FITC – Fluorescein Flk1 – Fetal liver kinase 1
XXIV
FWD – Forward H - Hours
Hes – Hairy/Enhancer of Split HSC’s – Hematopoietic Stem Cells IPS – Instituto Português do Sangue Jag – Jagged
KDR – Kinase insert Domain Receptor Mam1 – Mastermind-like 1
MET – Mesenchymal-Epithelial Trasition mL – mililitre
mRNA – Messenger Ribonucleic Acid NICD – Notch Intracellular Domain
Nrarp – Notch regulated ankyrin repeat protein PB – Peripheral Blood
PBS – Phosphate Buffered Saline
PBMC’s – Peripheral Blood Mononuclear Cells PE – R-Phycoerythrin
PerCP – Peridinin Chlorophyll Protein Complex PFA – Paraformaldehyde
qRT-PCR – quantitative Real-Time Polymerase Chain Reaction RCLB – Red Cell Lysis Buffer
REV – Reverse
RNA – Ribonucleic Acid
RPMI – Roswell Park Memorial Institute RT- Room Temperature
XXV T-ALL – T-cell malignancies
TAMs – Tumor associated macrophages VEGF – Vascular Endothelial Growth Factor
VEGFR-2 – Vascular Endothelial Growth Factor Receptor 2 µl – Microlitre (10-3 ml)
1
Introduction
3
1.1
H
EMATOPOIESISEvery day, the human organism produces thousands of cells, this process is called hematopoiesis. These cells (white blood cells, red blood cells, and platelets) are involved in physiological and pathological events2.
Hematopoiesis is in detail the process by which all lineages of blood cells are generated in a hierarchical and stepwise manner from immature cells present in the Bone Marrow (BM) and subsequently released into circulating blood and peripheral organs for further maturation steps and/or effector function 3, 67. The hematopoietic system consists in many cell types with specialized functions (Figure 1), such as the red blood cells (erythrocytes), whose carry oxygen to the tissues, the platelets, that help prevent bleeding, the granulocytes (neutrophils, basophils and eosinophils) and macrophages (known as myeloid cells), that fight infections from bacteria, fungi, and other parasites. Also, B-lymphocytes produce antibodies, while T-lymphocytes can directly kill or isolate inflammated cells recognized as foreign to the body, including many virus-infected cells and cancer cells. Some of these cells are also involved in tissue and bone remodeling as well as in the removal of dead cells 3, 5. Also important is the contribution of the bone marrow stroma in the control and regulation of hematopoiesis. The bone marrow microenvironment, thus consists in many different cell types which interact and modulate the outcome of the hematopoietic process (Figure 1).
Introduction
4
Figure 1| Hematopoietic and stromal cell differentiation.5
The hematopoietic process requires a careful regulation of the cells genetic factors and those exerted by the surrounding environment. It is this interaction that determines cell fate (hematopoietic stem cells (HSCs), progenitors, and mature blood cells) as cells proliferate, differentiate, self-renew, undergo apoptosis, or remain quiescent. So, improper control of HSCs maintenance is intimately tied to the development of hematological malignancies. 2, 3, 67.
Understanding the biology of hematopoiesis and the generation of immunity may result in decreased morbidity, mortality as a consequence of hematological diseases and may contribute towards the discovery of new therapies.
1.2
T
HEV
ASCULARS
YSTEMBlood vessels supply oxygen and nutrients to all tissues and organs in our body and provide a gateway for immune surveillance. The network of blood vessels includes arteries, veins, arterioles, venules and capillaries. Large vessels are responsible for blood transport and smaller vessels, specifically capillaries, for exchange of gases and metabolites over the vessel wall 23.
The urge to explore the secrets about blood and lymph vessel development and behavior has exploded parallel to the increasing knowledge about their role in a number of pathologic and physiologic conditions 24, 25
1.2.1 V
ASCULOGENESISVascularization is critical for embryonic development and for normal physiological functions in large multicellular organisms 25.
In the embryo, the first vessels arise by de novo formation of blood vessels from precursor cells, angioblasts or vascular precursor cells, that shape blood islands which later fuse to create a primitive plexus of vessels. This process is referred to as vasculogenesis 23.
The primitive vascular network is modified by the process of angiogenesis, leading to maturation, branching and formation of a complex vascular network. Vasculogenesis has long been thought of being restricted to the pre-natal stage
Introduction
5 occurring exclusively in the developing embryo. However, recent data has shown that neovascularization in adult life, both in pathological and physiological conditions, can also occur by vasculogenesis, and is particularly important in certain solid and hematological cancers 24, 25.
1.2.2 A
NGIOGENESISIn contrast to vasculogenesis, angiogenesis refers to the formation of new blood vessels from pre-existing ones. Angiogenesis depends on cell adhesion and proteolytic mechanisms that involve the activity of growth factors, extracellular matrix proteins, proteases and adhesion molecules 28, 29. This process occurs throughout our lifespan. Normal (physiological) angiogenesis is vital for wound healing and for the development of the endometrium during the uterine cycle 26, 27. This process is involved in various physiological processes such as organ growth, wound healing, revascularization of ischemic tissue, ovulation, menstruation, implantation and pregnancy 25.
When angiogenic growth factors are created in greater amounts than angiogenesis inhibitors, the balance is tilted in favour of the growth of new blood vessels. When inhibitors are present in greater amounts than stimulators, angiogenesis is stopped. In a healthy status, the body maintains a balance of angiogenesis regulators. 25, 27. Also, angiogenesis is indispensable for metastatic growth. 26.
1.3
THE CONTRIBUTION OFB
ONE-M
ARROWD
ERIVEDC
ELLS IN ANGIOGENESIS AND METASTASES FORMATIONSeveral studies have demonstrated that Bone Marrow - derived cells are recruited to angiogenic sites to support the establishment of new vessels, namely through the involvement of endothelial progenitors cells 34, 69, 70.
Endothelial progenitor cells, which are mainly located in the bone marrow niche postnatally, play a crucial role in angiogenesis. These cells are phenotypically characterized as CD34+, CD133+ and VEGF receptor 2+ (VEGFR-2+, also known as KDR or Flk1), among other less consensual markers. The process of neovascularization involves the release of endothelial progenitor cells from the bone marrow to the blood circulation in response to various signals 26.
In the last decade there has been increasing evidence suggesting that tumor metastasis is also regulated by non-malignant cells of the tumor microenvironment,
Introduction
6
namely by bone marrow - derived cell populations 35. In fact distinct BM-derived populations such as Tumor Associated Macrophages (TAMs) 36, 37, 38, pre-metastatic niche cells 39, 40 and Endothelial Progenitor Cells (EPCs) 36 have been shown to enhance metastization via multiple processes. Nevertheless a direct role of BM-derived cells in promoting early metastases-promoting changes at the primary tumor, namely the induction of Epithelial to Mesenchymal Transition (EMT, described in the next section) at the primary tumor had not been described.
1.4
M
ETASTASISF
ORMATIONA possible endpoint of the multistep tumor progression model involves the acquisition by cancer cells of the ability to invade and to metastasize from the primary tumor to distant sites in the body—the manifestations of high-grade malignancy. Indeed, the formation of are responsible for 90% of cancer-associated mortality 9, 10. Despite significant advances in the treatment of primary tumors, metastases remain a significant clinical problem, likely reflecting our limited knowledge of the mechanisms governing this complex process (Figure 2) 10.
The formation of metastases is the result of a complex, multistep process that is often termed the invasion-metastasis cascade. These steps include: local invasion by tumor cells; entry into systemic circulation (‘intravasation’); invasion of the target organ (‘extravasation’); and finally proliferation and growth of the secondary tumor 11. One of the major processes regulating local invasion in epithelial tumors is termed Epithelial to Mesenchymal Transition (EMT) 12, 13.
Figure 2| The invasion-metastasis cascade. Cancer cells in the primary tumor acquire the ability to invade adjacent tissue, enter into the vessels of the blood and lymphatic systems (intravasation), travel in
Introduction
7 these channels to distant sites in the body, escape from these vessels (extravasation) into nearby tissues, and establish small tumor colonies (micrometastases) in these tissues. On occasion, the cells forming a micrometastasis will acquire the ability to proliferate vigorously, resulting in the formation of a macroscopic
metastasis—the process termed “colonization 9.
To explain how cancer cells can migrate from a primary site to colonize specific distant sites to grow and from metastases, Stephen Paget 70 proposed the “seed and soil” hypothesis more than a century ago. Paget proposed that the formation of metastasis depends both on the properties of the tumor cells (seed) as well as the permissive role of environment (soil) at the distant site 8. The Metastasis formation is a multifactorial process that dictate how cells migrate, survive, and proliferate in “foreign” environments, as well as on the cellular and cytokine profile of the tissue from which the cells initially egress and of the cytokine and cellular composition of the tissue(s) to which the cells home to form a metastasis 14.
1.4.1 E
PITHELIAL TOM
ESENCHYMALT
RANSITION(EMT)
Epithelial-to-Mesenchymal Transition (EMT) was first recognized as a feature of embryogenesis, which is vital for morphogenesis during embryonic development. Recently it has also been implicated in the conversion of early stage tumors into invasive malignancies 15, 72, 73, 74.
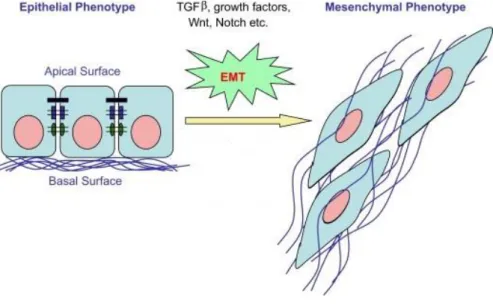
Increasing evidence suggests that tumor progression involves the acquisition of an EMT phenotype, which allows tumor cells to acquire the capacity to infiltrate surrounding tissues, and to metastasize to distant sites. Progression of most carcinomas is associated with the acquisition of mesenchymal phenotype, which is accompanied by the loss of epithelial marker expression and up-regulation of mesenchymal molecular markers 15, 16. Thus, EMT is a transcriptionally regulated process characterized, at the tumor cell level, by a decrease in epithelial markers such as down-regulation and relocation of E-cadherin, loss of cell-cell adhesion, apical-basal polarity, actin cytoskeleton reorganization as well as down-regulation and translocation of β-catenin from the cell membrane to nucleus 15, 17, and acquisition of mesenchymal markers such as vimentin, fibronectin and N-cadherin associated with as increase in cell motility and invasion capacity 18, 19, 20.
Epithelial cells form a sheet or layers of cells that are tightly connected laterally by specialized junction structures, including adherent junctions, desmosomes, tight junctions, and gap junctions. Among these, adherent junctions play a particularly
Introduction
8
important role in assembling and constructing lateral cell-cell adhesions in epithelial cell sheets. Epithelial cells establish an aligned apical-basal polarity through their association with a lamina layer at their basal surface, often called the basement membrane16. In contrast to epithelial cells, mesenchymal cells exhibit a front-back end polarity and rarely establish direct contacts with neighboring mesenchymal cells 21. Unlike epithelial cells, mesenchymal cells can invade as individual cells through ECM constructed by epithelial sheets and by mesenchymal cells themselves (Figure 3) 16, 17, 21.
Figure 3| Epithelial-to-mesenchymal transition (EMT). EMT occurs when epithelial cells lose their epithelial cell characteristics, including dissolution of cell–cell junctions, and acquire a mesenchymal
phenotype, characterized by cell skeleton reorganization 22.
The EMT program is activated at multiple steps of embryonic development to enable the conversion of various types of epithelial cells into mesenchymal cells. The activation of EMT, however, does not necessarily represent an irreversible commitment of cells to different lineages. Thus, the reverse program, termed Mesenchymal-Epithelial Transition (MET), also occurs both during embryonic development and during several pathological processes and is believed to be involved in the establishment of metastases. The reversibility of EMT underscores the enormous plasticity of certain embryonic and adult cells that participate in disease pathogenesis 16, 21.
Introduction
9
1.5
N
OTCH-D
ELTAS
IGNALINGP
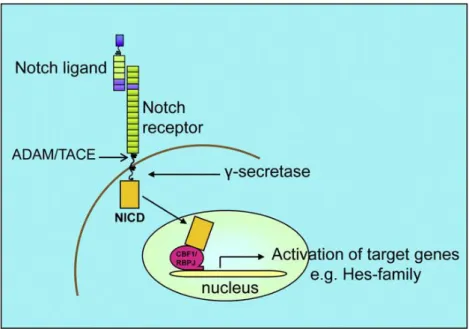
ATHWAYThe Notch-Delta signaling pathway is an evolutionarily conserved signaling pathway that is required for embryonic development, the regulation of tissue homeostasis, and the maintenance of stem cells in adults. It is among the most commonly used communication channels in animal cells 1. Notch pathwayhas multiple roles in cell fate specification, tissue patterning, and morphogenesis through effects on differentiation, proliferation, survival, and apoptosis 43, 41, 28. In mammals, there are five canonical DSL (Delta, Serrate, LAG-2) ligands: Delta-like 1 (Dll1), Delta-like 3 (Dll3), Delta-like 4 (Dll4), Jagged-1 (Jag1), and Jagged-2 (Jag2). These ligands are type I cell-surface proteins with multiple tandem Epidermal Growth Factor (EGF) repeats in their extracellular domains 4. DSL ligand bind to Notch receptors, which are single-pass, type I transmembrane receptors. In mammals, there are four Notch receptors, Notch 1 to Notch 4. Binding of a DSL ligand to the extra cellular domain of Notch receptor triggers a series of proteolytic cleavages of Notch, first by a member of the disintegrin and metalloproteases (ADAM) family within the juxtamembrane region, followed by gamma-secretase within the transmembrane domain. The final cleavage releases the Notch intracellular domain (NICD) from the cell membrane, which translocates to the nucleus and directly interacts with the transcription factor CSL (CBF1/RBPjk/Su(H)/Lag-1) 28, 44, 42, 7 (Figure 4).This binding converts CBF1 into a transcriptional activator, which leads to transcription of target genes 7. In the absence of NICD, CSL represses transcription through interactions with a corepressor complex that contains a histone deacetylase 7, 45. Binding of the NICD to CSL displaces the corepressor complex and replaces it with a transcriptional activation complex that includes the NICD, Mastermind-like (Mam1), and histone acetyltransferase to turn on the expression of Notch target genes such as the basic helix-loop-helix proteins Hairy/Enhancer of Split (Hes), Hes-related proteins, and Notch regulated ankyrin repeat protein (Nrarp). Proteins encoded by the Hes and Hey genes are, in turn, transcriptional repressors of both their own expression and further downstream genes 46.
Introduction
10
Figure 4| Schematic representation of the Notch-Delta signalling pathway. Binding of the Notch ligand to the membrane-bound Notch receptors leads to a sequence of proteolytic events resulting in cleavage of the Notch extracellular domain by the ADAM protease, followed by cleavage of the intracellular
domain by Ƴ-secretase 7.
1.5.1 R
ECEPTORS ANDL
IGANDS OF THEN
OTCH PATHWAYBoth the Notch receptor and its ligands, Delta and Serrate (known as Jagged in mammals), are transmembrane proteins with large extracellular domains that consist primarily of epidermal growth factor (EGF)-like repeats 28, 66.
Notch is a single-pass transmembrane receptor that can be activated by different transmembrane ligands. This receptors consist of a signal peptide and an extracellular domain that is responsible for ligand interaction 4, 29, 7. The mature Notch receptors is produced through a furin cleavage during biosynthesis. Notch extracellular domains contain 29-36 EGF repeats, 3 cysteine rich LIN repeats and a region that links to the transmembrane and intracellular fragment 28, 7.
Notch receptors have broad expression patterns in many tissues, but analyses of where cleavage occurs or where target genes are expressed reveal a limited profile of activation. The activity of the receptor must also be regulated through post-transcriptional mechanisms 28, 32.
The Notch ligands as well as Notch receptors, are transmembrane proteins that are characterized by an N-terminal DSL (Delta, Serrate and LAG-2) domain that is
Introduction
11 essential for interactions with the Notch receptor. The extracellular domains of the ligands contain varying numbers of Epidermal Growth Factor (EGF)-repeats 4, 7, 28.
The ligands are subdivided into classes. Delta or Delta-like (Dll) and Serrate (Jagged in mammals), depending on the presence or absence of a Cysteine Rich (CR) domain 28, 32. This ligand expressed on one cell binds to a Notch receptor expressed on neighboring cells that are in direct contact 7, 29, 30. Expression of Notch ligands during development is quite dynamic and contributes significantly to differential activity of the pathway. In some development contexts, the ligand is produced by a distinct population of cells 28, 31, 32.
There are at least five functional Notch ligands in vertebrates: 3 orthologs of the Drosophila Delta (Delta or Delta-like [Dll] 1, 3 and 4) and 2 of the Drosophila Serrate (Jagged1 and Jagged2). All ligands are able to interact with the Notch receptor and induced the second cleavage at the extracellular level. However, all ligands have different expression patterns and specific deletion/inhibition of specific ligands results in a very diverse outcome 4, 7, 32.
1.5.2
THEN
OTCHP
ATHWAY IN DISEASEDue to the importance of Notch signalling in embryonic and adult development, there are several human diseases linked to defects in the genes that are involved in Notch signalling (Table 1) 31, 66.
Mutations in the Notch signalling pathway cause developmental phenotypes that affect the liver, skeleton, heart, eye, face, kidney, and vascular system. Notch signalling associated disorders include the autosomal dominant, multi-system, Alagille Syndrome caused by mutations in both a ligand (Jagged 1) and receptor (Notch 2) and Autosomal Recessive Spondylocostal Dysostosis, caused by mutations in a ligand (Delta-like 3), as well as several other members of the Notch signalling pathway. Mutations in receptor Notch 3 cause the dominant adult onset disorder Cerebral Autosomal Dominant Arteriopathy with Subcortical Infarcts and Leukoencephalopathy (CADASIL), a vascular disorder with onset in the 4th or 5th decades 32, 33.
Another very serious condition caused by deregulation of Notch signaling activity is T-cell linked acute lymphoblastic leukaemia, when mutations are of the receptor Notch 1 or Notch 3 31, 32, 33.
Introduction
12
Table 1| Diseases caused by altered Notch signalling.
Disease Symptoms Cause
Alagille syndrome
Kindney, eye, heart and skeleton developmental problems and also defects in bile duct formation leading to liver problems.
Mutations on the Jagged 1 gene
CADASIL syndrome
Autosomal vascular disorder linked with a variety of symptoms ranging from migraines to premature death.
Mutations on Notch 1 and 3
T-cell acute lymphoblastic
leukaemia
Aggressive tumor derived from T-cell progenitor due to
increased Notch signalling activation.
Mutations involving either the Notch
heterodimerization domain or the PEST domain. Translocation of a truncated from of Notch resulting in signalling hyperactivation Spondylocostal
dysostosis (SD)
Rib defects causing abnormalities in vertebral segmentation and trunk size.
Mutations in Delta-like 3
1.4.3 N
OTCH PATHWAY IN CANCERMutations in the Notch pathway often lead to tumorigenesis. An interesting aspect of the Notch pathway are its apparently opposite functions in tumor development, because it can act as an oncogene or as a tumor suppressor 30, 33.
Notch signalling activity depends on signal strength, timing, cell type, and context. The results of altered Notch signalling depends on its normal function in a given tissue. Notch thus acts as an oncogene if its normal function acts as a regulator of precursor cell fate; however its tumor suppressor activity is detected in tissues in which Notch signalling initiates terminal differentiation events 30, 33. Table 2 summarizes the involvement of abnormal Notch signalling in cancer.
Introduction
13 Table 2| Abnormal Notch signalling in turmorigenesis.
Tumor type/process Function
Hematological tumors
T-cell malignancies (T-ALL) Oncogenic Notch signalling B-cell malignancies Oncogenic Notch signalling
Solid tumors
Breast cancer Oncogenic Notch signalling and
Tumor suppressive Notch signalling
Gut cancer Oncogenic Notch signalling
Skin cancer
Keratinocyte-derived carcinoma Tumor suppressive Notch signalling Skin cancer
Melanocyte-derived carcinoma Oncogenic Notch signalling
Cervical cancer Tumor suppressive Notch signalling
With the possible exception of some human epidermal malignancies, Notch signalling inhibition is a viable strategy for treatment of certain solid and hematopoietic tumors 30, 33.
1.6
O
BJECTIVES OF THIS THESISThe goal of this thesis was to study the factors that regulate the expression of Jagged-2 on hematopoietic, bone marrow derived cells.
In order to achieve this main objective we specifically proposed to:
1. Study peripheral and cord blood mononuclear cells from healthy individuals in order to define a profile of Jagged-2 expression on normal hematopoietic circulating cells.
2. Test whether putative tumor factors are involved in the regulation of the expression of Jagged-2 by in vitro assay.
In summary, with this study we expected to gain a better insight into the mechanisms involved in the regulation of Jagged-2 expression.
15
Materials and Methods
17
2.1
S
AMPLEC
OLLECTIONPeripheral blood (PB) samples from healthy patients were kindly donated by Instituto Português do Sangue (IPS), Lisbon, Portugal. Cord blood (CB) samples were collected according to informed consent and following the guidelines from Hospital Santa Maria, Lisbon, Portugal from Doctor Diana Martins. PB and CB samples were collected in buffy-coat with EDTA to a total volume of 70 ml in sterile conditions.
Samples were diluted in Phosphate Buffer Saline (PBS) (1:1). PB mononuclear cells and CB mononuclear cells were isolated according to the manufacturer’s protocol.
2.2
I
SOLATION OF MONONUCLEAR CELLSPB and CB samples were centrifuged at 2000 rpm for 20 minutes at Room Temperature (RT) to separate the PBMC’s from erythrocytes and granulocytes through Ficoll (LymphoprepTM). This method allows the separation of cells according to density of the cells.
The remaining fraction was lysed using 50 ml of Red Cell Lysis Buffer (RCLB), for 15 minutes at RT. The resulting mononuclear cell fraction was washed in PBS + 1% BSA and used for further analysis.
Assessment of cell viability was performed by Trypan blue exclusion method, using a BÜrker hemocytometer.
2.3
C
ELL CULTUREIn this work, two mammalian cell lines derived from peripheral blood were used. Jurkat cell line (ATCC – TIB-159) has a lymphoblastic morphology and was grown in RPMI 1640 Medium (Gibco) supplemented with 10% FBS, L-glutamine and antibiotic. On the other hand, THP-1 cell line (ATCC – TIB-202) has a monocytic morphology and was grown in RPMI 1640 Medium (Gibco) supplemented with 10% Fetal Bovine Serum (FBS), L-glutamine and 1% Streptomycin/penicillin.
Both cells lines were maintained in a 5% CO2 humidified incubator at 37ºC. The concentration of cells was maintained between 5 x 10⁵ and 1 x 10⁶ viable cells/ml. Cells in exponential growth phase were plated and ressuspended in fresh growth medium (RPMI) at 37ºC. After centrifugation, the supernatant was discarded and the cellular pellet ressuspended in 1 ml of freezing medium (FBS + 10% DMSO) and transferred to
Materials and Methods
18
criotubes. Tubes were maintained at -80ºC. All media and supplements were purchased from Invitrogen.
2.3.1 V
IABILITYViability was determined using trypan blue method. Trypan Blue is a vital dye. The reactivity of trypan blue is based on the fact that the chromopore is negatively charged and does not interact with the cell unless the membrane is damaged. Therefore, all the cells which exclude the dye are viable.
2 µl of trypan blue were used for 10 µl of sample. Cells were routinely counted
manually with a BÜrker hemocytometer. This procedure was repeated for all time points and during cell growth.
2.3.2 I
N VITRO ASSAYSJurkat cells (1x10⁶ cells/ml) were incubated in 9-well plates in the presence or absence of FBS in a total volume of 5 ml of medium (RPMI) at 37ºC ,5% CO2. Cells were harvested at 24h, 48h and 72h and analyzed by FACS and qRT-PCR.
These cells (1x10⁶ cells/ml) were incubated with 100 µM and 200 µM CoCl 2 in a total volume of 5 ml of RPMI in 9-well plates at 37ºC, 5% CO2. Cells were harvested at 24h, 48h and 72h and analyzed by FACS and qRT-PCR. This in vitro assay is used to test the effect of hypoxia.
2.4
RNA
EXTRACTIONRNA was extracted using TRIzol reagent® (Sigma) method. TRIzol reagent® maintains the integrity of the RNA, while disrupting cells and dissolving cell components during sample homogenization or lysis.
All the samples were centrifuged and the supernatants were discarded. Pellets were frozen in TRIzol reagent and stored at – 80ºC. Tubes containing cells and TRIzol were thawed on ice and 100 µl of chloroform (0,2 µl of chloroform per 1 µl of TRIzol) were added. The mixture was centrifuged at 13200 rpm for 20 minutes at 4ºC. The top aqueous phase of each tube, containing the RNA, was transferred to new tubes, mixed with 250 µl isopropanol (0,5 µl per 1 µl of TRIzol), and kept overnight at -20ºC.
Materials and Methods
19 After 24h the tubes were centrifuged at 13200 rpm for 20 minutes at 4ºC to precipitate the RNA. Supernatants were discarded and the pellets were washed with ethanol 80%. Pellets were ressuspended in DEPC-treated water and quantification was performed on NanoDrop 1000 (Thermo Scientific) spectrophotometer.
2.5
CDNA
SYNTHESISThe cDNA for quantification of transcripts was synthesized from 500 ng of total RNA using Random Hexamers, dNTPs 10 mM and DEPC-treated water up to 12 µl. Tubes were incubated at 65ºC for 5 minutes and a mixture containing First Strand Buffer, DTT 0,1 M and RNAse Out was added. Tubes were incubated at 25ºC for 2 minutes, and then 1 µl of SScript enzyme was added, and incubated at 25ºC for 15 min, followed by 50 min at 42ºC and 15 min at 70ºC. Reagents and respective quantities are listed in Annex 1.
2.6
Q
UANTITATIVER
EAL-T
IMEP
OLYMERASEC
HAINR
EACTION(
QRT-PCR)
Levels of mRNAs were measured by qRT-PCR using Viia 7 System (Applied Biosystems) and SYBR-Green fluorescent dye in 384-well plates. This method allows both the amplification and quantification of a housekeeping gene, obtained through light emission of a fluorescent dye that intercalates into the DNA. Relative expression was calculated using relative quantification (2^(-∆Ct)). The housekeeping gene used to normalize human samples was 18s. Amplification reaction mixture contains SYBR-Green, water, 0,15 μl of both forward (FWD) and reverse (REV) primers, followed by addition of 2 μl of cDNA template per well. qRT-PCR data were analyzed by Viia 7 TM software (Applied Biosystems).Sequences of the primers used in this study are listed in Annex 2 while reagents and their respective quantities are listed in Annex 3.
2.7
F
LOWC
YTOMETRY5x105 cells from each time point were blocked for 10 minutes at 4ºC with FcR fragment (1:100 dilution) for reduction of non-specific reactions. Cells were then incubated with Jagged-2 antibody (PE anti-human Jagged-2, 346903 BioLegend) in a 2,5:100 dilution in PBS+BSA 0,5% for 45 minutes in the dark, with rotation, at 4ºC.
Materials and Methods
20
The PB and CB mononuclear cells were stained with different antibodies (CD11b, CD45, CD34, CD19 and Jagged-2). The same procedure was used. Briefly, 5x10⁵ cells were blocked for 10 minutes at 4ºC with FcR fragment in a 1:100 dilution and then incubated with anti-CD11b (APC), anti-CD45 (PerCP), anti-CD19 (FITC), anti-CD34 (FITC) and Jagged-2 (PE). The antibodies were diluted in PBS+BSA 0,5% for 45 minutes in the dark with rotation at 4ºC.The list of antibodies description, respective dilution and fluorochrome are in Annex 4.
Flow cytometry was performed on FACSCalibur and analyzed with FlowJo 8.7 Software.
2.8
S
TATISTICALA
NALYSISAll data analysis was performed using Microsoft™ Office Excel and Graphpad® Prism 5.0 software.
Results are expressed as mean ± standard error and the statistical significance was determined using Student’s T test. In all comparisons, the significance level to reject the null hypothesis was 5%, that is, p values < 0.05 were considered statistically significant.
21
Results
Results
23
3.1
M
AINTENANCE OF MONONUCLEAR CELLS IN DIFFERENT CONDITIONSIn order to understand how circulating mononuclear cells may be maintained without compromising cell staining, various in vitro assays were performed and then the cells were analyzed by flow cytometry. The aim of these experiments was therefore to assess the time frame during which cell staining against Jag2, for instance, is not compromised. Assays were performed in duplicate and data is presented as mean and standard deviation.
3.1.1 S
TANDARDM
EDIUMC
ULTUREAfter PBMCS cells were isolated they were incubated in RPMI medium at 37ºC for 24 hours.
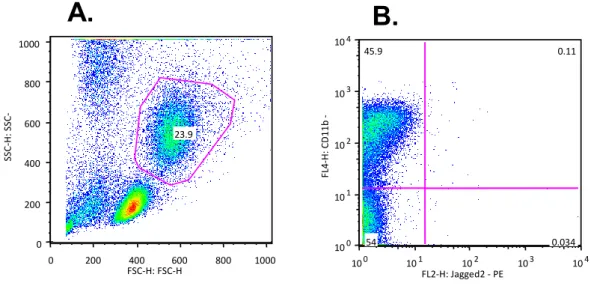
In Figure 5 it is possible to observe that the CD11B cells gown in RPMI medium have approximately 45% of staining, and therefore are logically alive after 24 hours. However, Jagged-2 expression is not significant like it was expected.
Figure 5| PBMCs in culture expressed CD11b/Jagged2 by flow cytometry. Percentage of CD11b+Jagged2+ cells in the mononuclear cell fraction of PB samples in culture of RPMI medium, by flow cytometry. A) Total population of PBMCs staining with anti-CD11b and anti-Jagged2, presented to the linear scale FSC and SSC. B) Population of PBMCs staining with anti-CD11b and anti-Jagged2, presented to the logarithmic scale Jagged2 and CD11b, where approximately 45% of PBMCs expressing CD11b.
0 200 400 600 800 1000 FSC-H: FSC-H 0 200 400 600 800 1000 SSC -H: S SC -H 23.9 10 0 10 1 10 2 10 3 10 4 FL2-H: Jagged2 - PE 100 10 1 10 2 10 3 104 FL 4 -H: CD 1 1 b -A PC 45.9 0.11 0.034 54
A.
B.
Results
24
3.1.2 PFA
FIXATIONPBMCs were fixed with paraformaldehyde (PFA) after isolation for 24h at 4°C in RPMI medium with 4% PFA and then stained for CD11b and Jag2, as described above.
The results show that cells fixed with 4% PFA fail to express the antigen CD11b (expressed on monocytes) (Figure 6) and also Jag2 is no longer detectable.
Figure 6| PBMCs fixed with 4% PFA expressed CD11b/Jagged2 by flow cytometry. Percentage of CD11b+Jagged2+ cells in the mononuclear cell fraction of PB samples when incubated with 4% PFA, by flow cytometry. A) Total population of PBMCs staining with anti-CD11b and anti-Jagged2, presented to the linear scale FSC and SSC. B) Population of PBMCs staining with anti-CD11b and anti-Jagged2, presented to the logarithmic scale Jagged2 and CD11b.
3.1.3 PBS
An alternative way of maintaining the PBMCs integrity was to incubate cells with PBS 1x following isolation at 4ºC during 24h. The results show that cells maintained in PBS express CD11b consistently, although Jag2 expression is almost undetectable (Figure 7). 100 101 102 103 104 FL2-H: Jagged2 PE 100 101 10 2 10 3 10 4 F L 4 -H : Cd 1 1 b APC 0 0.04 0.16 99.8 0 200 400 600 800 1000 FSC-H: FSC-H 0 200 400 600 800 1000 SSC -H: S S C -H 90 24.6
A.
B.
Results
25 Figure 7| PBMCs in PBS expressed CD11b/Jagged2 by flow cytometry. Percentage of CD11b+Jagged2+ cells in the mononuclear cell fraction of PB samples incubated with PBS 1x, by flow cytometry. A) Total population of PBMCs staining with anti-CD11b and anti-Jagged2, linear scale FSC and SSC. B) Population of PBMCs staining with anti-CD11b and anti-Jagged2, presented to the logarithmic scale Jagged2 and CD11b, where approximately 50% of PBMCs expressing CD11b.
3.2
CD11
B ANDJ
AGGED-2
EXPRESSED IN PERIPHERAL BLOOD3.2.1
FLOW CYTOMETRY RESULTSTo study the expression of Jagged-2 in peripheral blood cells by flow cytometry the cells were co-stained with anti-CD11b since we had previously shown this was the main source of Jagged-2 in circulating cells.
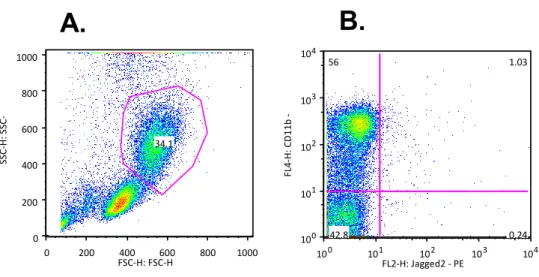
A total of 5 peripheral blood samples were used for this analysis (n = 5 buffy coat samples, kindly donated by the “Instituto Português do Sangue”). The PBMCs were isolated by Ficoll - Lymphoprep method (described in Materials and Methods) and then the cells were stained with two antibodies (CD11b and Jag2). It was possible to verify the presence of monocytes (± 30%) in peripheral blood of every sample, although the number of Jagged2 or CD11b/Jag2 positive cells was almost non-existent (Figure 8).
Assays were performed in triplicate and data is presented as mean and standard deviation. 0 200 400 600 800 1000 FSC-H: FSC-H 0 200 400 600 800 1000 SSC -H: S SC -H 34.1 10 0 10 1 10 2 10 3 10 4 FL2-H: Jagged2 - PE 100 101 102 10 3 10 4 FL 4 -H: CD 1 1 b -A PC 56 1.03 0.24 42.8
A.
B.
Results 26 Sam ple 1 Sam ple 2 Sam ple 3 Sam ple 4 Sam ple 5 0.00 0.02 0.04 0.06 0.08 0.1 0.2 0.3 0.4 0.5 20 30 40 50 60 CD11b Jag2 CD11b/Jag2 Sample of PB % m o n o n u cl e ar c e lls in P B
Figure 8| Mononuclear cells stained (CD11b and Jag2) present in PB. Flow cytometry based quantification of CD11b+Jag2+; CD11b+ and Jag2+ percentage in PB. Data are means ± s.d.
The results show that between 30 to 50% of monocytes is found in normal peripheral blood samples. The percentage of cells expressed Jagged-2 is extremely low or almost non-existent following this methodology.
3.2.2
QRT-PCR
RESULTSTo further study the expression of Jagged-2 in peripheral blood at the mRNA level, qRT-PCR was used. For this purpose, mRNA was extracted from the same samples used in Flow cytometry (n=3).
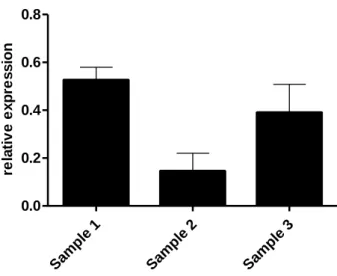
The data shows that Jagged-2 is detectable at the mRNA level with varying results (Figure 9).
Results 27 Sam ple 1 Sam ple 2 Sam ple 3 0.0 0.2 0.4 0.6 0.8 re la ti v e e x p re s s io n
Figure 9| Jagged2 expressed in peripheral blood mononuclear cells. Quantification of the samples that expressed Jagged2. Data are means ± s.d.
3.3
CD11
B ANDJ
AGGED-2
EXPRESSED IN UMBILICAL CORD BLOOD SAMPLESIn the latest years, the function of Notch in embryonic hematopoiesis has been extensively studied. However the activity of all Notch ligands it is still unclear. 47, 48, 49.
Given the accessibility and therapeutic potential of cord blood samples, next we studied the expression of the CD11b and Jagged 2 in human umbilical cord blood. These experiments aimed at demonstrating the levels of Jagged2 expressing cells in normal blood samples.
3.3.1
FLOW CYTOMETRY RESULTSA total of 4 samples of Human umbilical cord blood samples (n=4) were collected for isolation of mononuclear cells. The mononuclear cells of the umbilical cord bloods were isolated by Ficoll - Lymphoprep method (described in chapter 2) and the mononuclear cells were stained with two antibodies (CD11b and Jag2).
Assays were performed in triplicate and data are presented as mean and standard deviation (Figure 10).
Results 28 Sam ple 1 Sam ple 2 Sam ple 3 Sam ple 4 0 10 20 30 40 CD11b Jag2 CD11b/Jag2 Sample of CB % m o n o n u c le a r c e ll s i n C B
Figure 10| Mononuclear cells stained (CD11b and Jag2) present in CB. Flow cytometry based quantification of CD11b+Jag2+; CD11b+ and Jag2+ percentage in CB. Data are means ± s.d.
In contrast to the peripheral blood samples, in the umbilical cord blood there is an important proportion of cells stained both for CD11b and for Jagged-2 (CD11b/Jagged2). Despite some inter-sample heterogeneity, our results clearly demonstrate cord blood samples have an important proportion of CD11b monocytes/myeloid cells that expresses Jagged-2.
3.3.2
QRT-PCR
RESULTSThe mononuclear cells obtained from the cord blood samples were used to extract mRNA (described in chapter 2) to determine the expression of Jagged-2 at the mRNA level.
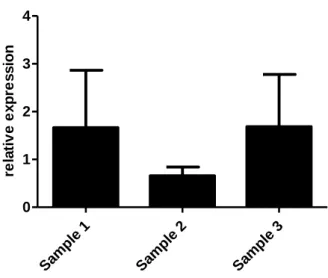
Similarly to what was obtained from the peripheral blood samples, our data shows the cord blood mononuclear cells express Jagged-2 at varying levels (Figure 11).
Results 29 Samp le 1 Samp le 2 Samp le 3 0 1 2 3 4 re la ti v e e x p re s s io n
Figure 11| Jagged2 expressed in peripheral blood mononuclear cells. Quantification of the samples that expressed Jagged2. Data are means ± s.d.
3.4
J
AGGED-2
EXPRESSION ON LEUKEMIA CELL LINESThe expression of Jagged-2 were analysed in a malignant cellular context. For this purpose, were cultured and studied leukemia cell lines. The purpose of these experiments was to determine the expression of Jagged-2 on malignant circulating mononuclear cells and also to establish an in vitro model to test putative signals that might regulate Jagged-2 expression. We started by isolating mRNA from 3 different leukemia cell lines and to assess the expression of Jagged-2 by qRT-PCR (Figure 12).
HL-6 0 THP1 HE L 0.0 0.1 0.2 0.3 0.4 0.5 10 20 30 40 re la ti v e 1 8 s
Figure 12| Jagged2 expressed in different cells. Quantification of the cells that expressed Jagged2 by RT-qPCR.
The data suggests that there are significant differences in the expression of Jagged-2 between the 3 cell lines studied. THP-1 cells have a higher expression of
Results
30
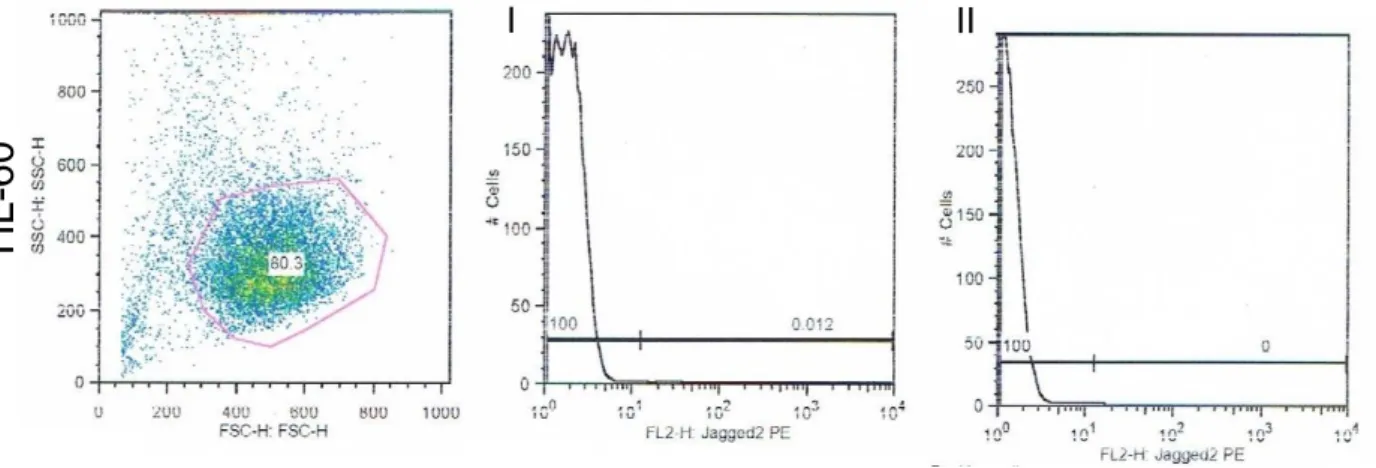
Jagged-2 (p=0,001). The same experiment was realized by flow cytometry, but the results obtained were either all negative or incoherent with the qRT-PCR (Figure 13 – A and - B). A) TH P-1 HEL H L-60 0.0 0.5 1.0 1.5 % c e ll s e x p re s s e d J a g g e d 2 B)
T
HP1
I
II
HEL
I
II
Results
31 Figure 13| Jagged2 expressed in different cells. A) Quantification of the cells that expressed Jagged2 by flow cytometry. B) Graph that quantifies the expression of Jagged2 obtained from FlowJo. I – unstained cells of the different cell lines. II – Stained cells of the different cell lines.
3.4.1 J
URKAT CELLS LINEGiven the heterogeneity and lack of reproducibility in Jagged-2 expression by the two leukaemia cell lines studied, we decided to use Jurkat cells, previously shown in the laboratory to clearly and consistently express Jagged-2. These cells were here cultured under different culture conditions and the effects of such conditions in cell survival and in Jagged-2 expression was assessed.
The cells were maintained in standard culture conditions until a volume of 1x10⁶ cells/ml was achieved. When this cell number was exceeded, cells were frozen at -80ºC or used for other tests (Figure 14).
I
II
HL
Results 32 0 1 2 3 4 5 6 7 8 9 10 11 12 13 14 15 16 17 0 20 40 60 80 100 120 140 160 180 200
Cells death
Cells survival
Days # o f c e ll s ( 1 x 1 0 ^ 4 )Figure 14| Jurkat cells survival under standard culture conditions.
The data shows standard culture conditions are adequate to maintain Jurkat cells in the same culture flask for up to 16 consecutive days. This allows the control of cell expansion from a single vial, thus reducing possible variations in gene expression in follow up experiments.
3.4.2 I
NFLUENCE OF THEFBS
IN CELL VIABILITYNext, Jurkat cells were subjected to different culture conditions and studied at different time points. In a volume of 3 ml with concentration 1 x 10⁶ viable cells/ml, the cells were incubated in the absence or presence of 10% FBS, during 24 and 48 hours (Figure 15 and 16A and B). Assays were performed in triplicate and data is presented as mean and standard deviation.
Our data shows the number of viable cells is reduced in the absence of FBS at the different time points (Figure 15).
Results 33 + FB S - FB S CoC l2 1 00µM CoC l2 2 00µM 0 10 20 30 40 50 60 70 80 90 100 110 120 130 0h 24h 48h 72h C e ll v ia b il it y (1 x 1 0 ^ 4 )
Figure 15| Effect of FBS and CoCl2 in Jurkat cells viability. Jurkat cells were incubated with different concentrations of CoCl2 and with presence or absence of FBS for 24h, 48h and 72h. Data is reported compared with control (0h) and represent the mean ± SD of experiment performed in triplicate.
3.4.3 I
NFLUENCE OF THEH
YPOXIA ON CELL VIABILITYAll the hypoxia-dependent events in cells appear to share a common denominator: hypoxia-induced factor (HIF), which is a heterodimer transcription factor 47, 48. When cells in vitro are treated with a well-characterized hypoxia mimicker cobalt chloride (CoCl2), intracellular changes are similar to those upon hypoxia 49, 50. Oxygen plays a key role in stabilizing HIF-1a and its function. When the oxygen tension is normal, 1a is rapidly oxidized by hydroxylase enzymes, but when cells become hypoxic, HIF-1a escapes the degradation and starts to accumulate, triggering the activation of a large number of genes 50, 51.
The Jurkat cells were submitted a different conditions, in different time points. In a volume of 3 ml with concentration 1 x 10⁶ viable cells/ml, incubated the cells with 100 µM and 200 µM of CoCl2 , during 24, 48 and 72 hours (Figure 15 and 16A and B). Assays were performed in triplicate and data are presented as mean and standard deviation. We found that CoCl2 exposure decreased Jurkat cells viability. Exposure to both concentration (100 µM or 200 µM CoCl2 from 24h), markedly decreased cell viability (Figure 15).
Results
34
3.4.4
E
FFECT OFFBS
ANDH
YPOXIA ONJ
AGGED-2
EXPRESSION BYJ
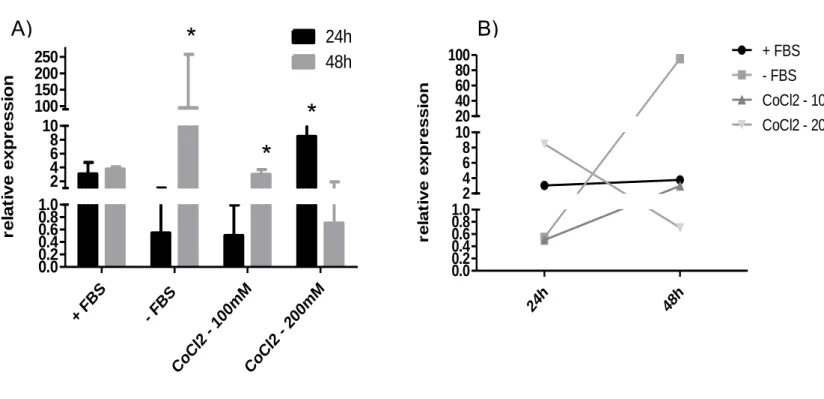
URKAT CELLSIn the presence of FBS the expression of Jagged-2 does not change over time, but as shown in Figure 16A, the absence of FBS showed a significant increase in the expression of Jagged-2 (p=0,37), at 48h. Moreover, Figure 16A also shows a significant increase in the expression of Jagged-2 (p=0,007) when the cells were cultured in the presence of 100 µM of CoCl2 for 24h and 48h. However, if cells were cultured in the presence of 200 µM CoCl2 for 48hrs, expression of Jagged2 was reduced.
Figure 16| Jagged 2 expression by Jurkat cells under different culture conditions. A)
Quantification of Jurkat cells cultured in the presence or absence of FBS, 100 µM or 200 µM of CoCl2 for
24h and 48h. B) Changes in the expression of Jagged2 after 24h and 48h under the different culture conditions by quantitative real-time PCR.
+ FB S - FB S CoC l2 - 100mM CoC l2 - 200mM 0.0 0.2 0.4 0.6 0.8 1.0 2 4 6 8 10 100 150 200 250
24h
48h
r e la ti v e e x p r e s s io nA)
*
*
*
24h 48h 0.0 0.2 0.4 0.6 0.8 1.0 2 4 6 8 10 20 40 60 80 100 + FBS - FBS CoCl2 - 100mM CoCl2 - 200mM r e la ti v e e x p r e s s io nB)
35