A Work Project, presented as part of the requirements for the Award of a Masters Degree in Management from the NOVA – School of Business and Economics.
PORTUGAL’S ROUTE TO NEUTRALITY: THE CHALLENGE OF HIGH SHARES OF VARIABLE RENEWABLE ENERGY
Duarte Lourenço Correia | 33501
A Project carried out on the Master in Management Program, under the supervision of: Prof. Antonieta Cunha e Sá
2 Abstract
This project examines the challenge of managing the Portuguese electric power grid, which will experience the installation of large amounts of solar and wind capacity and full coal phasing-out during the next decade. The Irena FlexTool is used to study the flexibility of the power grid in 2030 under different scenarios. We conclude that the variable renewable energy (VRE) expected installed capacity will frequently produce excessive energy supply, leading to high levels of curtailment. Hence, the power baseload price will decrease between 1% and 13% and investments opportunities between 30,1M and 71,3M (€ 2019) will be generated by 2030.
3 1. Introduction
Global warming is currently one of the main challenges facing humanity. According to the Intergovernmental Panel on Climate Change (IPCC), there is a 95% certainty that humans are the main cause of the acceleration of global warming. Despite the efforts to counteract it, the problem is still growing. We now live in an era in which the problem is generally recognized and to keep the global average temperature increase below 2ºC relative to pre-industrial levels (target decided on the Paris Agreement, in 2016), a combined effort of all stakeholders will be necessary.
The leading cause of global warming is the increase of greenhouse gases concentration in the atmosphere. Among these gases, those currently responsible for the largest negative impact are carbon dioxide (CO2) and methane (CH4). These gases are emitted by different
human activities, which can be grouped into key sectors, such as: energy, agriculture, transportation and industry.
There is a need to decrease these emissions, or to decarbonize, in all of these sectors. Specifically in the energy sector, there are already solutions available which, if implemented, could significantly reduce these harmful emissions. The transition towards “clean” energy sources is already underway and it will be strengthened in the years to come. The energy sector, being at the basis of the activities of all other sectors, is pivotal to the development of a sustainable future. A relevant trend to consider in this sector is the growth in energy demand. Energy companies face a very challenging endeavor because they need to meet a rising demand and at the same time reduce their carbon emissions (BP, 2019).
4 Since we all live on the same planet, it should be in the interest of all countries to contribute to this cause, but unfortunately that is not the reality and there are still huge gaps in terms of alignment of climate targets. Currently, Europe is leading the way in terms of political action and social awareness and almost all countries have some kind of climate targets defined, some of them even including deadlines to attain carbon neutrality, including Portugal. Becoming carbon neutral is defined as having net zero CO2 emissions
(CO2 Emissions – CO2 Capture = 0).
Portugal’s electrical grid is about to experience a structural change during the next decade, with the introduction of large amounts of solar and wind capacity. But how much flexibility will be left in the system after the installation of all the new variable renewable capacity planned and the phasing-out of all coal power plants and how will it affect the system’s operational costs?
The remainder of this thesis is organized as follows. Section 2 describes the Portuguese context in the transition towards a carbon-neutral economy, section 3 contains the theoretical framework on power systems flexibility, section 4 details how the system was modeled using the Irena Flextool, section 5 discusses the results of the analysis developed in section 4 and section 6 offers the conclusions of the thesis. Ancillary tables and figures and an Appendix containing relevant information on the utilization of the Flextool are included at the end of the thesis.
2. The Context
At the end of 2018, Portugal produced two very significant documents regarding the transition of the Portuguese economy to a low carbon economy: PNEC (Plano Nacional Energia e Clima) and RNC2050 (Roteiro para a Neutralidade Carbónica 2050). RNC2050
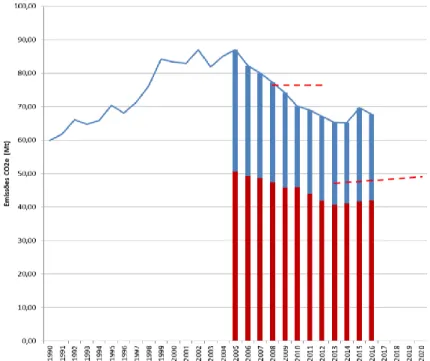
5 defines medium to long-term decarbonization targets for all sectors (energy, industry, buildings, transports, agriculture and residues) so that Portugal can achieve carbon neutrality by 2050. PNEC is more focused on the short and medium-term targets for the energy sector and it is the main political instrument guiding the evolution in this area for the following decade. It was developed by Portugal’s Ministry of the Environment and Energetic Transition. A final version of the PNEC is yet to be published, but the version used in this thesis is already very detailed with respect to Portugal’s targets. Until now, Portugal had an average performance in terms of compliance with its GHG emissions targets. Considering the Kyoto Protocol, signed in 1997, the country was able to lower its GHG emissions below the 2008-2012 target but it placed quite above the 2013-2020 target, not showing real signs of improvement since 2012, at least until 2016 (Figure 11). During this last period, Portugal went through an economic crisis, which hampered the reduction of GHG emissions. According to the EU goal of reducing 30% of Europe’s total GHG emissions by 2030, relative to 2005 levels, Portugal needs to reduce its emissions by, at least, 17% of its 2005 level of approximately 87 Mt of CO2e (Table 11). Being more
ambitious than the minimum requirements, Portugal set a 2030 target of 45% to 55% less GHG emissions relative to 2005, which would drop total emissions to around 39Mt of CO2e. Specifically in the energy sector, Portugal seeks to have, by 2030, 83% less GHG
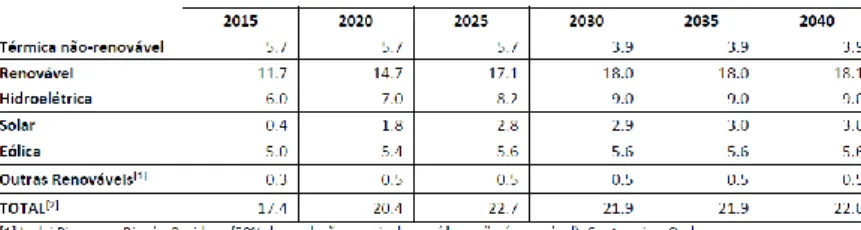
emissions relative to 2005, making it the sector with the largest emissions reduction. (Table 21). To achieve these targets in the next decade, new renewable capacity is expected to be installed, mainly solar and wind, while coal capacity will be fully phased-out, represented in Figure 2, in the next page.
1 Page 23.
6 In the PNEC, two main scenarios are identified: the Existing Policies Scenario and the Stated Policies Scenario (Table 3 & Table 42). To predict the installed capacity in 2030, the Stated Policies Scenario uses two ranges of values, one more conservative (-) and another less conservative (+), predicting less and more VRE capacity being installed, respectively. Due to the lack of information on the expected installed capacity of non-renewable thermal in the Stated Policies scenario, it is assumed that this value is the same as in the Existing Policies Scenario, 3,9 GW (PNEC, 2018). The increase of renewable capacity would also allow for the better harnessing of endogenous resources, thus reducing Portugal’s energy dependence. Portugal performs quite poorly in this area, currently occupying the fourth worst position in European Union in 2017, depending about 80% on imports to fulfill its energy demand (Figure 32). According to PNEC, it aims to reduce this dependency to 65% by 2030 (PNEC, 2018).
3. Brief Comments on the Flexibility of Future Power Grids
Concerning the work already developed on the subject of power systems flexibility, it seems that the PNEC will definitely create disruptions in the system, since “market will
2 Page 24.
Source: Author, using data from PNEC, 2018
7 “cope” [with high shares of renewables] to the extent that markets in the electricity supply industry serve the interests of policy rather than drive it.” (Pollitt, Michael & Anaya, Karim, 2016, p. 85). When planning future power systems, economic costs associated with the deployment of power generation coming from variable renewable sources should be fully accounted for, and the increase in the system balancing costs are not negligible, since “the variability and uncertainty associated with VRES-E generation implies real-time deviations in renewable power generation, explained by its non-full predictability, affect daily markets and result in higher balancing costs and greater fluctuation in the reserve requirements.” (Batalla-Bejerano, J. & Trujillo-Baute, E., 2015, p. 8). The efforts to mitigate climate change are pressing governments, which struggle to accommodate high shares of renewables. “In Spain, […] Although the system has more than 25 TW of installed capacity using combined cycle, the fall in electricity demand as well as a growing share of the renewable in the demand means that a very small part of this power is connected to the network when the system requires it.” (Batalla-Bejerano, J. & Trujillo-Baute, E., 2015, p. 8) The difficulty in reallocating production from renewable sources to hours of less availability will eventually result in a decrease in the market value of renewables in systems with high shares of renewables, “thereby upholding high growth rates for renewables. […] Thus, if the target is an energy system that is completely based on renewables, then the most difficult stages of the energy transition may still lie ahead, even if capacity costs of renewables continue to fall sharply.” (Helm, C. & Mier, M., 2019, p. 24).
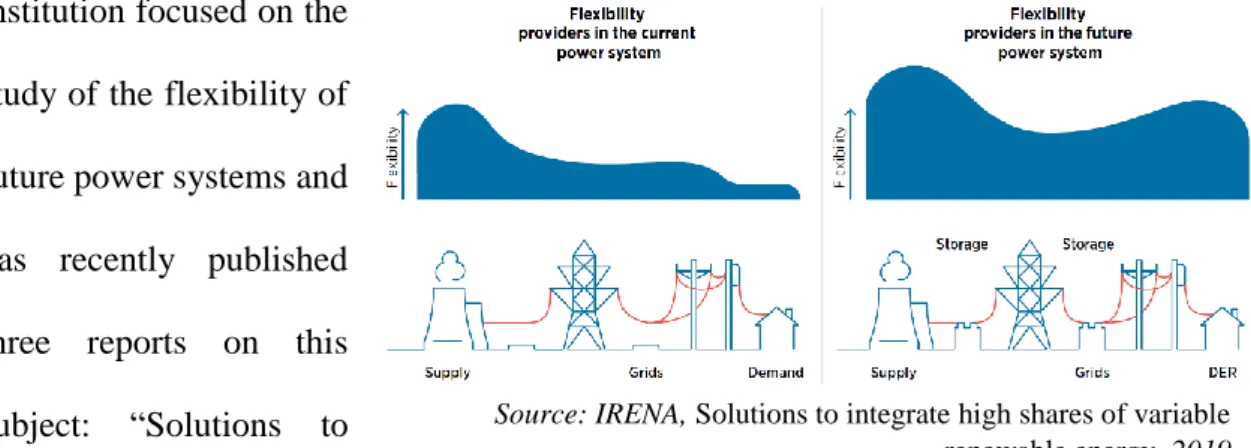
8 IRENA is a key
institution focused on the study of the flexibility of future power systems and has recently published three reports on this subject: “Solutions to
integrate high shares of variable renewable energy” (2019) and “Power System Flexibility for the Energy Transition, Parts 1 & 2” (2019), from which most of the theoretical framework following my thesis in based. The generally accepted solution to reduce GHG emissions in the energy sector involves the substitution of dirty thermal non-renewable technologies by clean renewable ones. In the medium to long term, the main sources for this transition will be solar and wind technologies. Since these are non-dispatchable, it makes it difficult to balance supply and demand. It is expected that by 2050 solar and wind power account for three fifths of the global energy generation (REN21, 2019). There are already some solutions to overcome the unpredictability of this kind of technologies, but none of them is enough by itself, so a combination of different solutions must be used in order to make the system reliable (IRENA, 2019). The whole supply chain needs to become more flexible to fluctuations of supply and demand. Until now, power systems have relied heavily on the ability of ramping up or down production units, very early in the chain, but to accommodate all the unpredictability to come, flexibility in the transmission, distribution and demand phases also needs to be developed.
Figure 4 – Flexibility in current and future power systems
Source: IRENA, Solutions to integrate high shares of variable
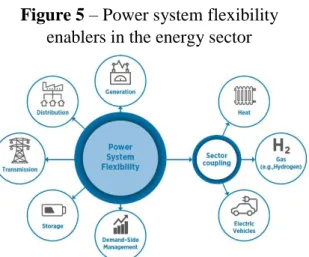
9 Another very effective way to increase system flexibility is to increase the connection to other sectors that can supply or consume energy, such as the growing hydrogen sector or the electrical vehicles fleet.
Innovation, the key tool behind human evolution, will be key in the process of increasing system flexibility. IRENA identified three main innovation trends in the power sector: Electrification, Decentralization and Digitalization. These can be combined to generate innovations in different dimensions, namely the
technological, from which it could be highlighted the utility scale batteries, power-to-X solutions or smart grids. Still in this realm, it is also expected that wind and solar forecasting tools will continue to improve, allowing for a better management of reserves and prediction of power production output. However, this kind of innovation alone will not satisfy the full flexibility needs in the future. There are also new business models opportunities that must be developed, such as the role of an aggregator, who bundles distributed energy resources through enhanced communication, control and automated smart contracts, based on blockchain technology. Even the market design itself needs to be renovated, for example with continuous intra-diary power markets. Portugal is part of the XBID (Cross-Border Intraday Market Project), which aims to achieve that goal3 (PNEC, 2018). Finally, the system operations too will go through changes and in the near
3 Another very simple, yet effective solution could be allowing negative prices in the electricity market.
Source: IRENA, Solutions to integrate high
shares of variable renewable energy, 2019 Figure 5 – Power system flexibility
10 future the concepts of virtual power plants (virtual aggregation of production units) or virtual power lines might become common.
4. IRENA FlexTool Model
To analyze the flexibility of Portugal’s power generation matrix, the IRENA FlexTool model was used.
4.1. The Model
The tool was developed by IRENA in 2018 with the objective of identifying flexibility gaps in the short term and to explore optimal investments to support system flexibility in the long run, for energy systems facing increases in shares of VRE (IRENA, 2018). The tool incorporates enough mathematical complexity to address important aspects of system flexibility while at the same time being less complex than advanced commercial packages used for utilities, consulting firms or other institutions (IRENA, 2018). Flextool is a linear programming and deterministic model that runs with the purpose of minimizing its objective function, consisting of all the costs involved in the operations of the power grid (Figure 64). The FlexTool is currently the only publicly and freely available tool that performs capacity expansion and dispatch with a focus on power system flexibility (IRENA, 2018). The model includes two modes that can be used either separately or together: the investment mode and the dispatch mode. The dispatch mode performs the optimal scheduling of power system operations while the investment mode proposes investments in various flexibility sources and other technologies. In this project only the dispatch mode was used because the investments in the electric system studied had to be developed outside the model. The tool can be used in various ways, among which we
11 find: study of the current electricity system under unexpected events (poor water year, high natural gas prices, etc.) and to identify flexibility shortages in an estimated generation mix in a future scenario and solving for the least cost flexibility options. In this project, we focus on the second, since the goal is to study the flexibility of the Portuguese electrical grid in 2030. The version of the FlexTool used is the 0.64.
4.2. Modeling 2018
In order to check whether the modeling capabilities can serve the purposes of this study, 2018 was modeled first, since it is the most recent year with full data available. For this kind of analysis, the model was run in dispatch mode and then the output data was compared to real data supplied by REN, for validation purposes.
In what concerns the input data, a copy of the template file was created and then modified to match the data from Portugal’s grid in 2018. In this input file there is a set of 12 worksheets: master, gridNode, unit_type, fuel, units, nodeNode, ts_cf, ts_inflow, ts_energy, ts_import, ts_reserves and ts_time. The process of sourcing and inserting the different values required in each of these worksheets is fully detailed in the Appendix.
4.3 Modeling 2030
For the study of the power grid flexibility in 2030, a scenario analysis was developed. Some scenarios analyzed the response of the different electrical systems planned in PNEC under baseline conditions, while others studied the impact of improving or adding elements to the grid. The chosen focus of the analysis is the production and distribution phases of the supply chain. Even though there are other types of solutions to improve flexibility, as mentioned in Section 3, this project focuses on the upstream and midstream phases.
12 The scenarios modeled were: the Existing Policies Scenario, the two Stated Policies Scenarios (2030(-) and 2030(+)), a dry year scenario, a utility-scale battery scenario and an increased export capacity scenario. A dry-year scenario, simulating a year with low hydro inflows, was developed because hydrologic availability considerably affects the Portuguese power production matrix and because the current trend is for weather to become drier, with more frequent and severe droughts due to climate change. A utility-scale battery scenario was also used, to evaluate the impact and feasibility of using batteries as power storage, at a large scale. Lastly, in order to study what would be the effect of increasing interconnection availability on the system flexibility, the increased export capacity was created. No scenarios were created where the capacity factors5 of wind or solar technologies were changed, because research on Portuguese and Spanish historical data showed that these were quite stable in previous years. The initial step was to make various copies of the input file for 2018 and update the required data. There were some differences common to all scenarios: CO2 cost, curtailment penalty, demand, costs
of technologies, coal phase-out and the price of natural gas. The cost of CO2 was updated
to 22,30 USD/MWh, based on the price predictions of the Oxford Institute for Energy Studies (Figure 76). According to PNEC, the power demand in 2030 in Portugal is expected to be 4474 ktoe, or 52033 GWh (Table 56), and since in 2018 the power consumption in Portugal was 52485 GWh, the growth rate in this time period is actually negative, at approximately -0,86%. This growth rate was used to estimate power demand, as well as the initial imports and exports in 2030 (further explanations ahead). The costs of the different technologies were mostly the same, with the exception of the fixed costs
5 Capacity Factor = Average Power Production of a Technology / Capacity Installed of that Technology 6 Page 25.
13 of hydro. The coal data were removed from the input files since full coal phase-out is expected in 2022, and no power is expected to be generated from this technology by 2030. The price of natural gas was estimated at 18,87€/MWh, based on natural gas futures currently quoting, CAL 2026 being the product with the longest maturity available (Figure 87). The price of biomass was kept the same as in 2018, due to lack of price forecasts for this fuel. For the purpose of analyzing the flexibility of the grid, it would not make a substantial difference if the wind power was sourced from onshore or offshore plants, so the whole wind capacity was assumed to be onshore. The amount of capacity allocated to hydro reservoir and hydro run-on-river8 was calculated so that the proportion between the two capacities would be the same as it was in 2018. The amount of hydro storage was also increased so that the share with respect to total capacity installed was maintained. The wind and solar profiles remained the same so the ts_cf sheet was not modified. In the ts_inflow sheet, the average monthly hydro inflows were inserted (Figure 97). Unfortunately the time range of the data used in the calculation of this inflow average is unknown. In the ts_energy and ts_reserves sheets, the same time series used for 2018, adjusted by the growth rate of the power consumption in Portugal of -0,86%, were used. Since the import/export values need to be introduced in the model as fixed values (limitation of the tool), they could only be updated after running the model with the different scenarios (initially with import/export values calculated by applying the demand growth rate to imports and exports of 2018), identifying at which time steps curtailment was occurring, and then maximizing the available export capacity in those periods. An export capacity of 3350MW was assumed, since it corresponds to the average of the
7 Page 26.
14 expected export values for 2030 (Table 79). For this process, data at every time step of the year had to be retrieved, thus all 8760 hours (full year) in the ts_time sheet were selected, increasing the average time to run the model to 30 minutes.
In terms of the specific data for each scenario, different curtailment penalties were
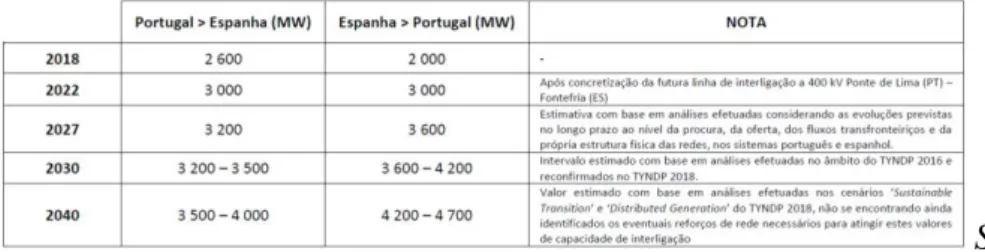
assumed, using predictions of the baseload price as proxies. These baseloads were calculated using averages of the hourly prices, where hours with power curtailment were assumed to be priced at 0 €/MWh. Moreover, the capacity of the different technologies had to be adjusted to each scenario: in the dry year scenario, the proxy used was the hydro production in 2017 (REN, 2019), a year markedly dry, resulting in 31% and 46% of the average hydro reservoir and run-on-river production, respectively; in the battery scenario, the 1600MW capacity of the battery was selected so that it would be equivalent to the current coal capacity and the storage capacity was calculated using a proxy for large scale storage from an IRENA report on utility-scale batteries, four times the power of the battery (6400MWh). In the increased export scenario, it was assumed that the export capacity from Portugal to Spain would be increased to 4000MW, which is the maximum planned value for 2040 (Table 79).
9 Page 27.
Source: Author, 2019
15 5. Discussion of results
Results for 2018: After running the model, the key values from the output file were organized and compared to the “Reality” results, constructed using the 2018 load diagram provided by REN (Table 9). Some similarities, as well as some differences, were found. In terms of similarities, excluding demand and exports, which were inserted, they are the following: the total share of variable renewable energy, as well as the wind, solar, hydro (reservoirs) and gas production. In terms of differences, the curtailment was significantly lower than the real one, as well as the hydro production from run-on-river and from biomass. The lack of production from the previously mentioned technologies was mostly offset by an increase in coal power production. The differences in the hydro run-on-river production could be explained by the maintenance of the infrastructure or by disparities in the hydro inflows, even though these were retrieved from REN’s data center. The lack of production from biomass can be due to the real cost of the fuel. Since the objective function of the model is cost minimization the biomass was considered uncompetitive from an economic perspective, when compared to its alternatives, coal and gas.
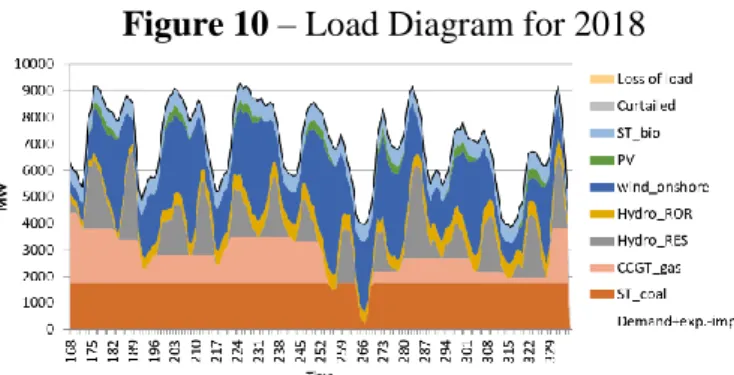
Figure 10 is one of the plots present in the results file, a load diagram with all the technologies producing power at every time step modeled.
Table 9 – Model Results for 2018 VS Reality
Figure 10 – Load Diagram for 2018
Source: Author, 2019
16 Despite the differences, the results are considered satisfactory and validate the adequacy of the model to study the 2030 grid. To analyze the grid’s flexibility in 2030, the most relevant value is the percentage of VRE used in power generation, the loss of load and the curtailment, for which the model outputs presented differences considered acceptable. Even though the relative differences in curtailment are large, the absolute values are not as significant.
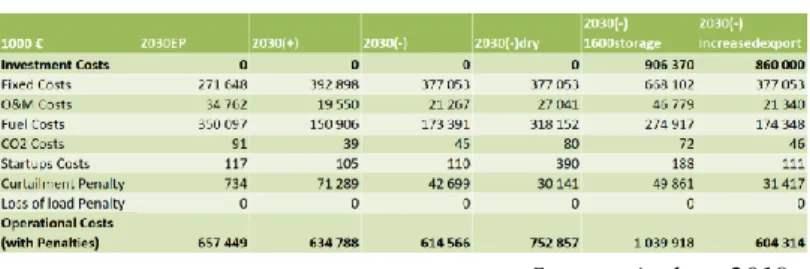
Results for 2030: With the several output files created from running all the scenarios, the most relevant data was organized in Tables 10 and 11. In terms of production, the share of VRE varies within a wide interval, ranging from 56% in the Existing Policies
Scenario to 89% in the 2030(+) Scenario. In terms of the CO2 emissions, the PNEC goal
of 1751 kton of CO2e in 2030 is never attained (Table 1210). The loss of load value is
always 0, thus demand is always met. In terms of power curtailment, there is always some, even in the Existing Policies Scenario. Biomass is only used as a source for power production in the dry year scenario. The reason why no biomass is used on the other scenarios is probably the same as the one for 2018, that is, related to the cost of the fuel. The costs were converted from USD to Euros and then the present value was calculated for Euros 2019, using an annual real interest rate of 3,92%, that is, the difference between
10 Page 27.
Table 10 – Model Results for 2030 | Production
Table 11 – Model Results for 2030 | Costs
Source: Author, 2019
17 the average of the long term interest rate (OCDE, 2019) and the average inflation rate between 2010 and 2019. The investment costs of new capacity installed in the Existing Policies scenario and both Planned Policies scenarios (2030(-) and 2030(+)) were ignored, as they were considered sunk costs. Looking at the costs of operation of the grid in each scenario, the most expensive year in terms of grid operation is the dry year and the cheapest one is 2030(-) which, relative to 2030EP, produces significant savings from fuel costs, by reducing dependence on thermal units, but at the same time presents higher fixed costs, due to the larger amount of installed capacity (wind and solar, mostly), offsetting the first effect. Curtailment penalties are substantial in all scenarios except for the Existing Policies, representing 4% to 10,8% of the operational costs of the grid, in the dry year and the 2030(+) scenario, respectively. The costs of installing the utility-scale lithium-ion batteries, using the proxy of 250 USD/KWh (Figure 1111), was estimated to be around 906M €. The cost of increasing the export capacity to Spain to 4000MW was estimated from the PNI (Plano Nacional de Investimentos). The budget for the development of the power interconnection points of Portugal during the next decade is 860M € euros of what year (PNI, 2019). Since the export capacity expected in 2040 is roughly double the capacity expected in 2030 (Table 711), the value of 860M € was used as the additional investment required at the interconnection point. Given that the increase in interconnection capacity between European countries, namely between Iberian Peninsula and the central Europe, was mentioned in the recent presentation of the objectives of the European Green Deal, some of these costs might end up being subsidized by European funds.
11 Page 27.
18 6. Conclusions
This work project is an exercise that uses a flexibility analysis tool (Irena FlexTool) to raise awareness and accountability for challenges and obstacles awaiting Portugal in its way to achieve carbon neutrality.
Given the results of the simulation for the electrical grid in 2030, where there is no loss of load value in all scenarios, it seems that the new wind and solar capacities will be more than enough to compensate for the decrease in thermal capacity, supported by the flat growth rate of demand. That said, the power grid is still inefficient and “dirty”, with high shares of electricity being curtailed where the CO2 emissions goal for 2030 will not be
achieved in any of the scenarios. The amount of power curtailed shows a negative correlation with the predicted baseload price, which is higher in the Existing Policies scenario and lower in the less conservative Planned Policies scenario (2030(+)). While in the first it decreases 1% relative to the 2018 average value of 57,45 €/MWh , in the second it is reduced by 13% (Table 812), signaling a noticeable, but not extreme13, decrease in the power price due to curtailment. Yet, this might be a consequence of the method used to predict the baseload prices,not taking into account which technology was setting the marginal price. It is expected that the number of hours with VRE’s as the marginal price-setting technologies14 increases may lead to further decreases in the
baseload price. The results show that curtailment penalties are relevant: including the curtailment penalties in the operational costs, it makes more economic sense to follow the 2030(-) scenario instead of the 2030(+) scenario, but if the curtailment penalties are
12 Page 14.
13 This value does not come close to the reference price of 20 MW/h seen in Portugal’s latest solar auctions.
14 The marginal price-setting technology is the most expensive technology injecting power into the grid at a given time period so that demand is met.
19 disregarded, the opposite conclusion is reached. Based on the results of the utility-scale battery scenario, it is clear that the power storing benefits are hardly high enough to justify the investment costs required for the installation of 1.600MW of utility-scale battery capacity.
There is opportunity for investments that improve system flexibility, by smoothing the energy production, reallocating power produced in peak intervals to the hours when natural gas is still producing significant amounts of power. Such solutions would simultaneously reduce curtailment levels and CO2 emissions. The estimated cost due to
grid inefficiency in 2030, based on the curtailment penalty, is between 30,1M € and 71,3M €, (€ 2019) under baseline conditions, thus representing a significant amount of resources that could be used to pay for investments that produce the effects mentioned above.
Considering the use of IRENA FlexTool, the model completely fulfilled the needs of the analysis, despite some minor bugs found along the way. The way it integrates all the data allowed for a dispatch model that was able to simulate a hypothetical electrical grid and assess how it would react under different circumstances. Even though the use of the FlexTool produced fruitful results, the potential of the tool was not fully exploited. It would be very interesting to split the Portuguese grid into various nodes, which would allow for the study of the electricity flows between the various regions of the country and the impact of investment in new transmission lines. It could also be interesting to separate the pumping demand from the other kinds of demand to better study how this form of storage can be used to manage the excess energy. The production units were modeled as bundles per technology type, but it would also be insightful to model production units separately, allowing for more detailed production data. All of these are beyond the scope
20 of this research. In terms of limitations, there were some issues when running the model with a start and/or finish value for the hydro reservoirs, implying that this feature could not be fully exploited and consequently the reserve levels ended up not matching the real ones. A benchmark with another dispatching model would also be advised. IRENA already compares their model with PLEXOS, thus it would be interesting to compare it with another model.
References
IPCC 2014: Climate Change 2014: Synthesis Report. Contribution of Working Groups I, II and III to the Fifth Assessment Report of the Intergovernmental Panel on Climate Change [Core Writing Team, R.K. Pachauri and L.A. Meyer (eds.)]. IPCC, Geneva, Switzerland, 151 pp.
BP p.l.c., BP Energy Outlook: 2019 edition, London, United Kingdom, 2019 REN21. 2019. Renewables 2019 Global Status Report (Paris: REN21 Secretariat) IRENA (2019), Solutions to integrate high shares of variable renewable energy (Report to the G20 Energy Transitions Working Group (ETWG)), International Renewable Energy Agency, Abu Dhabi.
IRENA (2019), Renewable Power Generation Costs in 2018, International Renewable Energy Agency, Abu Dhabi
IRENA (2018), Power System Flexibility for the Energy Transition, Part 1: Overview for policy makers, International Renewable Energy Agency, Abu Dhabi
21 IRENA (2018), Power System Flexibility for the Energy Transition, Part 2: IRENA FlexTool methodology, International Renewable Energy Agency, Abu Dhabi
IRENA (2018), Solid biomass supply for heat and power: Technology brief, International Renewable Energy Agency, Abu Dhabi
IRENA (2019), Innovation landscape brief: Utility-scale batteries, International Renewable Energy Agency, Abu Dhabi.
IRENA (2017), Electricity Storage and Renewables: Costs and Markets to 2030, International Renewable Energy Agency, Abu Dhabi.
REN (2019), Informação semanal do Sistema Eletroprodutor (Semana 43)
Oxford Institute for Energy Studies (OIES) (2018), The EU ETS phase IV reform: implications for system functioning and the carbon price signal
DGEG (Direção Geral da Energia e Geologia) & APA (Associação Portuguesa do Ambiente) (2018), Plano Nacional Integrado Energia e Clima 2021-2030 (PNEC) Governo da República Portuguesa (2019), Plano Nacional de Investimento (PNI)
Ministério do Ambiente e Transição Energética (2018), Roteiro para a Neutralidade Carbónica 2050 (RNC2050)
ERSE (2018), Manual De Procedimentos Da Gestão Global Do Sistema Do Setor Elétrico REN (2019), Caracterização da Rede Nacional de Transporte para Efeitos de Acesso à Rede
22 Brenhas, Maria & Machado Rosário & Dinis, Maria (2008), Vantagens do Ciclo Combinado a Gás Natural face a outras Tecnologias de Produção de Energia. Estudo de Caso: A Central da Tapada do Outeiro, Portugal
OECD (2019), Main Economic Indicators, Volume 2019 Issue 12, OECD Publishing, Paris, https://doi.org/10.1787/mei-v2019-12-en.
Pollitt, M. G., & Anaya, K. L. (2016). Can current electricity markets cope with high shares of renewables? A comparison of approaches in Germany, the UK and the State of New York. The Energy Journal, 37(Bollino-Madlener Special Issue).
Batalla-Bejerano, J., & Trujillo-Baute, E. (2016). Impacts of intermittent renewable generation on electricity system costs. Energy Policy, 94, 411-420.
Helm, C., & Mier, M. (2019). On the efficient market diffusion of intermittent renewable energies. Energy Economics, 80, 812-830.
23 Tables and Figures
Table 1 – Portugal targets for 2030
Source: PNEC, 2018 Table 2 – Potential CO2 emissions in Stated and Planned Policies Scenarios
Source: PNEC, 2018 Figure 1 – Evolution of the Portuguese GHG emissions from 1990 to 2016 Source: PNEC, 2018
24 Table 3 – Prediction of the evolution of the Portuguese power sector in the Stated Policies Scenario
Source: PNEC, 2018 Table 4 – Prediction of the evolution of the Portuguese renewable energy in the power sector in the Planned Policies Scenario
Source: PNEC, 2018
Figure 3 – Comparison of the primary energy dependency rate of EU countries (%)
25 Figure 6 – Overview of the tool input data (black font) and model outputs (red font)
Source: IRENA, 2019
Figure 7 – Impact of the EU ETS phase IV reform
Source: OIES, 2018
Table 5 – Prediction of final energy consumption in Portugal, per activity sector
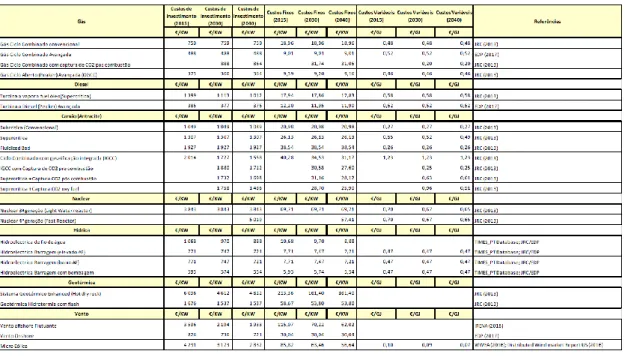
26 Table 6 – Costs of the technologies considered in the TIMES model
Source: PNEC, 2018
Figure 8 – Forward curve of TTF, NBP and PEGNORD
Source: Galp, 2019
Figure 9 – Annual Portuguese hydro inflows
27 Table 7 – Prediction of the interconnection capacity values between Spain and Portugal
Source: PNEC, 2018
Table 12 – Projetion of GHG emissions in Portugal
Source: PNEC, 2018
Figure 11 – Battery electricity storage system installed energy cost reduction potential, 232016-2030
28
29 Modeling 2018
WS master: In this worksheet the parameters and settings for the
whole model were defined. The CO2 cost was changed to the yearly
average cost of the CO2 allowances (delivery date of December
2018) in USD/MWh. For the whole model, the currency used was USD ($ 2018). The penalties were maintained, except for the exception of the curtailment penalty, that should be the same as the price per MWh of the year considered, which averaged 63,76 USD/MWh according to OMIE data (Iberian power market manager). The variable “time_in_years” was left with a value one, since only the year 2018 would be studied. The variable “time_period_duration” was set to 60, representing the number of minutes between each time step. The “reserves_duration” was not changed from the value of four hours, since it is the minimum time of connection or disconnection to the grid of the thermal groups (ERSE, 2018). The capacity margin value was ignored, since it is not used in dispatch mode. The “use_online” variable was set to 1 so that start-up costs and part-load efficiencies would be considered. The “use_ramps” was also set to 1, to make ramping constraints active (ramping = activation of a production unit). Since no maximum share of non-synchronous (e.g. solar and wind) generation was intended, the variable “use_non_synchronous” was set to 0. The mode variables were defined so that only the dispatch mode was used.
WS gridNode: Even though the model
allows for various grids (e.g. electrical grid, heating grid) and multiple nodes of a grid to be modeled, for the purpose of this analysis, only the Portuguese electrical grid was
30 considered, as a single node. Thus, in this sheet, the grid node and its respective demand and import/export data are described. The demand value is calculated by the sum of all demand in 2018, including that used for pumping purposes. The import value corresponds to the difference between the total imports (positive values) and exports (negative values). The “capacity_margin “is a variable solely used in investment mode. The fact that the share of variable generation was set to unlimited in the master sheet renders the “non_synchronous_share” meaningless. The “use_staticReserves” variable was set to 1 and the “use_dynamicReserves” variable was set to 0 because the fixed hourly values of the upwards regulation reserves were inserted in the worksheet ts_reserves, calculated using monthly data from REN (Table 115). Downwards reserves are ignored in the FlexTool to decrease model complexity (IRENA, 2019). The “print_results” variable was set to 1, so that all information concerning the node was detailed in the output file.
WS unit_type: This is
where the characteristics of the power generation technologies used in the model are defined. The following technologies were defined: coal, gas (combined cycle), hydro reservoir, hydro run-on-river, wind onshore, solar photovoltaic and biomass. Other technologies with smaller relevance, such as waves or waste residues were disregarded for simplification purposes. Although Portugal has conventional and combined cycle gas power plants, all of them were considered combined cycle, using the same simplifying rational. All of these technologies were already included in the template file, so only some fine tuning has to be performed. For the variables “efficiency”, “min load”, “eff at min
31 load”, “ramp up”, “ramp down” and “unit type”, almost all template values were used with the exception of “efficiency” and “eff at min load” of gas power plants, which were increased to 55% and 40%, respectively (Brenhas, Maria & Machado Rosário & Dinis, Maria, 2008). The variables relative to the costs of the different technologies (“O&M cost/MWh” as variable cost and “fixed cost/kW/year”) used in the analysis were retrieved from PNEC, specifically the 2015 costs used in the TIMES model (Table 216). This was done so that the results of the model can be related to the Portuguese energy plan as much as possible. The costs in Table 2 are monetized using 2000 Euro, so inflation rates from 2000 to 2018 were used to calculate the 2018 costs. Then, the energy units were converted to match the requirements of the input file. The variables “inv.cost/kWh”, “fixed kW/kWh ratio”, “eff charge” and “self_discharge_loss” are relative to storage, so they were left blank. The variable “conversion_eff” is only required when more than one node is used. The variables “startup cost”, “lifetime”, “interest” and “annuity” were template sourced. The variable “non_synchronous” is used to identify the non-synchronous technologies, identified by the value 1.
WS fuel: In this worksheet, the prices of the various fuels were
inserted. For natural gas, data was retrieved from MIBGAS (Iberia exchange for natural gas) and an average of the spot price in 2018 was calculated. The product used was the PVB (Spanish hub) Day-Ahead. As for coal, a similar approach was used initially for the product API2 (Rotterdam Coal Futures), that is an index based on the price of coal delivered into Amsterdam, Rotterdam and Antwerp region in the Netherlands. Finally, data on biomass was retrieved from an IRENA report, where the commodity used as a proxy was the woody biomass, with neglected
32 transportation costs (Figure 117), based on the assumption that it is the main type of biomass used in Portugal. The CO2 contents of all fuels were left as in the template file.
Even though there is emission of GHG emissions during the combustion of biomass, in Europe this technology is considered carbon-neutral, because CO2 is captured during the
trees growth.
WS units: In this
worksheet, the different power producing units of our 2018 model were defined. These were set so that each unit represents the total production capacity of the technology, meaning that, for example, even though there are four gas powered plants, only one unit of gas is introduced, with a power production capacity equivalent to the sum of all four plants. The inserted units were: coal, gas (combined cycle), hydro reservoir, hydro run-on-river, wind onshore, solar photovoltaic and biomass and their capacities were retrieved from a report on the Portuguese power grid in 2018, by REN, the Portuguese power grid operator. Then, the “fuel” for each thermal unit was selected, as well as the time series that contain the wind and solar profiles and the hydro inflows over the year, through the variables “cf profile” and “inflows”, respectively. The maximum capacity of the hydro reservoirs was inserted in the variable “storage” (REN, 2019), while the fullness levels at the start and end of the year were left blank. Even though this information was available, a model bug that occasionally created distorted results whenever one of these fields was not blank. After comparing some good results with and without the start and end levels of the reservoirs and verifying that the hydro production levels did not change considerably, this values
33 were ignored. The “reserve_increase_ratio” would only be needed for dynamic reserves modeling, a feature that will not be used. The inflow_multiplier was set to 1 because the exact daily inflow values were retrieved from REN website. The variables “maximum_investment_MW” , “invested storage” and “max_invest” do not influence dispatch modeling.
WS nodeNode: This sheet is only needed if we model multiple nodes with interconnection
capacities between them. Since that is not the case, the rows present in the template file were deleted, but the sheet was kept.
WS ts_cf:
This is where the time series for the wind and solar profile are stored. The four profiles that were initially included in the template file were kept. The wind_A profile and the PV were used as capacity factors for wind and solar photovoltaic units of the model, respectively. A validation to this approach was performed, by comparing the total electricity produced by these technologies predicted by the model with the real production values published by REN, after the first model run. The values for both were quite similar, so the profiles were validated.
WS ts_inflow: The information regarding the hydro inflows of the reservoirs and run-on-river was inserted here. The
34 daily inflow data for 2018, available on REN’s website, was retrieved through a macro and used in the model.
WS ts_energy: In this worksheet
the consumption values for each time step (hour) are defined. This time series corresponds to the total power demand, including the one used for hydro pumping purposes. All data provided by REN.
WS ts_import: The time series relative to the import and export
activities of the node modeled is depicted here. Positive values represent imports and negative values represent exports. All data provided by REN.
WS ts_reserves: This sheet is used to provide data on the reserve
requirements of the grid. There are three kinds of reserves: primary, secondary and tertiary, each one of them serving different purposes, namely frequency correction or to fill a demand gap created by the failure of a production unit. Since the model only requires a single reserve input per time step, only the largest reserves were considered, meaning the tertiary. This type of reserves is yet subdivided in upwards and downwards reserves, where the first are used to correct the grid when it requires more electricity and the latter in the opposite situation. The model only requires inputting the value of upwards reserves. The technologies currently used in Portugal to provide this kind of reserves are hydro and thermal, because of their dispatchable nature (REN, 2019).
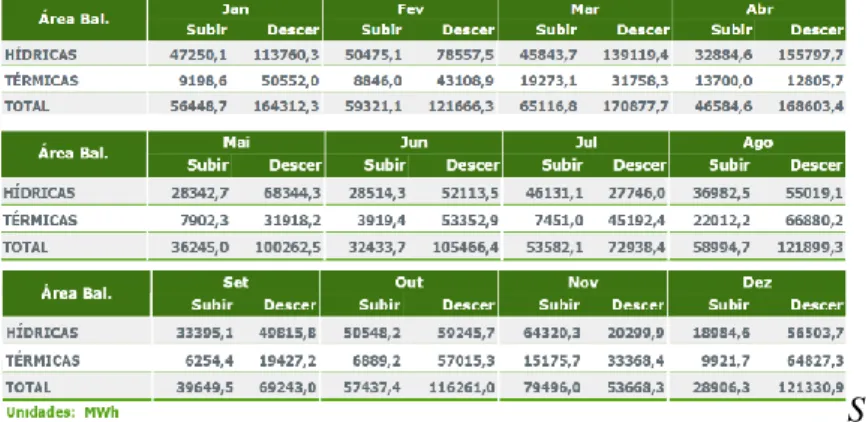
35 The hourly values were calculated by dividing the monthly upward reserves available on REN’s website by the total hours in the month (Table 118).
WS ts_time: The last
worksheet is used to define the different time periods of the year that will be modeled. By default, the time intervals are equidistant intervals of 168 hours, or seven days, totaling twelve intervals. The purpose of this selection of intervals is to reduce of complexity of the modelling task. The default layout of time intervals was used because it results in a comprehensive sample of the whole year, while taking less than 5 minutes to run.
After having all inputs included in the model, the master excel file was opened and the iteration phase started. In the Sensitivity scenarios worksheet, “portugal_2018.xlsm” was selected as the active input file and “Base” scenario chosen as the only active scenario. Then the button “Write time series and Run Scenarios” was clicked and the model run. The model takes between 2 and 5 minutes to run and it produces an output Excel file that is automatically saved in a folder named Results inside the main folder of the model. After each iteration, the output of the mode
18 Page 36.
36 was compared to the actual production data of 2018 and the input errors successively identified and solved.
Table 1 – Portuguese monthly upward and downward tertiary reserves of 2018
Source: REN, 2019
Table 2 - Costs of the technologies considered in the TIMES model
37 Figure 1 – Comparison of unit costs at different transport costs