Sales and Operations Planning:
Design and Implementation of S&OP process in a
multinational company
Gonçalo Maria Eva Ferreira Neves Lima
Advisor: Ricardo Reis
Dissertation submitted in partial fulfilment of requirements for the degree of MSc in Business Administration, at the Católica Lisbon School of Business and Economics September, 16th 2013
| P a g e ii
Abstract
The aim of this thesis is to evaluate theoretically the maturity of a practical Sales and Operations Planning process throughout its design and implementation phase, in a multinational company.
The company under scrutiny in this thesis is Aker Solutions Process Systems. As a part of the Aker Solutions group, Process Systems is a leading global supplier of processing equipment for oil, water and gas, operating worldwide. The company´s operational objective when implementing this process was to optimize the utilization of resources in it´s five different Business Units. The actions undertaken by the company to develop and implement a Sales and Operations Planning process were carefully record and posteriorly analysed. Sales and Operations Planning is a recognized cross-functional business process, designed to allow the company to synchronise supply and demand, bridge strategic planning with daily activities, and by reviewing performance measures, push continuous improvement, and cross-functional integration (Grimson and Pyke 2007; Dwyer 2000;Cox and Blackstone 2002, Gregory 1999).
The evaluation of the maturity of the Sales and Operations Planning process in question is done according to two different models. The Grimson and Pyke Model described in the 2007 paper “Sales and Operations Planning: an Exploratory Study and Framework” and Lapide´s 2005 “Four-Stage S&OP Process Maturity Model”. There are three distinct evaluation periods, the first in an initial stage before the implementation of the S&OP process, one in half way through the implementation of the S&OP process and a final after the implementation of the S&OP process.
The results suggest that theoretically by the third evaluation of the process the implementation was achieved and the process presented a level of maturity that should allow the management to use the results of the process to define resource optimization actions. However, the practical results of the process suggest that by the third evaluation, the process is not yet able to produce any useful information.
| P a g e iii
Acknowledgments
I would like to thank David Merle that gave me this amazing opportunity, to write my thesis in a real high profile business environment.
I am also extremely grateful to Børre A. Svenn for his patience, guidance and wiliness to share his vast experience in both the practical work and in the writing of this thesis.
I would also like to thank my Master Thesis advisor, Ricardo Reis, who always was always available to provide useful and constructive advice.
Lastly, I would like to thank my family and friends that helped me through this great endeavor. Special thanks for Tone Weggeberg for putting up with me for all this months and always pushing me to do my best.
| P a g e iv
Table of Contents
ABSTRACT ... II
ACKNOWLEDGMENTS ... III
LIST OF TABLES ... V
LIST OF FIGURES ... V
LIST OF ABBREVIATIONS ... VI
CHAPTER 1, COMPANY DESCRIPTION ... 7
1.1AKER SOLUTIONS –FROM A WORKSHOP TO A MULTINATIONAL GROUP ... 7
1.2AKER SOLUTIONS PROCESS SYSTEMS ... 8
1.3BUSINESS MODEL ... 9
CHAPTER 2, LITERATURE REVIEW ... 11
2.1THE SALES AND OPERATIONS PLANNING CONCEPT AND GOALS ... 11
2.2THE S&OPPROCESS ... 13
2.3IMPLEMENTATION ... 15
CHAPTER 3, METHODOLOGY – MATURITY MODELS ... 18
3.1GRIMSON AND PYKE MODEL ... 18
3.2LAPIDE´S “FOUR-STAGE S&OPPROCESS MATURITY MODEL” ... 23
3.3MODELS ANALYSIS ... 25
CHAPTER 4, DESIGN AND IMPLEMENTATION OF A S&OP IN A MULTINATIONAL COMPANY ... 27
4.1INTRODUCTION -STRATEGY SHIFT ... 27
4.2DESIGNING THE SALES AND OPERATIONS PLANNING PROCESS ... 28
4.2.1 Assessing the initial situation ... 29
MATURITY EVALUATION –FIRST EVALUATION ... 32
4.2.2 Building the Operations Planning tool ... 33
4.2.3 Building the Operational Planning tool – post-research approach ... 36
4.3IMPLEMENTATION OF THE OPERATIONS PLANNING TOOL ... 38
4.4THE FIRST S&OP ROUND OF MEETINGS ... 40
4.4.1 Sales Planning meeting ... 40
4.4.2 Operational Planning meeting ... 41
MATURITY EVALUATION –SECOND EVALUATION ... 43
4.4.3What was learned evolution of the tool ... 45
4.4.4 Flowchart ... 45
4.4.5 Changes in disciplines and increasing the level of detail ... 45
4.5THE SECOND S&OP ROUND OF MEETINGS ... 47
4.5.1 Set up the 2nd meeting ... 47
4.5.2 Results from the Sales Planning meeting ... 47
4.5.3 Operations Planning meeting ... 48
MATURITY EVALUATION –THIRD EVALUATION ... 50
| P a g e v
4.6.1 The S&OP tool ... 52
4.6.2 The tool implementation ... 53
4.6.3 Next Steps for the S&OP process: Practical approach ... 54
4.6.4 Next Steps for the S&OP process: Theoretical approach ... 57
CHAPTER 5, CONCLUSION ... 61
5.1THEORETICAL AND PRACTICAL APPROACH ... 61
5.2PRACTICAL RESULTS OF THE S&OP PROCESS ... 62
BIBLIOGRAPHY ... 63
ANNEXES ... 66
ANNEX 1–EXISTING TOOL PICTURES ... 66
ANNEX 2-POPULATED PRSCAPACITY TOOL ... 68
ANNEX 3-FIRST DRAFT OF THE S&OPFLOWCHART AND NEW GRAPHIC DISPLAY ... 69
List of tables
Table 1- S&OP Integration framework Grimson and Pyke………....………...………19Table 2 – Maturity framework Lapide ………...………..23
Table 3 – Grimson and Pyke Evaluation 1………32
Table 4 – Lapide Evaluation 1………...………33
Table 5 – Grimson and Pyke Evaluation 2……….43
Table 6 – Lapide Evaluation 2………....………44
Table 7 – Grimson and Pyke Evaluation 3……….50
Table 8 – Lapide Evaluation 3………51
List of Figures
Figure 1- Aker Solutions’ nine Business Areas ……….8Figure 2 - Figure 2 - Aker Solutions Process Systems Business Units………...9
Figure 3 – OPC Industry dynamics……….10
Figure 4 – New Set of disciplines………....37
Figure 5- Existing tool……….65
Figure 6 - Existing tool capacity display……….66
Figure 7 - Existing tool set of disciplines………67
Figure 8 - Populated PRS Capacity tool ……….67
Figure 9 - Flowchart Stage 1………68
Figure 10 - Flowchart Stage 2 and 3………68
Figure 11 - Flowchart Stage 4………..……68
| P a g e vi
List of Abbreviations
AKSOPRS – Aker Solutions Process Systems APAC – Asia-Pacific and Australian Continent BU – Business Unit
EMEA – Europe Middle East and Africa EVP – Executive Vice-President
IT – Information Technology
NCS – Norwegian Continental Shelf OP – Operations Planning
OPC – Oil Partner Company SP – Sales Planning
| P a g e 7
Chapter 1, Company Description
1.1 Aker Solutions – From a workshop to a multinational
group
Aker Solutions is a worldwide provider of oilfield products, systems and services for costumers in the oil and gas industry.
Aker Solutions started as a small mechanical workshop on the banks of the river Aker in Oslo more than 170 years ago. Originally its core activities included shipbuilding, manufacturing components for machinery, and equipment for clients in the iron and non-ferrous metal industries. After the discovery of oil and gas in the North Sea in the 1960s, the company shifted its focus to oil and gas market. Shortly after the company became a driving force in the development of oil and gas products, such as subsea fields, or floating production concepts.
More recently, in 2002, Aker Maritime (soon to be Aker Solutions) joined forces with Kværner, another Norwegian company. Together they created a strong entity, with activities in multiple industries such as oil and gas, engineering and construction or shipbuilding, under the name of Aker Kværner. Finally during the first months of 2008 the company announced a new name: Aker Solutions.
Nowadays Aker Solutions is one of the world´s leading providers of oilfield products, systems and services. According to Aker Solutions, they offer the best solutions to their costumers for every stage of their field´s exploration time. Today Aker Solutions is a company group with more than 28,000 people between employees and contract staff in 30 different countries, and has yearly revenues of 44 billion Norwegian Kroner (around 5.8 billion Euros).
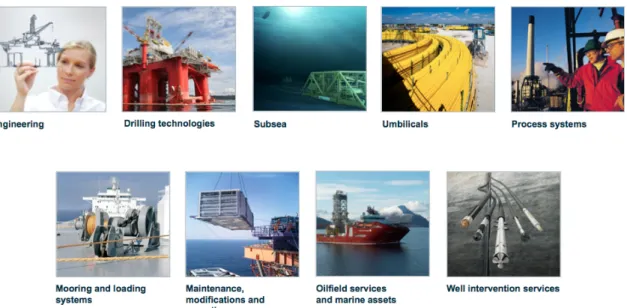
Currently Aker Solutions is organized in nine independent business areas, each one with a distinct range of products aimed to serve the different stages in the life of an oil and gas field. See picture 1
| P a g e 8
1.2 Aker Solutions Process Systems
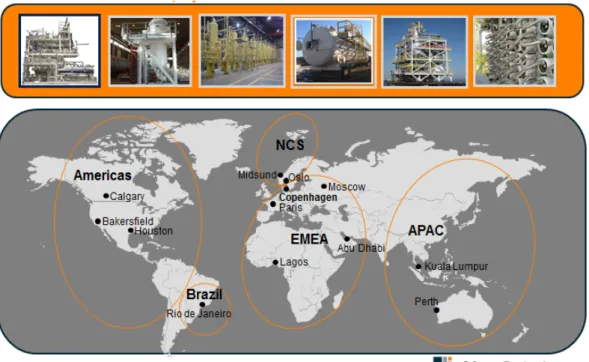
The following thesis will focus on Aker Solutions Process System Business Area (AKSOPRS).
As one of the Business areas of Aker Solutions, Process Systems is a leading global supplier of processing equipment for oil, water and gas. Process Systems provides Conceptual studies, detailing engineering, fabrication and assembly of process equipment skids and modules, as well as proprietary internals, and critical components for non-Engineering Procurement and Construction deliveries. AKSOPRS counts more than 600 employees spread out over five different business units (Americas, Brazil, EMEA, NCS, APAC), as shown in Figure 2. In 2011, AKSOPRS had 198 million euros in revenues, representing 5% of the total group´s revenue that year.
| P a g e 9
1.3 Business Model
AKSOPRS is one of the main players in a sub industry within the oil and gas industry. The role of companies like AKSOPRS is to provide oilfield products, systems and services to the companies that own or explore the oil or gas fields. In simpler words, the role of AKSOPRS, and other similar companies, is to provide to its clients (normally big oil companies like BP, Total or Statoil) the necessary feasibility studies, engineering designs, or specific hardware modules for the oil companies to explore their oil or gas fields efficiently. The companies will further on be referred to as “Oil Partner Company” (OPC) in the current thesis.
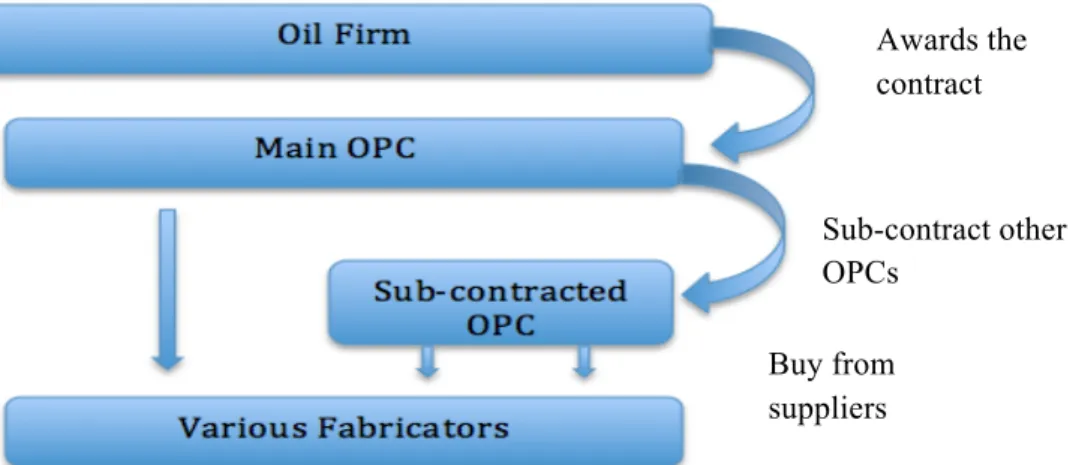
The sub industry works in a global project-based business model. A typical project in this industry has a large number of players, ranging from multinational oil firms to small local screws producers. The relationship between the agents in this type of project is linear and three folded, as illustrated in Figure 3:
| P a g e 10
(1) The oil firm awards a contract to a OPC company to build a part or all of the infrastructure necessary for the exploration of the field (e.i platform)
(2) The OPC then outsources some sub parts of this contract to other specialized OPCs
(3) Finally, both the main OPC and the sub contracted OPCs will buy parts from local or global fabricators.
The value of a project in this kind of sub industry can range from 100,000 Euros, to several hundred million Euros, and the project timespan from couple of weeks, to several years. Awards the contract Sub-contract other OPCs Buy from suppliers
| P a g e 11
Chapter 2, Literature Review
2.1 The Sales and Operations Planning concept and goals
Sales and Operations Planning (S&OP) is a cross-functional business process/tool, designed to allow the company to synchronise supply and demand, bridge strategic planning with daily activities, and by reviewing performance measures, push continuous improvement, and cross-functional integration (Grimson and Pyke 2007; Dwyer 2000; Cox and Blackstone 2002, Gregory 1999).
S&OP is a cross-functional business process: the S&OP process occurs within the business functions, and needs the combined contribution of several functions across the company, such as sales, operations or finance. In an organizational behaviour point of view the objective of the S&OP is to drive alignment and integration of functions at a planning and operational level, through a defined set of processes, reporting steps and validation meetings. This cross-functional alignment and integration is for some authors an essential feature for a company that wants to survive in a global, and highly competitive, economy like the one apparent today (Bowersox et al 1999, Oliva and Watson 2009).
To achieve a match between supply and demand, different authors defend two different types of planning: Some advocate a reactive approach where supply adapts to demand, while other authors support an aggressive tactical approach, where demand is adjusted to the supply capability in place (Grimson and Pyke 2007; Dwyer 2000; Olhager et al 2001; Feng 2008).
To facilitate the bridging of the strategic plans with daily activities, a set of meetings between managers and operational people are arranged during the S&OP process. The objective of such meetings are to validate the information gathered from the functions, and define actions to conduct the daily business, according to the strategic view of the company (Oliva and Watson 2009, Grimson and Pyke 2007)
| P a g e 12
The effects of the S&OP process in the companies performance appear to be positive, however the extent of the effects are still not fully empirically proven (Thomé, Scavarda, Fernandez and Scavarda 2012). Nonetheless, it is possible to find several authors whom use a less systematic approach, proclaiming the connection between the firm performance and the S&OP process, and the sub-sequential alignment of Supply and Demand. Higher costumer service, less inventories or an efficient management of the supply chain are only some of these advocated benefits (T.F. Wallace 2004; Lapide 2004b; Grimson and Pyke 2007; Cacere et al 2009).
A benefit some authors advocate is linked with the mitigation of the “Bullwhip- effect”. The Bullwhip-effect occurs when a temporary spike in demand sends an increasing backlash through the supply chain of the company, misaligning supply and demand (bigger supply than demand), which again leads to costly supply chain dysfunctions, and loss of efficiency through the whole productive process. With an S&OP process in place, supply and demand should always be aligned, and in that way prevent the Bullwhip-effect.
When searching for more empirical evidence of these effects, few papers are found regarding the topic, and the results they present are only partial, when compared to the extent of S&OP process. The following publications touch upon the subject:
• McCormack and Lockmany (2005) found significant positive correlations among informal organisations, formal groups, integrating roles and network building with firm performance.
• Hadaya and Cassivi (2007) found that the effect of the integration/collaboration aspect of the S&OP process is mediated by the use of inter-organisational information systems
• Olhager and Selldin (2007) found that the S&OP process reduces the negative effect of the market uncertainty in the company performance
• Feng and Shopie D´Amors (2008) – Found that a cross-functional integrated planning has a better results, than an independent functional planning.
• Olivia and Watson (2010) hypothesized that the S&OP process has effects in the company performance even when incentives are misaligned within the company.
| P a g e 13
According to the synthesis done by Thomé, Scavarda, Fernandez and Scavarda in 2012 it is possible to group the S&OP process goals in to 5 distinct categories:
• “Alignment and Integration” – Organizational alignment, supply and demand balance, cross-functional integration or supply chain integration
• “Operational improvement” – improvement of sales and operation forecast, stock reduction, optimize the allocation of capacity, supply chain optimization and increase in business control
• “Results focused on a single aspect” – Improve supply chain performance, minimize demand distortions, enhance revenues or reduce costs.
• “Results based on trade-offs” – optimize profits (revenue vs cost), optimize costumer service vs inventory or optimize supply chain costs.
• “End Results” – Improve financial indexes such as R-on-Investment or Earnings Before Interests, Taxes, Depreciations and amortizations.
2.2 The S&OP Process
The typical S&OP process has five steps (Grimson and Pyke 2007;Kruse 2004; Rooney and Bangdert, 2001; Lapide 2004b, 2005a, Wallace 2004).
1)
First, sales personnel gather information related to sales with the intent of drawing the sales forecast. This forecast should be drafted without any production capability restrains, and only mirror the amount that the costumers are willing to buy. When drafting this sales forecast, the main variables behind possible variations in the demand forecast should also be considered in a scenario-building approach.
Another relevant aspect of the first step, is the definition of the timespan of the analysis, normally ranging between 6 to 18 months. This 12-month variation is linked to production, the consumers and the business cycles of each industry. For instance in a project based industry such as the oil & gas industry, the advisable timespan is 12 months,
| P a g e 14
while in long production lead time industries, such as the pharmaceutical industry, the used time span can be that of several years.
2)
Second, the Operations group collect information about the available production capacity, supply chain capability, manpower availability, and storage capabilities. The aim of such an exercise is to, with the collected information, draft a production plan to meet the sales forecast, which resulted from the first step of the current process.
3)
Third, the S&OP team formally meets and compares both sales forecast and operational capacity, and with this information in mind, come up with a set of actions to improve the company´s operational efficiency.
The S&OP team composition varies from industry to industry, but in general it should have representatives from the operations and sales team, preferably the elements that took part on the first two steps. Additionally, both the financial and strategic functions should also be represented in the S&OP team.
Moreover the presence of a member of the legal team can in some industries be useful. As a practical example, the S&OP team in a company from the oil and gas industry might include representatives from Operations (Project Execution, Supply Chain, Quality and Tender), Sales (Business Development), Finance, and in particular cases, Legal. This results in a team of around nine fixed elements, plus any variable attendees of approximately ten employees.
Some authors also advocate that the appointment of an S&OP responsible, increases the effectiveness of the process greatly (Grimson and Pyke 2007, Mansfield 2012). Whoever appointed the responsibility, should have enough power to successfully push the implementation and execution of the whole process.
| P a g e 15
4)
Fourth, there are the implementations of the set of actions resulting from Step 3. This set of actions are normally aimed to both sales and operations functions. However depending on the type of planning in place (aggressive or reactive), these actions might only be focused in one of the teams.
5)
In the fifth stage, the results of the set of actions put in place during the fourth stages are measured. The development of a set of measurements to evaluate the results and the level of implementation of tool is essential for continuous improvement. However, to define this set of measurements is not an easy task since, the measurement parameters for S&OP effectiveness are rare, and industry dependent (Grimson and Pyke 2007).
Literature suggests several measurements to evaluate operations, such as capacity utilization or variance in standard cost, and to evaluate sales such as sales growth or market share. However the measurements to evaluate empirically S&OP effectiveness as whole are rare, as mentioned previously
A final note regarding the general S&OP process is regarding the S&OP cycle timespan. Literature suggests that the S&OP process should operate in a monthly cycle (T.F Wallace 2004). However recent science publications show there is a tendency to reduce this time to an almost event-driven or daily event (Grimson and Pyke 2007, Lapide 2002).
2.3 Implementation
Implementing an S&OP system implies a big change, since business culture, business processes and IT tools have to be adapted to achieve a full integration of the different functions in the process (Lapide 2005, Grimson and Pyke 2007):
• Change in mentality is essential. The S&OP process is defined as a cross-functional process, thus a full integration at a planning and operational level between the different functions, is crucial to successfully run the process. This
| P a g e 16
part of the implementation process is even more relevant when we see that, especially in a highly differentiated organizational context such as a multinational corporation, each business function tends to specialize in its own part of the planning process, and isolate itself from the other functions. Such behaviour has roots in structural causes such as misalignment in reward and evaluation systems, and tends to generate conflicts between functions when the time to match supply and demand arrives (Oliva and Watson 2009, Shapiro 1977).
To achieve cross-functional integration it is necessary to have different managers with different incentives and goals work together. Some authors defend that this often requires a change in the incentive model (Lapide 2005b), however certain recent studies show it might be attained by implementing a business process that promotes informational procedural and alignment quality (Oliva and Watson 2009). Regardless of which approach is used to transform the mentality of the company, it appears achieving a uniform way of thinking and acting is essential to achieve a successful S&OP process.
• Change in business process: To establish the S&OP process, it is necessary to put in place a set of periodic meetings and tasks, and a set of defined operational steps to feed the meetings and tasks. This requires a re-arrangement of schedules and day-to-day activities from the organization. To feed the first two steps of the typical S&OP process is necessary to provide forecast and operational input, in order to build both the demand forecast and the supply capacity. To provide such an input, it might be necessary to add extra reporting processes to both sales and operations´ day-to-day activities.
• IT Tools, are essential to the process, but not enough to harvest the full range of benefits the S&OP process can provide the company (Lapide 2004b). However, the level of required automation and computational sophistication varies within the several levels of S&OP maturity. In a introductory level to S&OP the necessary IT support is quite low, in some cases a simple spread sheet and a dedicated employee might be enough. Whilst in a more advanced stage, a
| P a g e 17
dedicated tailor-made set of programs might be needed. In those stages, the amount of information used in the process is too big to be handled manually.
To operate a mature S&OP process, it is necessary to have in place three different, or a three-sided, software (Lapide 2004b), since the process deals with three major types of information:
− Sales or Demand: The system needs to be able to support the production of the sales forecast. A feature that allows the production of “what-if scenarios” is regarded as essential.
− Operations or Supply: The system needs to be able to support the production of the capacity plan, and to mirror perfectly the operational and capacity limitations of the company.
− S&OP environment: The system needs to be able to cross, display and change the information from both the Sales and Operations parts of the system.
| P a g e 18
Chapter 3, Methodology – Maturity Models
The literature is rich in models to assess the level of maturity of the S&OP process in a company (Thomé, Scavarda, Fernandez and Scavarda 2011). Two of these models were picked to evaluate the evolution of the S&OP process, and is described in the following section of the current paper.
The first model picked is the Grimson and Pyke Model, presented in the paper “Sales and
operations planning: an exploratory study and framework”. The model is chosen because,
as it is explained in the Grimson and Pyke´s paper, it was designed based in the S&OP literature analysis, and on 15 in-depth company interviews, conferring to it a degree of reliability uncommon is this field. Furthermore, structurally, the model is complete, since it evaluates each S&OP process on five different dimensions in a 5-ranked scale.
The second model used in the current paper is the Lapide Model presented in the third part of the author´s series named “Sales and Operations Planning”. The model was chosen because of the quality of its structure, and the author´s experience in the field. Larry Lapide has contributed greatly to the S&OP theme, both with his experience as a manager, and with his publications.
3.1 Grimson and Pyke Model
The section 3.1 of this paper was written using as a base the paper “Sales and Operations
Planning: an exploratory study and framework” from Grimson and Pyke, 2007
J. Andrew Grimson and David F.Pyke in their paper “Sales and Operations Planning: an
exploratory study and framework” present a 5 stage framework that include both
business and information processes to assess the maturity of the S&OP process in a company. To built this framework the authors based their research in previous models, focusing specially in two the six staged Aberdeen Group´s S&OP competitive framework that ranks a company against its industry standard and Lapide´s “Four-Stage S&OP
| P a g e 19 Process Maturity Model” that assess the current S&OP status of a company and identifies
the steps the company needs to take to achieve the optimum level of S&OP.
The goal of the Grimson and Pyke model is profit optimization through the integration of the sales, operations and finance function´s plans.
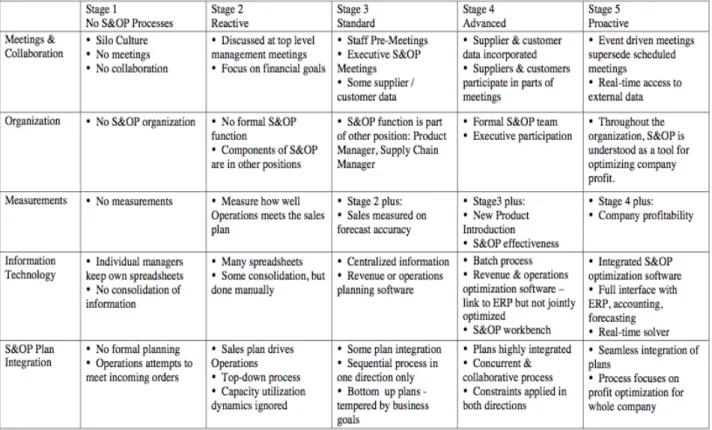
This framework classifies the companies in five different ranks, from “No S&OP Processes” to “Proactive” across five different dimensions - “Meetings & Collaboration”, “Organization”, “Measurements” which are business process related, “Information Technology” and “S&OP Plan Integration” which are information process dimensions.
The “Meetings and Collaborations” parameter assesses the level of effectiveness of the human component in the whole S&OP process.
In a company ranked with Stage 1 in this parameter there are no formal meetings and all of the functions work independently and sometimes “against” each other (misalignment of incentives). In these cases planning is done with a silo mentality.
Table 1- S&OP Integration framework
| P a g e 20
At Stage 2, S&OP starts to be discussed at a senior level, the sales responsible and the operations responsible regularly. However the meeting is focused in the financials indexes of the company, planning is still done independently and integration is not achieved. Furthermore as in the first stage, one of the big risks of this second stage is that by focusing only in the financial aspect of the company, the indexes under analysis are only the ones that drive sales failing to represent the market or the operations environment. Focusing only on the sales driving indexes the company will take decisions taking in account only a part of the relevant information.
In Stage 3 both sales and operations functions hold their own pre-meetings to prepare their plans for the formal S&OP meeting At this point both sales and operations plans are not a fully detailed plan, they are more of a rough sketch considering only main suppliers and costumers. In the S&OP meeting the aim now is to integrate both sales and operations plans.
The fourth stage is only an enhance of Stage 3, now both clients and suppliers take part in the S&OP meeting and more and smaller clients are included in the sales and operations plans.
In Stage 5 event-driven meetings are added to the Stage 4 processes, now all of the information is available and updated live for employees and partners, the aim at this stage is to give S&OP personal enough, accurate an timely information in order to allow them to tackle problems immediately after they appear.
The “Organization” dimension is focused on the S&OP structure, in other words this parameter assesses the level of organizational commitment of the firm with S&OP. In a company in the Stage 1 of the “Organization” parameter, there is not a S&OP function or any employee with specific S&OP responsibility. In a Stage 2 company there is not an official S&OP function, however there are some employees executing some S&OP tasks. Such as crossing the sales plans with the operations plans to fulfil the financial objectives. In a company with a S&OP Organization maturity of Stage 3, there is an official S&OP function. However it is not independent, it operates under another function. A Stage 4 organization has S&OP as an independent function with representation at a senior
| P a g e 21
management level. Stage 5 has the same characteristics of Stage 4 the only difference is that now S&OP is understood and respected by the whole company. The whole company sees the benefits, embraces the S&OP process and takes part actively in it.
The “Measurements” parameter goal is to evaluate the measurements used to assess performance and the effectiveness of the S&OP process. In Stage 1 of this parameter the company has no measurements in place beyond the standard financial accounting system. Stage 2, the company now assesses to which degree the operations plans meet the sales plans. In Stage 3 an extra measurement is added, now the sales function is measured in how accurately their sales forecast is when compared to reality. In a company with a Stage 4 “Measurements” parameter, two extra measurements are included in the previous lot.
• New product introduction effectiveness – normally operational measurements are designed to evaluate products outside of the introductory phase. When evaluating products in this initial phase of their life the normal operational measurements tend to miss evaluate this products effects on the company performance. Therefore there is a really need for this type of measurements.
• S&OP effectiveness – feedback from all of the entities taking part of the process should be gathered and improvements should designed be implement. Furthermore functional measurements can also be used, the S&OP process should increase forecast accuracy and reduce inventory size over time.
Stage 5 adds profitability to the previous stage S&OP measurements. In this stage reaching the objective no longer is only the functional manager responsibility, the S&OP team is now also responsible for the reaching of that objective. Profitability is seen as a cross functional responsibility.
The “Information Technology” parameter is focused in the information process instead of the business process. In other words, this parameter measures how evolved is the IT tool supporting the whole S&OP process. In Stage 1 the companies has some individual spreadsheets owned by different managers that do not share the information or consolidate it. In Stage 2 the spreadsheets are still owned and updated separately but there is some degree of manual consolidation. A company with a Stage 3 IT tool already has an
| P a g e 22
automated way to centralize the information. At this point some type revenue or operations planning software is in place.
In Stage 4 the company has both revenue and operations optimization software, however the plans are not optimized jointly (separately or sequentially). Furthermore in this stage an “S&OP workbench” is in place, this is an automated tool to share the supply and the demand information throughout the S&OP team. Stage 5 is currently above current IT programs capacity, but the authors reckon that this will be the next step for S&OP software. This software will encompass all aspects of both sales and operations. Providing to the company total information regarding all of the variables that influence the optimization point between sales and operations all in time. Features like real-time cross-functional solutions will allow the company to react quicker and more accurately to market shifts, striving for profit optimization.
The “S&OP plan integration” parameter measures how effectively the company defines its sales plans, operations plans and how well these plans are integrated. In other words this parameter measures the extent both the operations and sales plans interact and take in account each other’s limitations. In Stage 1, the company has no S&OP planning. The Operations function only tries to meet the incoming orders without any previous planning. In Stage 2 the process is run by the Sales function that defines its sales forecast without any operations input, the interaction between function is minimal and only exists in one way. In Stage 3 the whole process is still sequential, and the Sales function is still running the show, however now some input from operations is considered and adjustments are made. At this stage the plans already take into consideration both business and financials goals. The interaction between the two functions already exists in a two-way stream although not in even terms and the more variables are considered in this interaction. A Stage 4 process is developed by both the sales and the operations function in a concurrent way, at this point capacity limitations are also considered and used to adjust the sales plans. At this point, both the input from Sales and the input from Operations have the same relevance when building the plans. At the Stage 5 the process reaches its peak. Now not only supply and demand are aligned in a way both sales revenues and operation efficiency is achieve but also optimal profit is attained. The amount of variables considered into the plans increases considerably, pricing constrains, competitive actions or supply chain constrains are now considered. The interaction is perfect both functions act as one. According to the authors this stage is still impossible to achieve since, as
| P a g e 23
mentioned previously, the software necessary to support such a process is not yet available.
3.2 Lapide´s “Four-Stage S&OP Process Maturity Model”
The section 3.2 of this paper was written using as a base the paper “Sales and Operations
Planning Part III: A Diagnostic Model” from Lapide, 2005.
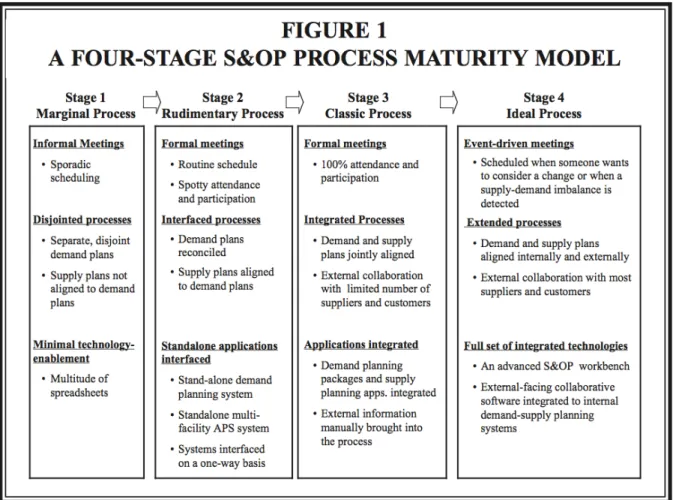
Larry Lapide presented his model in the third and last part of his “Sales and Operations Planning” series. The objective this final part of the series was to help companies to push their S&OP process closer to the ideal process presented in Part I of the series. The model categorizes companies in four different maturity stages and evaluates three different aspects of the S&OP process (Meetings, Processes and Technology).
Table 2 – Maturity framework
| P a g e 24
Stage 1: Marginal Process
In this phase the meetings are sporadic, there is not a real schedule for the meetings, and the participants do not engage themselves actively in the process, the silo mentality is not changed. The processes at this stage are separate, both sales and operations functions draw their own independent forecasts and do not cross information, there is little or none consolidation attempts. Regarding IT, there is little integration software in place - each function has its own spreadsheets.
Stage 2: Rudimentary Process
A Stage 2 company has a formal planning process in place, however level commitment of the participants is still not optimal - some do not attend or do not actively try to come up with a joint plan. At this stage the processes are interfaced, both sales and operations plans are done separately in a sequential way, with operations plotting their plans in accordance to the sales forecast. Regarding IT, both sales and operations have their own separate dedicated software. Although information is transmittable between these two types of software, it cannot be used in real-time.
Stage 3: Classic Process
A company with a Stage 3 process have a formal S&OP process that follows most of the guideline presented by Larry Lapide in the first part of his Sales and Operations Planning series. In others words, there is a schedule for all the meetings, the meetings are held and attended among highly ranks cross-functional participants with the goal of matching the supply plans with the demand plans. The planning in this stage is integrated, the sales come up with a draft of their forecasted demand, then operations gets this draft and with it drafts its own supply forecast draft, after both drafts are done they (both forecasts, not only operations) are discussed in the S&OP meeting and adjusted by the cross-functional team attending.
In the later part of this stage it is possible to include in this meetings some of the principal costumers or suppliers of the company in order to help in providing more reliable forecasts. Regarding IT paremeter, at this point both the sales and the operations software are integrated to allow the final plan to be drafted jointly.
| P a g e 25
Stage 4: Ideal Process
This stage, according to the author, cannot be achieved since it requires a perfect alignment between sales and operations and a IT support programme capable of shifting its plans according to real-time information. However, it can be used as a target, a role model to continuously improve the process. The process at this stage should follow all of the sets explained in the first part of Lapide´s “Sales and Operations Planning” series. The meetings are event-driven, taking place only if some change need to be implemented or if supply and demand are unsynchronized, this implies that there is a system in place the allows the supply and demand to be motorized in real-time. At this stage the whole process is perfectly aligned internally with all of the functions plans reacting to each other, and is extended externally with most of the clients and suppliers giving input and influencing the plans of each function. In an IT stand point, an advanced S&OP Workbench would need to be used, to enable global access and a real-time modification of supply and demand. Furthermore this workbench would recommend the changes that need to be implemented to achieve the new optimal point in the supply-demand parity.
3.3 Models Analysis
When analysing both models, it is evident some communalities. This was expected since Grimson & Pyke based partially their academic model in Lapide´s practitioner model. Some of the dimensions used to evaluate the maturity of a S&OP process are common and both models aim to achieve a unreachable maturity level. However it is also evident that through their research and methodical approach they were able to develop further Lapide´s model and came up with more complete model.
The approach used by Lapide to develop his model was of a practitioner. Larry Lapide tapped into his experience to develop this model, instead of an academic and systematic approach to the development of his model. The consequence of such an approach is that his model is easy to understand and easily applied to real companies. Especially if the other two parts of his “Sales and Operations Planning” series are used as the theoretical support, to the practical application of this model. Furthermore in his paper Lapide also provides some practical guidelines to develop a S&OP model through his different levels of maturity.
| P a g e 26
Grimson and Pyke in their turn adopted a more systematic approach in the development of their model. A thorough analysis of literature was made and 15 in-depth company interviews were done, encompassing in this way in their model both theoretical knowledge and practical experience. Furthermore to develop their model two other models were used as a reference the six staged Aberdeen Group´s S&OP competitive framework and the Lapide´s “Four-Stage S&OP Process Maturity Model” used in this paper as well. From this research a more complete and complex model arose that allows an in-depth analysis of the S&OP process maturity in the company.
When comparing both of the main difference, apart from the degree of complexity of the models, is that Lapide´s model does not include in its assessment one essential dimension, that Grimson and Pyke´s model includes.
When comparing the dimensions used by both models to assess the maturity of the S&OP process they are for the most part equivalent. Grimson & Pyke´s “Information Technology” and “S&OP Plan Integration” are similar to Lapide´s “Technology” and “Process” respectively. It is even possible to infer that Grimson & Pyke´s “Meetings& Collaboration” and “Organization” dimensions altouhgh broader encompass fully Lapide´s “Meetings”. However the “Measurements” parameter in the Grimson& Pyke model does not have a correspondent in the Lapide´s model. This parameter is essential when managing successfully the a Sales and Operations Planning process, since its with this through this type of measurements that the process evolves and improves. Additionally, to develop an advance set measurements take a lot of effort and a deep knowledge of the whole S&OP process. Therefore it is relevant when assessing the maturity level of a S&OP process to evaluate this dimension since it will influence both the development of the tool and it is a mirror of the knowledge the company has in this S&OP process.
| P a g e 27
Chapter 4, Design and Implementation of a S&OP
in a multinational company
In this chapter a full description of the actual process of design and implementation of Sales and Implementation process in the multinational company is present. Furthermore, also during this chapter there will be three theoretical evaluations of the maturity of the S&OP process.
4.1 Introduction - Strategy shift
Since the new Executive Vice-President (EVP) assumed his position in May 2012 the company has taken a turn in its strategic direction, unity and cooperation substituted independency and technology specialization as the main strategic words driving the company.
Historically the company´s Business Units (BUs) worked almost independently within its areas of operation. Although some actions to change this mentality were taken previously, the company´s BUs still worked as small independent entities by the summer of 2012. Under the new leadership a set of wide range actions were taken and a new organizational structure was implemented to push the 5 BUs to work together as a company.
One of the central points of the new EVP approximation strategies was to implement a joint Sales and Operations Planning process (S&OP). The results of this process would give the management team the necessary insight to align cross-functionally the strategic goals of the company and set accurate corrective actions for each BU to achieve a greater efficiency in resource use, while assuring a high quality delivery. The objective of the S&OP tool was to achieve an operational improvement (Thomé, Scavarda, Fernandez and Scavarda 2012). This improvement would be achieved by making the necessary resources for each project available in time and to promote resource exchange and cooperation activities that will help each BU to capitalise on the group´s advantages instead of fighting on its own. The resources in this case are the engineers that take part in the company’s projects. In a more practical and simplistic approach, the objective of the S&OP process is to provide management the necessary information for management
| P a g e 28
allocate the correct amount engineers with the appropriate skills in the different BUs in order to optimize the company´s profit.
Although the discussion surrounding the S&OP was finalized and the green light on the in-house development of such tool was given, the decision did not generate a consensus. There were still some parts of the organization that did not see the benefits of such a tool.
4.2 Designing the Sales and Operations Planning Process
“I do not know how much I am going to sell next year or if I have the necessary resources to produce what I am going to sell” New EVP
The task at hand was to develop and implement a global S&OP tool, which could be quickly spread throughout the company and put to use in a timely manner.
In this practical approach the S&OP tool stands for a sequential process that will in a first stage define and push the production of uniform sales forecasts from every BU and in a second stage define and push the production of uniform operations plans based on the respective sales forecast. Being the whole process based in a centrally defined Excel IT tool.
The development of this tool was, in an initial stage, the result of a joint effort between Business Development (Sales) team and the Operations team. However after the initial research, the Sales team became responsible for the development of the sales part of the S&OP tool and the Operations team became responsible for the development of the Operations part of the S&OP tool. This paper will be focused on the first stage in both parts of the tool. In the second stage, after the split between Sales Planning and Operations Planning, it will mainly be focused in the Operational Planning process development and implementation, tapping into the Sales Planning tool´s history only to justify or explain events in the operational side.
| P a g e 29
4.2.1 Assessing the initial situation
Before developing the tool in itself it was imperative to understand the degree of maturity the company had on this theme. This line of action goes in line with the approach defended in some of literature on this subject (Lapide 2005). To get this knowledge an internal research was conducted. The main questions that this research needed to answer were:
1. How is activity planning seen and done within the company? 2. Does activity planning occur within each BU or is it a group effort?
3. Are there already any S&OP tools or similar initiatives in place, even if working only in a regional level?
To gather this information multiple sources were used. Regional and global databases were analysed and multiple engineers and managers were consulted. When possible, one-on-one contact methods like interviews or phone calls were used, however due to time and geographic limitations most of the research was done via email.
When using the S&OP process the objective, from an operational point of view, is to match supply and demand by assessing the capacity of each BU and matching it to the demand from the market (Grimson and Pyke 2007). In other words the objective is to find the most profitable match between the amount of engineers/ capacity and the amount of monthly project-related task for the next 12 months.
The whole process takes place at capacity planning level and does not encompass the resource management level. The relevant difference between this two concepts is that while capacity planning strives to make available the amount of resources necessary for the tasks at hand during the analysis timespan, recourse management strives to define what task each resources should execute in the analysis timespan.
The objective was not to determine what task each engineer should do each month, that is resource management and it falls outside of the S&OP objectives defined by company. Additionally is also relevant to mention that this tool will only consider working hours
| P a g e 30
that can be attributed to a project, the further business development work or “overhead” will not be considered in the S&OP tool.
With the previous principles in mind the results of the internal research were: 1. How is activity planning seen and done within the company?
Although some level of planning was done, the general perception was that planning was a difficult task in the Oil and Gas industry. Efforts were focused in reacting quickly to changes instead of predicting them. Each BU would focus on planning for the work they are executing or that they are almost certain that they will execute in a very short period of time. Only marginal efforts were made to get ready for possible work to be won in the future.
“(…) have you seen the crystal ball we have in the entrance of the build? Have you seen the holes in it? So that is how we see our future. It isn’t easy to fill those holes.” Project
Manager
“It is easy to tell us to plan better. But reality is different (…)” Operations responsible
The information gathered pointed that planning was not a totally cross-functional exercise within each BUs and tended to focus in a more resource management approach than in a capacity planning approach. Furthermore during this internal research the first major problem was unveiled, each BUs used its own metrics (hours, activities, etc) and timespan when planning. This made any attempt to aggregate and cross the available information futile.
2. Does activity planning occur within each BU or is it a group effort?
The data collected indicated that although a joint strategy was already defined by management. In general each BU did its own planning independently and each BU´s functions operated individually. This type of behaviour was the results of the silo mentally advocated by the BUs. Such a mentality type of mentally does not accommodate initiatives such as S&OP where cooperation and cross-functional integration of plans is essential. This independent way of thinking and planning might
| P a g e 31
have its roots in company policy, structural organization or misalignment of incentives (Oliva and Watson 2009, Shapiro 1977).
Previously each BU was evaluated individually an on the amount of business executed. This evaluation system might have lead to a misalignment of incentives, since BUs were indirectly pushed to not help each other since this would ultimately use up some of their resources in something that does not contribute directly to the increase of the amount of business executed.
With the new management team this evaluation method changed and some conjoint strategic initiatives like cross BU support for specific projects seemed to be starting to take their first steps, however making such a big cultural change is not a fast process. (Oliva and Watson 2009, Shapiro 1977)
3. Are there already any S&OP processes or similar initiatives in place, even if working only in a regional level?
From the data retrieved, no formal mature S&OP process was identified in any of the BUs. Nevertheless every BU had its own (and distinct) resource management IT tool and process. This fact only increased the complexity of the problem previously identified. Not only each BU uses different metrics and timespan during their planning but also uses different IT tools and processes to do their planning.
Furthermore, an essential discovery was made. In one of the multiple meetings hold to discuss the S&OP planning it was found in the one of the BUs an excel-based tool that was used to plan the operational activity at a capacity level according to the BU´s sales forecast. Although still far from the final objective it showed some of the required features for an initial stage S&OP tool. It was decided at that point that this tool would be used as a starting point for the development and implementation of the S&OP process. Three pictures of this tool can be found in Annex 1.
After the initial assessment of the company regarding S&OP performance and processes, the management team decided that the better way to develop such process was to separate the S&OP process into two distinct processes each one with a dedicated team that would be developed in parallel. One of the teams would be responsible for the Sales Planning Part and would be under the Business
| P a g e 32
Development Function and the other team would be in charge of the Operations Planning and would be under the Project Execution Function.
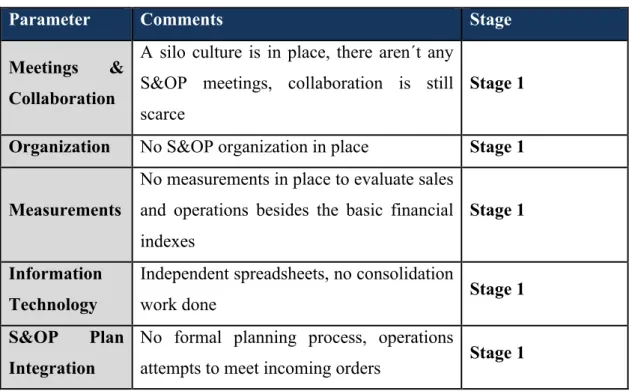
Maturity Evaluation – First Evaluation
Throughout the paper two maturity models will be used to evaluate the maturity of the S&OP process in the company. The objective of this exercise is to measure the evolution of the system throughout its implementation. This first evaluation intends to assess the maturity level of the initial S&OP process, prior to the work done by both Sales and Operations Planning teams.
Grimson and Pyke Model
Parameter Comments Stage
Meetings & Collaboration
A silo culture is in place, there aren´t any S&OP meetings, collaboration is still scarce
Stage 1
Organization No S&OP organization in place Stage 1
Measurements
No measurements in place to evaluate sales and operations besides the basic financial indexes
Stage 1 Information
Technology
Independent spreadsheets, no consolidation
work done Stage 1
S&OP Plan Integration
No formal planning process, operations
attempts to meet incoming orders Stage 1
According to the Grimson and Pyke Model the company is still in Stage 1 of the S&OP maturity process.
| P a g e 33 Lapide Model
Parameter Comments Stage
Meetings Sporadic meetings Stage 1
Process The process is still disjoint, supply and demand
are no aligned Stage 1
Technology Besides the rudimentary tool fond in NCS, no
other spreadsheets could be fond. Stage 0,5
When using Lapide´s model the results achieved are similar, the company is in initial stage of maturity of the S&OP process. In the “Technology” parameter the company is even before the Stage 1, since in some of the BUs no formal capacity planning IT tool was being used.
4.2.2 Building the Operations Planning tool
Predefined features and preliminary findings
While the initial research was being done, there were some attempts to develop an Operations Planning (OP) tool. The objective of the OP tool is to develop uniform and complete operational plans, which can be consolidated at a global level.
This was done since some of the future characteristics of this tool were already defined:
Meeting frequency
The whole S&OP process should occur every six weeks in an initial stage and after it matures the objective would be to reduce the time between S&OP round to four weeks. Two meetings would work as checkpoints in the S&OP process. The first the Sales meeting where sales personnel will define the BU´s sales forecast for the next 12 months, without any operations function input. A second meeting where operations personnel will draft the BUs operational plans based in the sales forecast produced in the first meeting.
| P a g e 34
Time Frame and spreading capability
To match the urgent time frame and spreading capability, this tool had to be used by all the BUs, required in this task the IT tool to be used as the base for the S&OP tool was predefined as Excel.
Excel was chosen as the support IT tool for this process because it is already used by every BU. Saving in this way the implementation time and compatibility issues, which is a relevant issue since some of the other tools available in the market can have implementation times of over a year. Additional with Excel is easy and quick to produce and change the type of templates needed for the S&OP process. This feature reduces drastically the time between prototypes, shortening in this way the whole trail-and-error process allowing a quicker implementation. However Excel was not designed to do this type of work, raising some questions regarding its compiling and graphic display capabilities in a more advanced stage.
Forecast Timespan
The forecast’s timespan was also pre-research defined as 12 months. This forecast length is considered to be ideal in the trade-off between forecast accuracy and business relevant information.
Display characteristics
Another pre-defined characteristic was that the S&OP tool needed to display, in a graphic way, the discrepancies between available capacity in each BU at each moment, and the requested capacity generated by the sales forecast of each BU. This was an essential characteristic in order to visually see if the match between the sales forecast and the operational capacity.
Process definition
The criteria used to define which projects/prospects to include in the OP tool was the last predefined feature. All the projects that are already booked and the “prospects that will most likely be won” should be accounted for in the tool and therefore efforts should be done to gather resources to execute them. This predefined feature was the base for the sales function to produce their sales forecast. However the definition of “prospects which will most likely be won” goes beyond quantitative measures and has a bit of “gut” feeling in it, therefore although some quantitative measures were in place the GO (likelihood of a project going forward) and the GET (likelihood of Aker Solutions Process Systems
| P a g e 35
winning the project) the final decision of what prospects are consider “prospects which will most likely be won” or not has to be done by the people working closely with the clients in this case the Sales Managers/BD Responsible in each region.
These first attempts to develop an Operational Planning tool stumbled in one of finding of the posterior research, the BUs used different metrics to measure work. Some focused in the amount of tasks needed to complete a job while others focused in the working hours needed. Additionally, these initial attempts also unveiled another discrepancy between BUs we can call it the third main problem, a project plan is divided in a set of disciplines under which activities or hours are accounted for. These disciplines can be seen as the recipe for the project and they include engineering disciplines like “Process engineering” or “Piping”, support disciplines such as “Doc Control” or “Cost” and Management disciplines for instance “Project Manager”. The problem was that each BU had its own set of disciplines and its own definition of what activities should be encompass under each discipline. The consequence of this problem was that the operations plans of each BU were done based in different set of rule and therefore not crossable. Furthermore due to this different set of disciplines and not crossable information done by the BUs, the Operations function can only assess both requested and available capacity locally. The function can not have a global vision of the capacity in the company.
In order to successfully mirror the capacity needs of the projects and to fulfil efficiently this needs, the Operations Planning tool had to have its own set of disciplines. This set of disciplines had to be universal and compatible with the specific set of disciplines used by each BU and would allow the consolidation of the several Operational plans.
The definition of this set of disciplines for the OP tool was the reason for the failure of these first attempts to develop a functional OP tool. The process used to define these disciplines did not give the expect results. The Operation team tried to start with one BU list of disciplines and then adapt it to a different BU by including extra disciplines when needed or including new definitions under each existing discipline. This resulted in long lists of disciplines with disciplines that only one BU used and disciplines with a too broad of a definition causing overlaps with other disciplines, not allowing the Operation team to
| P a g e 36
have a clear picture of capacity utilization or needs. Bottom line this bottom-up approach from BU to Operation team, did not produce any useful set of disciplines.
4.2.3 Building the Operational Planning tool – post-research approach
With all the knowledge gathered from the research and the preliminary attempts some further decisions were made.Since the Bottom-up approach used in the Set of Disciplines did not pay off, a new approach was used. The tool found in one of the BUs during the preliminary research was fully adopted and the it´s set disciplines used as the basis for the new set of disciplines. As mentioned previously, this tool filled a lot of the requirements already defined for the OP tool, it was Excel based, it was adaptable to a 12 month timespan and it had a complete graphic way to present the resources available and resources required. The objective would be to adopt a top down approach, now the OP team would define the set of fixed discipline and push it down, forcing the BUs to comply. This approach although more disruptive to business in the short term, since all the BUs would have to change their own planning process, would in the long-run solve the set of disciplines problem and allow the OP team to have a greater understanding and control of the set of disciplines since they were the responsible for defining it.
Although this tool was been used successfully in this specific BU it did not encompass all of the aspects that an S&OP tool should, therefore it had to be adapted and completed in order to be successfully deployed in the other BUs.
In order to make the tool found appropriated to the S&OP process the following changes were done:
• Uniform and accurate operational plans – The set of disciplines present on the tool was updated and completed by the OP team in order to enable the BUs that will use the tool to produce a uniform and accurate set of operations plans. Furthermore it was essential to define a uniform metric to assess the amount of work under each discipline. As mentioned before, each BU at this point used different ways to measure work, some did it in hours other in activities. To solve
| P a g e 37
this problem the OP team selected a metric that should be adopted and used by every BU. The selected metric to be use in the Operations Planning Tool was
“Full Time Equivalents” (FTE). This choice was made based on two important
reasons, the first one was that this measuring method is a good operational fit for the tool since it bypasses problems like different number of hours worked per month (in Brazil the work month has 176 hours, while in Norway it is around 150). The second reason is of a more political nature. Since every BU had its own different metric system, choosing one of the already in use metrics will seem that the OP team favours one of the BUs. So by choosing FTE, that no one used, this problem is avoided. This decision aimed to solve the second big problem identified, since now the metric used was common to every BU.
• Adapt the tool to the Sales forecast principles – In order to be able to use the Sales forecast as a base for the operational plans it was necessary to change some of the notations used in the tool. The original template used “Budgeted Projects” as the projects to be inserted in the tool. This notation was substituted by “Priority
Prospects” since “Budgeted Projects” stand for projects included in the annual
budget, not accounting for sales forecast updates such as new projects and shifts on GET and GO. With the new “Priority Prospects” all of the prospects, which will most likely be won, are included. The goal of this change was to strengthen the link between the sales forecast and the operations plans, by pushing the operations side to start gathering resources for projects that are likely to be own, even if not included in the budget.
After upgrading the tool it was also crucial to develop other complementary sub-tools, since the Operations Planning only covered the BU´s needs of resources and resources capacity. With the Operations Planning tool as a base the Operations team develop a Project focused sub-tool called “Project Plan Template”. This sub-tool would allow each BU to assess the capacity needs of a individual project according to the S&OP principles and simplify the population of the Operations Planning tool. Additionally a group-focused sub-tool called “PRS Resource Plan” was also developed. Its objective was to
| P a g e 38
consolidate all of the BUs OP tools, this consolidated template would allow the management team to have an overview of capacity required and capacity available globally and to which extent is operations plans matching the sales forecast at a global level.
With the tool in place the Operation team felt it was safe to “push” down to the BU and start implementation. The following presentation was also attached to email sent to the BUs. The objective of this presentation was to explain how to use the tool and to make clearer the objective of the all S&OP exercise
4.3 Implementation of the Operations Planning tool
A successful implementation of the S&OP process, according to the literature, is three-folded. Business culture needs to change since, now every function and every BU need to work together. Business processes needs to change, the way of doing things needs to change to accommodate the S&OP cross-functional planning and the reporting methods. Finally the IT support tool needs to be adapted and put into use (Lapide 2005, Grimson and Pyke 2007, Oliva and Watson 2009, Shapiro 1977). In this practical case, the implementation process followed to a great extent the theories studied. In order to evaluate the success of the implementation the S&OP team defined four practical dimensions (described below). In a posterior analysis it is possible to see that these four dimensions used in this practical case can be associated to the three dimensions used in the studied theoretical papers.
• Correct Sales forecast –To be successful, each BU has to be able to include in their Sales forecast, all of the projects they should be planning for with the correct starting date. The BU´s sales representative in the Sales Planning Meeting should transfer this information to the Operations Planning Team. This dimension can be linked to both Business Process and IT theoretical implementation dimensions, since it is a process-defining dimension and it assumes IT capabilities that will allow the execution of such a task.