1
Mergers & Acquisitions:
The Case of Microsoft and Nokia
Luís Franco Hilário
Advisor: Peter Tsvetkov
Dissertation submitted in partial fulfillment of requirements for the degrees of MSc in Business Administration, at the Universidade Católica Portuguesa
2
Abstract
Due to the financial downturn and the emergence of new devices in the global handset market has led companies to change their business strategies. Indeed, Mergers and Acquisition are considered one of the best strategies to increase shareholder value despite its hardship to be well-implemented. For this reason, a consolidation between Microsoft and Nokia may create new opportunities to challenge the market. Thereby, the focus of this dissertation will be the calculation of the additional value created by combining both firms bearing in mind the companies’ financial situations. All this considered, Nokia’s average share price during the last year is considered to have a 0.14% upside potential and synergies are estimated around 13% of Nokia’s average market capitalization. As a result, an offer at 19.4% premium over Nokia’s average market capitalization will be suggested with 100% in cash.
3
Acnowledgments
The author would like to thank: Professor Peter Tsvetkov, the Dissertation Advisor, who has provided several thoughtful comments and an immeasurable help throughout the thesis. ; his friends, who provided assistance and feedback by detecting and reporting errors; finally to his family for their forbearance and support.
4 Table of Contents 1. INTRODUCTION ... 7 2. LITERATURE REVIEW ... 8 2.1 Valuation Methodologies ... 8 2.1.1. Cash-Flow Approaches ... 10
2.1.1.1. The Cost of Capital ... 11
2.1.1.1.1. Risk-Free Rate ( ) ... 13
2.1.1.1.2. Beta (β) ... 13
2.1.1.1.3. Market Risk Premium ( ) ... 15
2.1.1.2. Free Cash Flow to the Firm Model ... 15
2.1.1.2.1. Terminal Value ... 16
2.1.1.2.2. Expected Growth Rate ... 17
2.1.1.3. Adjusted Present Value (APV) ... 17
2.1.2. Relative Valuation ... 20
2.2. M&A related issues ... 22
2.2.1. Main types of M&A ... 22
2.2.2. Synergies - “The creation of value”... 24
2.2.3. Cross-Border M&A and Emerging Markets ... 25
2.2.4. Methods of Payment ... 27
2.2.5. Post-acquisition Returns ... 28
2.3. Conclusion... 30
3. INDUSTRY AND COMPANY ANALYSIS ... 31
3.1. Overview of the Global Mobile Industry ... 31
3.1.1. Current Market Trend – “The emergence of the tablets” ... 37
3.1.2. Technology market growth opportunities in Asian economies ... 38
3.2 Microsoft Corporation... 39
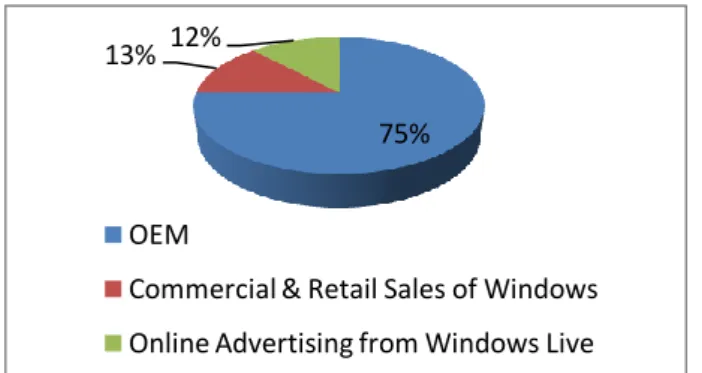
3.2.1. Windows and Windows Live Division ... 42
3.2.2. Server and Tools ... 43
3.2.3. Online Services Division ... 45
3.2.4. Microsoft Business Division ... 46
3.2.5. Entertainment and Devices Division ... 47
3.3. Nokia Corporation ... 49
3.3.1. Devices & Services ... 52
3.3.2. NAVTEQ ... 53
3.3.3. Nokia Siemens Networks ... 54
4. PERFORMANCE OF BOTH COMPANIES IN THE STOCK MARKET ... 56
5
6. PERFORMANCE FORECAST ... 60
6.1. Microsoft’s Standalone Valuation – Base case scenario ... 60
6.1.1. Revenues ... 61
6.1.1.1. Windows & Windows Live Division ... 61
6.1.1.2. Microsoft Business Division ... 62
6.1.1.3. Server and Tools ... 62
6.1.1.4. Online Services Division ... 62
6.1.1.5. Entertainment and Devices Division ... 63
6.1.2. Operating Expenses ... 63
6.1.3. Assets, Liabilities and Equity... 65
6.1.4. Net Working Capital ... 65
6.1.5. Capital Expenditures ... 65
6.1.6. Financial Leverage and Cost of Capital ... 66
6.1.7. Sensitivity Analysis ... 68
6.1.8. Multiples Valuation ... 68
6.2. Nokia’s Standalone Valuation – Base Case Scenario ... 69
6.2.1. Revenues ... 70
6.2.1.1. Devices and Services ... 70
6.2.1.2. NAVTEQ ... 71
6.2.1.3. Nokia Siemens Networks ... 71
6.2.2. Operating Expenses ... 71
6.2.3. Assets, Liabilities and Equity... 72
6.2.4. Net Working Capital ... 73
6.2.5. Capital Expenditures ... 73
6.2.6. Financial Leverage and Cost of Capital ... 74
6.2.7. Sensitivity Analysis ... 74
6.2.8. Multiples Valuation ... 75
7. VALUATION OF THE MERGED ENTITY ... 76
7.1. Valuation of the Merged Entity without Synergies ... 76
7.1.1. Revenues ... 76
7.1.2. Financial Leverage and Cost of Capital ... 77
7.2. Synergies ... 77
7.2.1 Cost Synergies ... 78
7.2.1.1. Cost of Revenues ... 78
7.2.1.2. Sales & Marketing, General & Administrative and R&D ... 79
7.2.1.3. Employee Severance ... 79
7.2.1.4. CAPEX ... 79
7.2.2. Revenue Synergies ... 80
7.2.2.1 Windows and Windows Live Division and Nokia Siemens Networks ... 80
7.2.3. Integration Costs ... 80
7.3. Valuation of the Merged Entity with Synergies ... 81
6
8. THE ACQUISITION PROCESS ... 83
8.1.Type of Acquisition ... 83 8.2. Synergy Benefits ... 83 8.3. Premium Offered ... 84 8.4. Method of Payment ... 84 8.5. The Proposal ... 85 9. CONCLUSION ... 86 10. APPENDIXES ... 87 11. BIBLIOGRAPHY ... 109
7
1. Introduction
The aim of this dissertation is on Mergers & Acquisitions processes where two firms will be presented and analyzed exhaustively, demonstrating at the end, the main reasons justifying the consolidation between them. Further, these two companies are Microsoft and Nokia, two well-known and recognized technology enterprises operating in the Mobile Industry.
This dissertation provides a deep theoretical analysis, followed by a practical analysis taking into account the companies’ historical standalone situation. Thereby, the Literature Review will contemplate the existing academic literature about the M&A topics.
Furthermore, an Industry and Company analysis will be provided, describing the historical background of the industry and current trends. Additionally, each one of the companies will be described: their main segments, financial indicators and performance in the stock market.
Afterwards, a performance forecast of both firms will be computed, translating the Microsoft’s and Nokia’s information into numbers. The following section will focus on the valuation of the merged entity, defining the main sectors where an additional value is expected to arise.
Lastly, after the consolidation benefits calculation, an acquisition offer will be proposed. Indeed, it is in this section that a proposal will be defined with the main goal of being positively well-perceived by the markets.
8
2. Literature Review
Being the main goal of a company which starts negotiating in a market is the creation of value to the shareholders, has led organizations to start looking at different forms of creating and at the same time, increasing the value. Among a set of strategies, Mergers and Acquisitions were considered as a coherent and sophisticated strategy, allowing creating value not only for the acquiring company, but also for the target company. Nevertheless, the positive consequences resulting from those corporate mergers are far from clear. The players on the takeover project usually underestimate the potential benefits from M&A, and therefore the additional value originated by the combined entity is usually scarce since it is incorrectly estimated (Damodaran, 2005), destroying consequently shareholder value rather than increasing it.
Damodaran (2005) defines synergy as the additional value generated by combining two entities, which create opportunities impossible to achieve operating each one independently. Moreover, problems and errors on the value estimation affect directly the firms’ resources allocation which is a key driver of an organization performance (Luehrman, 1997). Thus, the best form to minimize those biases is firstly, value both companies independently, then values the combined organization, as the sum of the values computed initially, and finally values the combined firm with the synergies that will be created due to the takeover.
The following describes the organization of this Literature Review: the first section is composed by the Valuation methods, which describes the Cash-flow approaches and the method of “comparables” (Relative Valuation); the second section includes M&A topics and related issues, as Synergies, types of M&A, Cross-border M&A and Emerging Markets, Methods of Payment and Post-acquisition returns.
2.1 Valuation Methodologies
According to Copeland, T. et al (1990), “financial valuation is indeed central to setting business strategy”. In fact, the firm’s value estimation is for general managers and financial experts an important step to determine how well their firms allocate resources and take strategic decisions based on those values (Luehrman, 1997), in a word, valuation knowledge is basically a requisite for a participation in a firm’s resource allocation choices (Myers, 1974). Based on the sizeable “portfolio” of existing valuation approaches, each organization should adopt the valuation method that better matches its
9
current situation, information available and its future perspectives of growth. Albeit, it is also important to highlight the fact that some valuation approaches create the same results under certain assumptions as it is the case reported by Oded, J. (2007) on which, the four discount cash flows approaches lead to the same value for companies that rebalance their debt. Welch (2004) considers the coherent and unbiased analysis of the company capital structure and capital structure changes a way to increase the likelihood of adopting the correct valuation method.
As a consequence, under the Financial Literature is unanimous the existence of two large groups of methods to estimate value: the Discounted Cash-Flow approaches (DCF), as the most accurate and flexible method for valuing organizations (Goedhart, M. et al, 2005) and the Valuation by Multiples (Relative Valuation) which can generate insights into specific drivers creating value in the industry (Lie and Lie, 2002). Jointly, Young, M. et al (1999) go further and distinguish those approaches in terms of spotlight: focus on Equity Values and focus on Enterprise Values. The distinction between them it is easy to highlight. While the first method focus on Equity Values computes only the value of Equity, on the other hand, methods focus on Enterprise Values compute the value of Equity plus the value of Debt.
Besides this distinction, it is primordial to analyze and distinguish each Valuation Method mentioned above. Starting with the Discounted Cash-Flow methodologies, these approaches imply forecasting future cash-flows and discounting them to their present value at a specific and proper rate which reflects their level of risk (Luehrman, 1997). At the same time, the most common DCF approach is to discount the future cash-flows by the weighted average cost of capital –WACC- (Kaplan and Ruback, 1996). According to Oded, J. (2007), there are four cash-flow methods to value a company: Adjusted Present Value (APV), Capital Cash Flows (CCF), Cash Flows to Equity (CFE) and Free Cash Flows to the Firm (FCFF). The only three differences between them are: which cash flows are discounted and; at which discount rate and how the interest tax shields associated with the debt financing are valued. Some authors as Goedhart, M. et al, (2005) claim DCF analysis delivers the best valuation results.
In turn, the Valuation by Multiples requires the computation of specific multiples for a set of benchmark and similar companies and therefore finding the company’s assets
10
value based on these benchmark multiples (Lie and Lie, 2002). The point in this approach is the choice and application of the correct and accurate multiple (Goedhart, M. et al, 2005).
However, Kaplan and Ruback (1995) conclude that “there is no obvious method to determine which measure of performance…is the most appropriate for comparison”. In response to the accurately estimation of the firm’s cash flows through DCF methodologies, Lie and Lie (2002) affirm that DCF analysis is frequently left behind in favor of Relative Valuation, and the Valuation by Multiples provides the lowest valuation error (Koeplin, Sarin and Shapiro, 2000). There is also another valuation method which will not be approached here – Return-Based method – on which the value of an asset is the differential between return and cost of capital (Damodaran, 2002), as it is the case of Return on Equity and the Economic Value Added (EVA).
Besides this distinction, Luehrman (1997) also refers to a tool for valuing opportunities – Option Pricing Theory – considering an “opportunity is analogous to an option, where you have the right to buy or sell at a certain price” and on which the asset’s value depends on a future event. Thus, it should be viewed as a supplement to the DCF methods and not as a replacement. Taking into account the strengths and weaknesses of each method, which will be deepened farther more in detail, even though it is essential to refer the most reliable value estimations are the result of combining both methods together (Kaplan and Ruback, 1996). Thereby, the present analysis will be focused on FCFF, APV and Multiple methodologies.
2.1.1. Cash-Flow Approaches
A valuation based on discounted cash flows starts with the estimation of the nominal and real future cash flows (Luehrman, 1997), and it is also in this initial phase where the valuation errors usually appear (Damodaran, 2002) due to the expectations about the growth rates, return on invested capital and growth periods, which may be scattered. In many cases as Damodaran (2002) shows, for purposes of simplicity the cash-flows are forecasted for a limited period of time and expected to grow at a constant nominal rate in perpetuity. This assumption is quiet important, seeing that every increase in the
11
horizon of the valuation reduces the valuation errors allowing consequently to a better corporate performance (Ohlson and Zhang, 1999).
The second step of this methodology refers to determine the proper rate on which cash flows will be discounted. Since each cash flow has a level of risk which directly implies the use of a distinct discount rate, we must do assumptions to estimate the correct cost of capital, which is usually, computed using the Capital Asset Pricing Model (Kaplan & Ruback, 1996).
2.1.1.1. The Cost of Capital
The process of estimation the cost of capital is one of the most critical inputs in many corporations as many companies operate in several industries (Kaplan & Peterson, 1998). Copeland, T. et al (1990) consider it as the opportunity cost of investing in a similar risk-project. Moreover, the cost of capital can be provided by specific financial tools (debtholders) as bonds, securitization, hybrids, bank debt and convertibles (Shivdasani & Zak, 2007). In order to compute the correct cost of debt capital, this is a result of the risk-free rate plus a default-risk spread depending on the firm’s probability of default. On the other hand, it can also be provided by equityholders, in spite of the approaches to compute the correct costs of equity capital being less consensual. Indeed, among the various existing theories about the estimation of the cost of equity, the most commonly-used is the Capital Asset Pricing Model (CAPM). According to Kaplan and Peterson (1998), the CAPM defines linear relationship between the cost of equity and the slope coefficient (beta) in a regression of the company’s equity returns, in other words, the CAPM embodied by Sharpe (1964), Lintner (1965) and Black (1972) conclude that the return of an asset is the sum of the risk-free rate and the risk-premium, which depends on beta. However, the use and adequacy of the CAPM in practice has been questionable by some authors. For instance, Fama and French (1996) argue that the main implication in market equilibrium of this method is that, the “value-weight market portfolio is mean-variance-efficient”, in a word, beta explains the expected return and for a beta risk there is a positive expected premium. Ferson and Locke (1998) claim that improving the procedures on the estimation of market risk premiums would allow a superior cost of equity estimation rather than using the CAPM.
12
Despite the distinction mentioned above, firms prefer debt instead of equity when receiving returns because a rise on the debt ratios reduce the probability of its shareholders being compensated in a potential situation of financial depression. As a consequence, the cost of unlevered equity must be lower than the cost of levered equity.
The expected returns implied by the CAPM for the Unlevered and Levered firm are described below:
where is the risk free rate, is the firm’s unlevered beta or systematic risk, is the firm’s levered beta, and is the risk premium required by investors to invest in a firm with the same level of β as the stock market, or market risk premium.
As we have mentioned above, one of the commonly-used discount rate in cash flow calculation approaches is the tax-adjusted discount rate or weighted average cost of capital (Kaplan & Ruback, 1996). According to this “method”, WACC represents a weighted average of the after-tax costs of different sources of capital (equity and debt), in which each one is weighted by the fraction of the capital structure it represents (Luehrman, 1997). Albeit, this approach has been questioned by several authors; for instance, Kaplan and Ruback (1996) argue that a correct WACC practice is hard to achieve due to the cost of capital being recomputed each period as a result of changing leverage over time, making this approach too exhaustive. In turn, the use of this model in a constant growth context implies certain assumptions with regard to the discount rates to be used in computing the tax shields (Massari, M. et al, 2007).
In fact, the WACC methodology considers that capital structure is rebalanced which implies that when future asset values are uncertain, the value of future debt tax shields will be also uncertain (Miles & Ezzell, 1980). On the other hand, the more complex a company’s capital structure and tax position is, the more likely it is that errors in estimation will occur (Luehrman, 1997). For example, Welch (2004) argues that the main determinant of capital structure is the stock returns. Moreover, there is also a
13
tendency to use book values rather than market values in the estimation of the capital structure, which becomes WACC an old fashioned measure (Luehrman, 1997).
Below it is presented the WACC formula:
where is the cost of equity and is the cost of debt, E is the equity and D the debt, and is the corporate tax rate.
Indeed, WACC’s main advantage is that it bundles the two sources of capital together in order to discount them only once (Myers, 1974), but given the set of complexity presented on the capital structure of firms today, WACC has been increasingly replaced by other methods (Massari, M. et al, 2007).
2.1.1.1.1. Risk-Free Rate ( )
Oded, J (2007) defines the first element of the CAPM Model as the expected return on investment without default risk, which is the same of saying when β is zero, the cost of equity (either levered or unlevered) is equal to the risk-free rate. Moreover, Copeland, T. et al (1996) conclude that the application of the long-term Treasury bond yield in terms of maturity for the computation of the risk-free rate in the cost of capital calculations permits a consistent and correct valuation on which risk-free rate is somewhat less dependent on inflation.
2.1.1.1.2. Beta (β)
The second element of the CAPM Model is according to Damodaran (2002) a measure of exposure to the systematic risk of the stock. Kothari, S. et al (1995) concluded that the higher is β, the more negative effects market shocks will create. Firstly, as a way to increase precision, it is common to estimate the beta of a group of firms operating solely in the same industry as the firm who is being valued. Nevertheless, betas may also differ
14
across firms within an industry (Kaplan & Peterson, 1998). Consequently, several approaches have appeared for the estimation of the systematic risk.
Kaplan and Ruback (1996) propose valuations using three measures of betas: a firm-based measure, an industry-firm-based measure and a market-firm-based measure; the latter basically assumes the systematic risk for all the firms analyzed equals the risk of the market assets. Meanwhile, Kaplan and Peterson (1998) propose an average beta for the industry (industry-based measure) in order to avoid errors. The methodology that will be approached will be thereby an industry-based measure, on which will be only accounted corporations with the same growth, size, cyclicity, gains and leverage levels.
According to Kaplan & Peterson (1998), the first step should be the calculation of the firms’ betas operating in the same industry followed by the computation of the weighted average of all values (called “Industry betas” by Kaplan & Peterson, 1998). Afterwards, a cross-sectional regression of betas against the industry percentages is computed and a “Market-capitalization-weighted industry betas” is achieved. According to Berk (1995), it is also extremely important to come up with a relation between beta and market capitalization. Indeed, Berk (1995) concludes that firms with higher risk have smaller market capitalizations due to the extra risk premium incorporated on the discount rate of those firms.
Below it is presented the firm’s levered beta:
Furthermore, as Kaplan & Peterson stated, the betas of individual business units cannot be calculated using historical return information and additionally, firms are constantly changing its capital structures, thus beta is mandatorily changing too. In order to overcome that limitation, betas should be calculated on the basis of published estimates of the firm’s unlevered beta for the industry in question (Copeland, T et al, 1990).
15
2.1.1.1.3. Market Risk Premium ( )
The last parameter that remains to be estimated in the CAPM model is the market risk premium which represents the difference between the expected return on the market (Rm) and the risk free rate (Rf) mentioned above (Oded, J., 2007). It depends on the levels of liquidity, information availability and the economic environment (Damodaran, 2002). Moreover, the computation of the market risk premium should use the arithmetic average historical risk premium (Kaplan & Ruback, 1996). Additionally, Koller, T. et al (2005) consider that the historical risk premium for a mature equity market is nearly 4,5 percent.
In fact, the importance of the expected market returns leads to the use of the most representative equity market due to the inability to compute the market portfolio. According to Damodaran (2002), a good index is the one which includes the highest number of securities (seen the wide equity market), assuming they are market weighted. As Fama and French (1996) refer, one of the main limitations of CAPM is mainly due to miscalculations of market portfolio. Therefore, a good approach to avoid such errors is the one mentioned by Damodaran (2002), on which, the default spread affiliated with the country rating has to be multiplied by the average of equity to bond market volatility and then added to the historical risk premium.
2.1.1.2. Free Cash Flow to the Firm Model
According to Kaplan & Ruback (1996), the Free Cash-Flow to the Firm Model (FCFF) is “the most commonly-used DCF approach, on which the value of a leveraged firm can be calculated by discounting the unleveraged cash flows to the firm at the firm weighted average cost of capital (WACC).
Thus: Firm Value =
16
Indeed, this formula is composed by two stages: the first is computed the present value of cash-flows up to some preselected horizon date (n), which according to Ohlson & Zhang (1999) is rarely superior to 15 years; and the second is calculated to the present value of cash-flows beyond the horizon date referred as the terminal value (TGR represents the terminal growth rate).
Moreover, other authors such as Damodaran (2005) values the FCFF model as the amount of cash earned by a company after paying all taxes, expenses and reinvestment needs, but before dividends and interests to debtholders or equityholders.
Below is presented the FCFF model according to Damodaran (2005):
FCFF = EBIT (1-T) – Capital Expenditures + Depreciation – ΔNWC ± other Non cash items
Once again, it is essential to refer that these cash-flows must be discounted at the firm WACC (Massari, M. et al, 2007), which is the discount rate that adjusts for the tax effect. Next, it will be analyzed the following two FCFF parameters: the Terminal Value and the Expected Growth Rate.
2.1.1.2.1. Terminal Value
After the computation of the operating cash-flow plus and/or minus the investment effects up to a certain point in the future (Luehrman, 1997), it is required to execute the second stage of this methodology: the present value of cash-flows beyond the horizon date (Terminal value). The terminal value is thereby, the capital cash-flow in the last forecast year (terminal year) and then adjusting it for the difference between cost of capital and expected growth rate (Damodaran, 2005).
Thus,
Terminal Value =
17
In fact as formula shows, the Terminal Value is very delicate to possible changes in the expected growth rate and in the cost of capital (Oded, J., 2007).
2.1.1.2.2. Expected Growth Rate
While Kaplan & Ruback (1996) argue that terminal cash-flow grow at a constant nominal rate in perpetuity, assuming that Depreciation is equal to Capital Expenditures in the capital cash-flow in the terminal year, Copeland, T. et al (1990) claim the importance of the growth factor in obtaining the enterprise value, and mandatorily in the WACC. Hence, the Expected Growth rate is the product of the Reinvestment rate (RR) multiplied by the after-tax return on capital (ROC) (Damodaran, 2005).
Thus:
RR =
ROC =
Concerning to the Terminal Growth rate (TGR) stated above on the firm’s value formula, Damodaran (2005) also argues that no organization can grow faster than its current economy in the long-term period. Consequently, TGR at a constant rate shall be computed as the real or nominal expected growth rate of the economy’s GDP depending on whether the cash-flows will be included or not on the inflation parameter on its computation.
2.1.1.3. Adjusted Present Value (APV)
The APV approach, often called “valuation in parts” suggested by Myers (1974), besides being less susceptible to valuation errors than the traditional WACC, it also computes how much a firm asset is worth and where this value comes from (Luehrman, 1997). Indeed, Myers (1974) argues that the valuation of a firm’s assets is the sum of
18
two categories of cash-flows: the real cash-flows (revenues, cash operating costs, capital expenditures) related to the business operation; and the “side effects” associated with the financing program (interest tax shields, cost of financial distress, subsidies, hedges, issue costs and agency costs). In a word, the first part of this technique can be considered as the value of an all-equity firm, while the second piece can be considered as the value added by a firm’s choice of capital structure (Kaplan & Ruback, 1996). Nevertheless, it is also important to highlight that the value of all financing side effects might introduce excessive complexity to this method and for this reason, because often mostly are disregarded, paying attention only to the interest tax shields (Damodaran, 2005).
Therefore, the first task on the APV model consists of the firm business valuation as if it was financed entirely with equity (unlevered firm). Thus:
Value of the Unlevered Firm (Vu)
=
As it is shown, the procedure is precisely the same as the FCFF model; the only difference reports to the applied discount rate: in this case, it is used the unlevered cost of equity ( ) rather than the WACC.
The second task on the APV approach is related to the value associated with the financing program that firm expects to use. According to Luehrman (1997), the net effect of the financing program value should be positive, otherwise, the company would use solely equity financing. As a result of a company will hardly be financed entirely with equity, so the Value of the Tax Shields (VTS) is described below:
Value of Tax Shields =
where represents the net debt, represents the levered cost of equity, represents the corporate tax rate, and g represents the perpetual tax shield growth.
19
Luehrman (1997) highlights that interest tax shield normally appear as a consequence of interest payments which are deductible on the corporate tax return. Moreover, the same author pays attention to the fact that in the long-term period as the indebtedness grows at the same rate as the firm, thus, g will be equal to TGR (terminal growth rate). Regarding the discount rate used in the model, Myers (1974) and Luehrman (1997) argues that tax shields should be discounted using the cost of debt as a discount rate because firms almost defaulting are unable to use tax shields in spite of their ability to pay interest. However, Milles & Ezzel (1980) have an opposite point of view, giving relevance of using the cost of equity as the appropriate discount rate.
As a result of those two assessments, it is plausible to add the probability of firm default to the cost of debt in order to reach a rate that reflects riskiness, as from Luehrman’s point of view (1997), tax shields are more risky than debt itself.
Besides the value of interest tax shields, there are other important side effects which can also be added or subtracted to the all-equity firm value, namely the value of a firm in case of distress (CFD). Thus:
Cost of Financial Distress =
In practice, CFD represents the product between the values of and unlevered firm ( ) and the percentage of loss in a company’s value (Damodaran, 2005). Meanwhile, this percentage is highly variable across industries, that Andrade & Kaplan (1998) argue to be on average a value between 10% and 20%.
Thereby, as Myers (1974) claimed, the final task refers to add all the parts together and then, we get an estimate of the APV methodology.
Firm Value = + [1 - P(D)] VTS – [P(D) CFD]
Once again, the VTS must be multiplied by the probability of no default inasmuch VTS only exists while a firm is operating, and similarly, the CFD has to be multiplied by the probability of default.
20
According to Luehrman (1997), APV is highly helpful in the valuation of cross-border takeovers, although the use of the correct valuation approach depends on the nature of a firm’s capital structure (Kaplan & Ruback, 1996). Indeed, the APV represents a model which can incorporate easily the impact of dividend policy, or even transaction costs in financing, and is extraordinarily transparent concerning in adjustments to the discount rate (Myers, 1974).
Notwithstanding, the APV concept presents certain handicaps: first of all, the income from stocks can be taxed in a different way, when the investor files a personal tax return; in addition, analysts usually ignore the use of other financing side effects in order to avoid complexity in getting the APV estimation (Luehrman, 1997). For this reason, Kaplan & Ruback (1996) proposed a new APV technique called “Compressed APV” as an upgrade of the traditional APV method, in which the all-equity discount rate is applied to the whole firm’s expected capital flows, either the real cash-flows, or the side effects.
2.1.2. Relative Valuation
Even though the DCF methodologies computed the most reliable estimations, the use of multiples provided the smallest valuation errors (Kaplan & Ruback, 1996). To this extent, it becomes essential to analyze the use of Multiples valuation in the estimation of the corporate value. Relative Valuation focus on what the market expects a firm’s ability to create profit to be based on its position against similar firms operating on the same industry around the same time (Koeplin, Sarin, Shapiro, 2000). In practical terms, enterprise value estimation starts by finding a set of comparable transactions and then calculate such transaction multiples of several relevant financial parameters, such sales or earnings. Finally, the estimated multiple is applied to the values of those parameters for the firm which is being valued (Kaplan & Ruback, 1996). Nevertheless, the success of such method is inherent to the ability in identifying transactions that shows specific characteristics such as, risk, growth rate, capital structure, size and liquidity, which are closely related to those of the firm which is being valued. Thus, the correct choice of comparable companies and the use of the right set of multiples are essential to prevent misunderstandings (Goedhart, M. et al, 2005).
21
According to Koeplin, J. et al (2000) and matching with Goedhart, M. et al (2005) main findings, a firm with similar size and timing of cash-flows, as well as, growth, leverage and risk levels is considered a suitable comparable firm.
Notwithstanding, such comparable firm is only possible to meet in the same industry or business segment (Lie & Lie, 2002). Hereupon and according to Alford (1992), the first task should be the definition of a firm’s business segment through a four-digit SIC code (Standard Industrial Classification), which identifies in what industry a certain company belongs to. Furthermore, from the portfolio of companies selected, it is essential to focus on those with similar ROC and growth expectations (Goedhart, M. et al, 2005).
The second half of this methodology concerns to the selection of the correct set of multiples. Indeed, a good multiple is the one which is difficult to manipulate through leverage and which describes the firm’s capacity to create profits as well (Goedhart, M. et al, 2005). At the same time, the superiority of enterprise-value multiples (as enterprise-value-to-EBITDA multiples) over equity-value multiples (as Price-earnings multiples) is evident, since the latter is directly affected by changes in the capital structure, while the former is not affected by depreciation effects, although some analysts have used both (Kaplan & Ruback, 1996). Moreover, enterprise-value multiples should also be adjusted for non-operating items, like excess cash, employee stock options, operating leases and pensions (Goedhart, M. et al, 2005). In addition, another recommendation presented by the same author is the following: multiples should also be based on forecasted information if available, or on the latest information released.
Koeplin, J. et al (2000) consider four types of multiples valuation ratios based on EBIT, EBITDA, sales and book value, and in fact, the ratio results for public transactions were higher than for private transactions. Therefore, private firms sell at a discount relatively to similar public firms. Meanwhile, Lie & Lie (2002) reported that EBITDA multiples generated better estimates than EBIT multiples. According to Alford (1992) and Lie & Lie (2002), the accuracy and performance of estimates vary by firm size, profitability and the value of intangible assets in the firm, emphasizing that valuation by multiples
22
are more accurate for large (Alford, 1992) and financial (Lie & Lie, 2002) companies than for nonfinancial companies.
As it was referred above, companies with high intangible assets, as “Dot-com” enterprises, which have been recently created, with a lower sales percentage and negative profits, the use of nonfinancial multiples, such as website visitors or subscribers, on its own valuation may deliver better results (Goedhart, M. et al, 2005).
Of the presented multiples, there is no consensus as to which multiple performs the best results, even though they should be taken into account in any valuation process (Koeplin, J, et al, 2000).
2.2. M&A related issues
Despite the large wave of acquisitions since the late of 1990’s, according to Lajoux (1998) on average, takeovers have failed to generate value for those who invested and live up to the financial expectations of those transacting them. Indeed, an acquisition process, either domestic or cross-border deal requires a sequence of activities which are difficult to accomplish due to limited information and time, as well as, poor management of the whole process by the intervening companies (Jemison & Sitkin, 1986). Thereby, according to Very & Schweiger (2001), an acquisition process requires firstly, the identification and evaluation of potential target firms, followed by the election of the best targetable company and consequently starting the negotiation stage with their owners, managers and other stakeholders. Finally, the last step is related to invest in post-acquisition integration. Hence, this section will address the main types of M&A, the resulting Synergies, then it will focus on the aspect of cross-border deals and emerging markets and to conclude, how synergy benefits are shared among two companies.
23
According to Damodaran (2002), a firm can be acquired by another company or by outside investors and its own managers. In fact, the form as M&A is driven; it will affect directly the method of payment and the post-acquisition outcome (Loughran & Vijh, 1997).
By that means, an acquisition by another company can also be classified as: merger, tender offer, consolidation and acquisition of assets. In mergers, the target company is integrated into the acquiring company, so both shareholders intervene on the acquisition process. On the other hand, in tender offers, the integration depends on the approval or not by the target shareholders; for instance, if target shareholders accept the tender, this will result into a merger in which the acquiring firm gains control. In a consolidation process, a new firm is created by both intervening companies, so it requires the participation of both shareholders. The last form concerns to the purchase of assets by the acquirer, thus it only requires a target shareholder approval. On the other hand, in the case of a company being acquired by its own managers (Management Buyout) or external investors (Leveraged Buyout), these acquisition processes normally take the form of tender offers where the target company becomes a private business (Wruck, 2008).
Meanwhile and according to the same author, it is essential to highlight that Leveraged buyout (Private Equity) markets are leaning to boom and bust cycles due mainly to hostile deal pricing and the laid-back credit market conditions. As such acquisitions are executed through raising debt, who holds the debt is the main question mark. Not only banks, but also private hedge funds have increased its importance in private-equity transactions, creating information problems for those who funded the Leverage buyout debt (Acharya, V. et al, 2007). Therefore, capital requirement modifications and more information provision about risk exposure are required measures to avoid such cycles and the related debt problems.
Besides this differentiation, Loughran & Vijh (1997) also advocate a distinction between aggressive and friendly takeovers, referring that mergers are usually friendly, while tender offers use a hostile tone during the whole acquisition process. At the same time, Stahl & Voigt (2005) argue for the speed of integration, highlighting that a faster acquisition leads to a simpler culture assimilation process. Last but not least, a M&A
24
between firms competing on the same industry or business segment tends to increase the probability of success compared to those operating in different industries, without the required know-how to interfere on the target’s core business (Barkema & Vermeulen, 1998).
2.2.2. Synergies - “The creation of value”
According to Damodaran (2005), synergy is defined as the increase in value that comes from the combination of two enterprises to create a more valuable company. On the other hand and also mentioned by the same author, valuing control consists of revaluing only the target company with a different and presumably better management in place and compare this value to the one obtained with the existing management in place. This distinction must be essentially and separately done in order to avoid double counting and to distinguish between control oriented acquisitions and synergy value-oriented purchases.
As the spotlight of this analysis is the synergies created by M&A, it becomes crucial to address about the synergies achievement. Synergies can be reached through cost reductions, or revenue enhancements, or even through both simultaneously (Sirower & Sahni, 2006). In other words, the increase in value can be a result of reduction in the cost of capital or an increase in the expected cash-flows (Damodaran, 2005), albeit companies are normally more triumphant in reducing costs than in increasing revenues (Sirower & Sahni, 2006). Moreover, for a synergy to create value, there must be a further growth in the return on capital to the combined firm.
Furthermore, synergies can be grouped into three groups: Operating Synergies, Financial Synergies and Dubious Synergies (Damodaran, 2005). Operating Synergies refer to a better development of the existing assets resulting into higher growth potential, increasing pricing power, economies of scale and scope and combination of distinct skills. On the other hand, Financial Synergies refer to tax benefits through tax deductions or accumulated losses, increasing debt capacity through a lower earnings variance, the use of excess cash in new opportunities - Cash-slack – and finally, Diversification which depends on a firm’s size and its corporate governance and its
25
effects are far from clear, varying across industries. In fact, the same authors quoted that markets do not recognize the success of diversification to generate value. Ultimately, Dubious Synergies in which markets react positively to its announcements, can take the form of accretive purchases (higher EPS post-acquisition) and fast-growing enterprises.
In turn, the valuation of such synergies is unanimous among analysts (Damodaran, 2005), using the DCF methodologies to compute the additional value created, but its evidence is difficult to evaluate though. In spite of the synergy potential at the time of the takeover, only a small percentage of mergers deliver additional value due to the excessive price paid by acquiring firms and the operations of both intervening firms did not fit (Kaplan & Weisbach, 1992). Moreover, markets perceive M&A takeovers as a surprise; regardless prices adjust quickly (Kiymaz & Kilic, 2004). Thereby and based on historical evidence, Damodaran (2005) mentions three facts which might help to increase the probability of M&A success in creating synergies: firms with similar size have a higher likelihood of failure than small/large firm combinations; cost reduction takeovers have a higher probability of delivering on synergy than takeovers based on growth synergy; lastly, the acquisition of private businesses has a greater probability of success than acquisition of publicly traded firms (Shivdasani & Zak, 2007).
2.2.3. Cross-Border M&A and Emerging Markets
The partnerships or takeovers between companies headquartered in different countries usually raise certain interrogations about how to value such M&A, the entry process and the future perspectives of success (Very & Schweiger, 2001). In fact, the increasing Globalization of markets for goods, services, labor and capital has led companies to start searching for new opportunities abroad and in emerging markets, in order to expand its operations overseas (Zenner, M. et al, 2008). Thus, on the last decade, the markets witnessed a growth of Cross-border transactions, representing one-fourth of the total value of the M&A market (Very & Schweiger, 2001).
Zenner, M. et al (2008) report the main reasons for this growth in cross-border takeovers: Globalization, Geographic diversification, in which emerging market companies increasingly seek cross-border transactions, and tax benefits. Additionally,
26
short-term factors can also live on over time, like: high-relative valuations (increasing purchase power when stock prices are great), currency changes (for instance, a cheap U.S. dollar), Sovereign wealth funds behaving as reserve future funds, and finally decreasing domestic competition given in theory, foreign acquirers seem to pay more than domestic acquirers in cross-border transactions (Bruner, 2004).
However, cross-border M&A present several implications that we must take into account in terms of valuation in order to avoid misjudgments. Differences in terms of currency in which to execute the valuation (normally, using the currency of the target’s cash-flows), taxation (foreign or domestic tax rates), cost of capital, risk assessment among jurisdictions, inflation and cash-flow valuation approaches are crucial to compute (Koller, T. et al, 2005). As a consequence of foreign exchange risk as political risk as well, it is also fundamental to adjust expected cash-flows through a probability weighted scenario method (James & Koller, 2000). Thereby, a foreign currency cash-flow can be discounted at the foreign currency discount rate, converting the result into home currency at the spot exchange rate or; at the home currency discount rate, converting the result into home currency at the expected exchange rate (Froot & Kester, 1995). It is important to refer that foreign currency discount rate and forward exchange rate are obtained using the interest rate parity, according to the same authors.
Nevertheless, some obstacles can also diminish and detain the success of cross-border M&A, namely, the short-term factor referred above may not keep on, as the U.S dollar shift, and the barriers to trade and foreign acquisitions take by a Protectionist government. Consequently, the entry process in these markets, where assets are too cheap or margins and investment opportunities can be too high, is not easy to succeed (Bruner, 2004). Indeed, “M&A is local”, so the success depends on the local/targeted country situation, and on the knowledge and prior experience about a target country (Very & Schweiger, 2001).
Notwithstanding, cross-border M&A should be viewed as a key element of shareholder value (Zenner, M. et al, 2008). Indeed, according to Zenner & Shivdasani (2004), cross-border acquiring firms tend to outperform domestic firms, mainly because of the immediate market access and lower execution risk, and as the majority of cross-border M&A use cash as the acquisition currency, markets usually prefer cash-financed
27
takeover rather than, stock-financed transactions. In turn, large companies purchasing emerging market companies allow them to keep growing and generate shareholder value, when the growth in its domestic market is limited (Zenner, M. et al, 2008). At the same time, emerging market companies, selling at a high price and using mainly cash, acquire access to developed markets.
Therefore, cross-border M&A always bring benefits and cost for the participating companies which dictate the success or failure of the transaction (Kiymaz & Kilic). In case things go on the wrong direction, either firms quit from the transaction, or they try to overcome such bias, collecting a more reliable data about the country/market in question and integrating the acquired firm, overstepping cultural dichotomies (Very & Schweiger, 2001). Moreover, the prior experience and expertise about the target country or emerging market is fundamental, since the more similar a new transaction is to historical and past ones, the better will be its performance and the higher will be the likelihood of well-succeed future takeovers in that country/market (Haleblian & Finkelstein, 1999).
2.2.4. Methods of Payment
According to Zenner, M. et al (2008), transactions, either domestic or cross-border can be financed with cash, stock, a mix of both, or even through a payout depending on the target assets future performance – earnout contract – which provides a greater performance incentive for the seller and a risk management device for the buyer (Bruner, 2004).
Loughran & Vijh (1997) and Martin (1996) argue that the majority of mergers are financed through stock, while tender offers are generally cash-financed, despite markets do not react to news about the method of payment. In turn, several authors, such as Bruner (2004), Savor & Lu (2009), or even, Sirower & Sahni (2006) consider that acquiring firms usually prefer cash instead of stock when possible, with some going so far as to assert that the use of cash might destroy value. On the other hand and when the target’s future performance is unclear, the use of stock might be more rational (Zenner, M. et al, 2008).
28
Indeed, the decision of using cash, stock or even, “earnouts” depend on certain aspects. First of all, it is essential to evaluate acquirer and target stock, whether it is overvalued or undervalued. Normally, when managers believe its stock is overvalued, they will prefer to pay with stock in order to obtain assets at an effective discount, and the opposite is also true (Savor & Lu, 2009). Additionally, the consequences of the payment form on the capital structure and on the rating agencies are also relevant to highlight. According to Sirower & Sahni (2006), in cash transactions, acquiring shareholders take on the entire risk of not match the expected synergies, while in stock transactions the risk is shared with selling shareholders. At the same time, paying with cash, the acquiring company is showing confidence in the transaction and it will get the entire amount of post-merger synergy benefits, being the opposite also veracious (Bruner, 2004). Furthermore, the importance of tax implications and financing choices must be taken into account because cash is directly taxed rather than stock, which is tax-deferred. Besides that, a cash-financed project means an additional debt issuance, so according to Zenner, M. et al (2008), the issued currency should match the currency of the target’s cash-flows, the new debt should be located close to the supported assets and cash-flows, and the issuance market depends on the market access that acquiring and target managers own.
2.2.5. Post-acquisition Returns
According to the theory, the sharing of synergy returns should follow the principle of who contributes more for its creation, it should consequently receive more benefits, in a word, it depends on the effort and skills disbursed by the target and acquirer for the existence of the synergy (Damodaran, 2005). Consequently, an acquiring company to be able to receive the largest part of synergy gains, it must outperform the bids of others and match the shareholders expectations and promises (Sirower & Sahni, 2006). Moreover and according to the same authors, a cash-financed transaction tends to outperform, and consequently larger share of benefits than stock-financed deals. However, in M&A transactions the evidence indicates that targets extract positive wealth gains, whereas the wealth effects for the acquirers are negligible at best (Kiymaz & Kilic, 2004). Thus, it is fair to say, supported obviously by authors such as Sirower &
29
Sahni (2006) that target companies and their shareholders are the greater gainers of M&A, at least in the short-term period.
Indeed, Damodaran (2005) warns that half of acquiring companies earn negative returns at the announcement of transactions, which shows the investors’ skepticism about the ability of the acquirer to keep or not the initial values of each firm composing the combined company, and in turn, the ability to reach the expected synergies initially proposed as a way to warrant the premium price paid. Actually, a higher premium price without any growth expectations represents more risk for shareholders and an inferior stock price performance for the whole acquiring firm (Sirower & Sahni, 2006).
On the long-run period (more than 5 years), the wealth gain effects are shared distinctly. Loughran & Vijh (1997) state that stock mergers accepted by target shareholders, have the worst returns for themselves. In fact, there is a connection between stockholders’ returns and the type of M&A and the consequently, method of payment. Mergers, normally stock-financed, in agreement with Loughran & Vijh (1997) findings, produce relative or negative abnormal returns as the size of the target compared with buyer increases. On the other hand, tender offers, usually cash-financed, have positive excess returns, despite acquirers earn little or nothing from them. Additionally, cash tender offers may also create extra value whether after the transaction, a new management board is appointed or not. Nonetheless, at the time of purchase, if the acquiring firm assets are overvalued, there is an extra incentive to use stock because of their effective price paid drop (Savor & Lu, 2009).
Therefore, in order to verify the risk for the stockholders of using cash or stock and the consequent effects on the combined firm performance, Sirower & Sahni (2006) propose a ratio allowing to know how much a company is risking in a certain takeover if synergies are not matched:
Shareholder Value at Risk (SVAR) =
In fact, in order to meet growth and synergy expectations, managers should spend time on the company’s assets evaluation process, providing detailed and completed
30
information about the takeover benefits to the shareholders and to the markets, and ultimately, the board of directors must be more realistic on their forecasts (Sirower & Sahni, 2006). As a consequence and given the projection and large returns generated by Leverage buyouts, a possible alignment between shareholders’ compensation and company’s goals, as well as a more decentralized decision-making process - the Private-Equity methodology – might be an accurate approach able to invert M&A into a “winner’s game” (Shivdasani & Zak, 2007).
Moreover, Sirower & Sahni (2006) also present a graphical analysis for the purpose of showing the principal M&A gains to the markets. First of all, it includes the “Meet-the-Premium” Line (MTP), which represents the combinations of revenue and cost synergies that justify the premium paid; and the “Plausibility Box”, as the name implies, the revenue and cost synergies plausible to achieve by the company, knowing that markets respond worse to revenue synergies (Bruner, 2004). At best, a company should be above the MTP Line and within the Plausibility Box. Furthermore, a company may also disclose to the markets its own capabilities simultaneously with its market access.
2.3. Conclusion
Pursuant to the theoretical M&A analysis and consequent evidences from it, many interesting findings are still unclear and hard to understand, and might deserve future research. Indeed, particular arguments throughout this section are based on statistical data, which might not be reliable since each situation is different from the previous one (Bruner, 2004). Additionally, such results usually computed, even though, through valid and in vigor approaches, are more and more old-fashioned, as the case of WACC method (Luehrman, 1997).
According to Sirower & Sahni (2006), even whether acquirer shareholders lose value, or the target shareholders earn value, which results at the end, M&A transactions generate value for the economy. In spite of valuation pitfalls and limitations, managers shall spend a great time on it considering the positive and wealthy consequences for the participating firms’ shareholders (Damodaran, 2005).
31
3. Industry and Company Analysis
3.1. Overview of the Global Mobile Industry
The global wireless handset market has seen an exponential growth since its first commercial introduction in 1983, becoming an essential part of our daily lives. Indeed, from the first generation of devices to the launch of digital technologies (as SMS) and the way to the ultra-fast third and fourth generation networks, the mobile phones have become more powerful, have enhanced their capabilities and have attracted several entrepreneurs, operators, major corporations and media. The development of mobile handsets, software and networks has opened several market opportunities, endured by the evolution of mobile phone technologies, in terms of performance and miniaturization. Therefore, the Global Mobile Handset Market is worth USD$172.2 billion in terms of revenues and the global mobile phone vendors shipped 1,39 billion units on a cumulative worldwide basis in 2010, compared to the 1,17 billion units shipped in 2009.
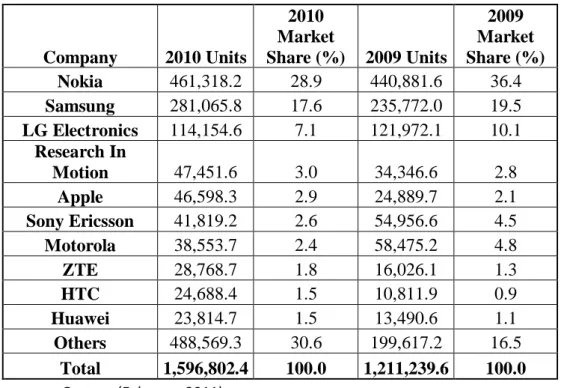
At the same time, the worldwide mobile device sales totaled 1,6 billion units in 2010, which represents a 31.8% increase from 2009 (Figure 1).
Company 2010 Units 2010 Market Share (%) 2009 Units 2009 Market Share (%) Nokia 461,318.2 28.9 440,881.6 36.4 Samsung 281,065.8 17.6 235,772.0 19.5 LG Electronics 114,154.6 7.1 121,972.1 10.1 Research In Motion 47,451.6 3.0 34,346.6 2.8 Apple 46,598.3 2.9 24,889.7 2.1 Sony Ericsson 41,819.2 2.6 54,956.6 4.5 Motorola 38,553.7 2.4 58,475.2 4.8 ZTE 28,768.7 1.8 16,026.1 1.3 HTC 24,688.4 1.5 10,811.9 0.9 Huawei 23,814.7 1.5 13,490.6 1.1 Others 488,569.3 30.6 199,617.2 16.5 Total 1,596,802.4 100.0 1,211,239.6 100.0
source: Gartner (February 2011)
32
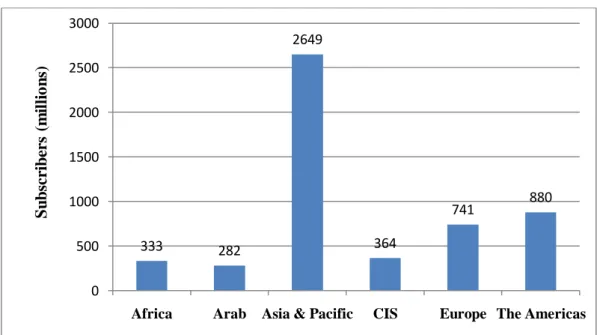
Nevertheless, the current unstable macroeconomic environment must be taken into account in future projections and forecasts. In fact, the global financial crisis affects the mobile industry through three ways: a weaker consumer confidence, credit shortage and currency volatility, mainly for global companies. As a result, operators are nowadays, turning to new services in order to increase profitability, handset makers still rely on software and content rather than equipment for product differentiation which will drive sales of new products, and the end-users role consists of leading this transition through innovation. Additionally, the impact of such unsettled environment is still reasonable and moderate given the essentiality of devices for consumers. According to International Telecommunication Union, there were 5.3 billion mobile phone subscribers by the end of 2010 (Figure 2).
Figure 2: Mobile Subscriptions by Region in 2010
Regarding to the mobile phone main segments, the wireless handsets may be grouped into three general categories: basic phones, feature phones and smartphones. Basic phones are usually the lowest priced, and offer essentially voice and texting functionality. For instance, Nokia’s 2630 model or even Motorola’s RAZR phones were successful basic phones on the past. Feature phones are characterized by at least, one outstanding feature: a high-quality camera or even a mobile music player. LG’s Chocolate phones are popular feature phones in the market. Lately, the smartphones
333 282 2649 364 741 880 0 500 1000 1500 2000 2500 3000
Africa Arab Asia & Pacific CIS Europe The Americas
S u b sc ri b er s (m il li o n s)
33
widen the range of a mobile phone’s functionality beyond voice, texting, music, videos, emails, pictures and internet access.
Indeed, the latest generation of smartphones may be equipped with several gigabytes of memory (memory cards), GPS (Global Positioning System), touchscreen interfaces. An illustrative model is the Apple’s iPhone and the Research in Motion Blackberry’s portfolio. Furthermore, smartphones are becoming a viable alternative to the feature phones, PDA’s and even laptops due to a plenty of factors: the lower product cost and improved handset design and functionalities, the global mobile email and browsing services boom, the emergence and need of 3G and 4G technologies, the increasing competition among mobile manufacturers and operators, and the standardization and constant upgrades of operating systems as well. In fact, global smartphones market accounted for USD$85.1 billion in 2010, which represents 22% of the global mobile handset sales. Hence, it was one of the few markets which remained stable during the financial recession, with an annual growth rate of 29.5% in 2009 over 2008 (USD$53.488 billion and USD$41.303 billion, respectively) and 59.3% in 2010 over 2009. Additionally, the global smartphones market may be also classified into two subgroups: consumer smartphones, which is the larger and fastest-growing market and business smartphones, which is expected to be the prevailing segment in the future, mainly due to the increasing traction of mobility between companies.
Indeed, smartphones are today, the most profitable segment of the global wireless handset market, with a wide leeway in terms of technical upgrades. For this reason, it is crucial to approach this lucrative and fastest-growing segment of the mobile market. On the past, the high cost and limited scope of smartphone services limited such devices to business users, essentially. Notwithstanding, recent developments – flat-rate charges for data plans, faster networks, improved user interfaces, 3D technology and new forms of payments – are helping to boost the adoption by consumers.
34
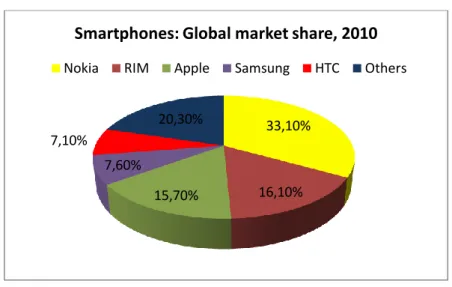
Figure 3: Top 5 Mobile smartphone manufacturers, by 2010 global sales
In Figure 3, we can easily claim that smartphones market is consolidated with the three main players – Nokia, RIM and Apple – holding more than 2/3rd of the global market.
In other hand, the operating system is one of the most essential considerations for the selection of a specific smartphone device (Figure 4). In advance, there are specific companies which are merely specialized in Operating Systems, like Microsoft (Windows Phone) and Google (Android).
Company (OS) 2010 Units
2010 Market Share (%) 2009 Units 2009 Market Share (%) Nokia (Symbian) 111,576.7 37.6 80,878.3 46.9 Google (Android) 67,224.5 22.7 6,798.4 3.9
Research In Motion (Blackberry) 47,451.6 16.0 34,346.6 19.9
Apple (iPhone OS) 46,598.3 15.7 24,889.7 14.4
Microsoft (Windows Phone/Mobile) 12,378.2 4.2 15,031.0 8.7
Other OS 11417.4 3.8 10432.1 6.1
Total 296,646.6 100.0 172,376.1 100.0
source: Gartner (February 2011)
Figure 4: Worldwide Smartphone sales to end-users by Operating System in 2010 (Thousands of Units)
Some notes related to the future projections shall be highlighted: taking into account the the Nokia’s decision to dump its principal smartphone OS in favor of Microsoft’s Windows phone, the Symbian OS may decrease in the next years; Android platform should keep its growth in the following years due to the popular royalty-free business model. 33,10% 16,10% 15,70% 7,60% 7,10% 20,30%
Smartphones: Global market share, 2010
35
After this brief introduction to the smartphones segment, conversely the fixed-line services are in declined as a result of improvements in the quality of wireless networks, and the unlimited calling plans for the mobile handset users.
Meanwhile, the Global mobile handset industry is dominated by five main players: Nokia, Samsung, LG Electronics, Apple and ZTE in the first quarter of 2011 (Figure 5). Surprisingly, RIM has been knocked out from the top-five ranking on mobile phone market share compared to previous years.
Figure 5: Top five mobile phone manufacturers market-share
Moreover, in terms of revenues, Apple has recently become the largest wireless handset seller in the same period (Q1 2011), overtaking Nokia and achieving the pole position in handset, smartphone and tablets revenues, mainly due to the higher Average Selling Price (Figure 6). Apple Q1/10 Nokia Q1/10 Apple Q1/11 Nokia Q1/11
Shipments (millions of units) 8,8 107,8 18,6 108,5
Wholesale ASP (USD$) $606 $83 $638 $87
Revenues (USD$ billions) $5,3 $8,9 $11,9 $9,4
source: Strategy Analytics (April, 2011)
Figure 6: Apple and Nokia annual revenues (2010-2011)
0,00% 5,00% 10,00% 15,00% 20,00% 25,00% 30,00% 35,00% 40,00%
Nokia Samsung LG Apple ZTE Others
Q1/2010 Q1/2011
36
Additionally, the mobile sales have grown constantly over the last 6 years, despite a little decrease at the end of 2009 registering at 14.4% CAGR 2005-2010 (Figure 7).
Figure 7: Worldwide mobile phone sales growth (in millions)
Indeed in 2010, the global market sales increased 31.8% from 2009, a sales growth rate not even seen in 2006, principally because of the sales growth on the smartphone segment.
Regarding to the mobile network operators, as the mobile phone manufacturers, the leading firms are predominantly American, European and Asian headquartered companies, which is positive in terms of regional competitiveness (Figure 8).
Operator Group Revenues (USD$ Million) Ranking
China Mobile 17,715 1
Vodafone Group 14,561 2
Verizon Wireless 14,046 3
AT & T 13,186 4
NTT DOCOMO Group 11,829 5
Deutsche Telekom Group 10,423 6
Telefonica Group 8,851 7
America Movil Group 6,95 8
source: Wireless Intelligence
Figure 8: Worldwide operator revenue ranking 2010
Concerning to the production process for mobile phones and respective supply chain, while the later is more global, the production model is essentially concentrated in Asia and Latin America, and to a smaller extent Eastern Europe. Conversely, the major regions for penetration of mobile phones (3G handsets) are those where the production model is not present (Figure 9). In addition, the outsourcing services are also increasing
800 1000 1200 1400 1600 1800 2000 2005 2006 2007 2008 2009 2010 2011/1Q Gl oba l H ands et s al es