STORAGE SCHEME FOR ANALYSIS OF ACADEMIC DATA AND
INTERACTION OF STUDENTS WITH VIRTUAL EDUCATION PLATFORMS
Né stor Darí o Duqué Mé ndéz
Univérsidad Nacional dé Colombia
Campus La Nubia Manizalés
Colombia
ndduquémé@unal.édu.co
Mauricio Giraldo Ocampo
Univérsidad Nacional dé Colombia
Campus La Nubia Manizalés
Colombia
maugiraldooca@unal.édu.co
Férnando Moréira
IJP, REMIT, Univérsity Portucalénsé,
& IEETA, Univérsity of Avéiro
Rua Dr. Anto nio Bérnardino dé
Alméida, 541, Porto
Portugal
fmoré[email protected]
ABSTRACT
Académic procéssés génératé largé volumés of data at différént lévéls, rélatéd to léarning activitiés and studént intéractions with virtual éducation platforms. Howévér, thé récords obtainéd aré not always uséd to pérform various analyzés, in part, by thé storagé schémés that usé thésé platforms, in disaggrégatéd tablés making it difficult to accéss thé récords of intérést. Thé objéctivé of this articlé is to présént a hybrid storagé schémé, which combinés thé rélational and multi-diménsional schémés for thé storagé of académic data and studént intéractions in virtual éducation platforms and from théré to facilitaté thé obtaining of information and knowlédgé applying divérsé téchniqués.*
CCS Concepts
• Information systems → Database design and models; • Information systems → Database design and models → data analysis.
Keywords
Data Storagé Schémé, Multidiménsional Modél, Rélational Modél, Virtual Education Platforms, Analysis of éducational data
1 INTRODUCTION
In different areas of knowledge, large amounts of data are analyzed, supporting organizational management. An example of this is business intelligence, where business data is used to generate recommendations and support management when it comes to take the decisions.
Permission to make digital or hard copies of all or part of this work for personal or classroom use is granted without fee provided that copies are not made or distributed for profit or commercial advantage and that copies bear this notice and the full citation on the first page. Copyrights for components of this work owned by others than ACM must be honored. Abstracting with credit is permitted. To copy otherwise, or republish, to post on servers or to redistribute to lists, requires prior specific permission and/or a fee. Request permissions from [email protected].
Academic analytics is the improvement of organizational processes, workflows, resource allocation, and institutional measurement through the use of learner, academic, and institutional data. Academic analytics, akin to business analytics, are concerned with Improving organizational effectiveness [8].
The analysis of the academic data and of the collected registers on the interactions of the students with the virtual platforms of education can allow to understand the obtained results and to support strategies to adapt the contents and the educative activities, ensuring that each student receives the Teaching and resources that are needed [12].
In higher education, for example, large amounts of data are collected on students and their teaching and learning process; however, these are not always used, nor are they related to the data obtained from their interactions with the virtual platforms that are used to support their learning in the different courses. This is due, in part, to the disintegration of the academic information systems and the LMS (Learning Management System). This work proposes a storage model that integrates academic data sources and interactions in the LMS in a hybrid storage scheme, seeking to facilitate the analysis to extract information and possible trends or patterns in the data.
The remaining part of this paper is organized as follows. Section 2 presents conceptual elements and related works. The proposed model is presented in Section 3. The application of the model is showed in the subsequent section and, finally, conclusions and future work are discussed in the last section.
2 RELATED ELEMENTS
Technological supports for teaching and learning processes in institutions are varied. A virtual learning platform is a set of
TEEM 2017, October 18–20, 2017, Cádiz, Spain
© 2017 Association for Computing Machinery. ACM ISBN 978-1-4503-5386-1/17/10…$15.00 https://doi.org/10.1145/3144826.3145388
tools and applications (synchronous or asynchronous) oriented to support and facilitate the administration and development of training activities, usually virtual courses, through the web [2].There are different denominations that are associated to these platforms and some are used interchangeably; These are: Virtual Learning Environment (VLE), Learning Management System (LMS), Course Management System (CMS), Learning Platform (LP).
On the other hand, there are the academic information systems of the institutions, which support the academic management and store, among other data, the information of the courses and teachers and the personal information and the results of the students in the different courses.
According [7], presently in most of the countries especially in developing countries all the stack holders of the system are not integrated and does not share same platform for information sharing and response which prevents. This makes the communication and information flow slow and non-coordinated which reduces the efficiency and effectiveness of the education systems. They propose an information system for inclusion of each stakeholder in the system so that problems could be overcome and with the help of ICT utilize the full potential and effective delivery products and services of the Education system to everyone.
The potential of this data, in diverse platforms, is allow obtain information and analyzing and uncovering the hidden knowledge of the data itself. This process is hard and very time consuming if to be done manually. Educational data mining (EDM) and learning analytics are two approaches that seek to obtain meaningful, valuable information that is not previously known from these data [5].
The review of the literature shows that the analysis of data in educational environments has gained a large space and that the proposals and techniques that are used are very varied [5] [9] [10] [1].
An obstacle that presents itself in order to obtain good results and that becomes a challenge for the analysts is that the systems are not integrated and does not share same platform for information sharing. Then, defining a storage scheme that allows the integration of different data sources, aimed at facilitating the application of various analytical tools, becomes a constant task for researchers and analysts [10] [6] [13] [3] [11].
Systems that support analysis and decision making have as alternative storage schemes their relational and multidimensional variants. The first case is used in traditional data base systems and is based on the relational model, while in the second it is based on a logical design technique that seeks to present data in an intuitive way and allows high performance in queries about The table that centralizes the different measures (fact table) and on different dimensions that can have different granularity for the same case. The most applied multidimensional model is in star, which has only one table of facts and a set of tables of dimensions associated with it [3].
The proposal in this article is directed to this objective, designing a hybrid storage scheme, which combines the relational and multi-dimensional schemes for the storage of
academic data and student interactions in virtual education platforms and from there to facilitate the obtaining of information and knowledge applying diverse techniques.
3 PROPOSED MODEL
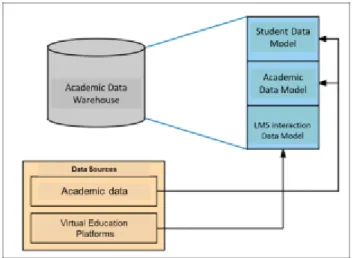
The storage scheme was conceived as a hybrid academic data warehouse, in Fig. 1 the proposed model is shown, in which three data models are abstracted namely: a first model of the student's personal data, a second model for the treatment of academic data and the third data model for student interactions with virtual education platforms. At the moment of designing the storage model, it was considered the complete educational data domain to support the subsequent application of basic query and analytical learning tools, which gives usefulness to the model; for this it is necessary to integrate the data under a single scheme and facilitate access to them. The following three data models are described below.
Figure 1. Proposed Model.
3.1 Student Data Model
It corresponds to the scheme for the storage of the student's own information, that is, personal and family data, such as origin, socioeconomic conditions of the student and his family, data from the school from which the student comes, etc.
3.2 Academic data model
It corresponds to the scheme for the storage of the information of the academic process of the student, since it is incorporated into the educational institution, that is, data of the admission, data of the courses with the obtained qualifications, credits taken, advances in the curriculum, etc.
3.3 Data model of interactions with virtual
platforms
It corresponds to the scheme for the storage of the information of the processes of interaction of the student with the virtual platforms of learning that support the courses of its academic program. It includes data of the courses enrolled, contents of
these courses, income to the platform, time of this income, activities developed, among others.
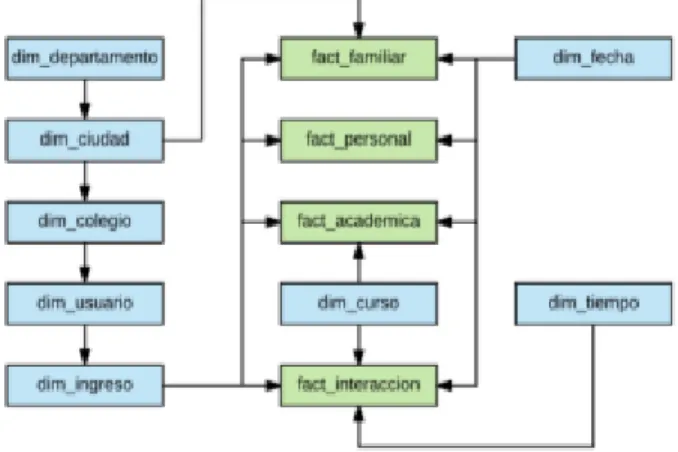
The general scheme of the proposed storage model was specified in an academic data warehouse, which is presented in Fig. 2. It is based on a relational and multidimensional approach in extended star, where you can see the relationship between dimensions and facts tables.
As can be appreciated, the data model does not have a single fact table, since the source data domain corresponds to different systems and required the construction of a hybrid model between a relational and a multidimensional data warehouse, with extended star. The tests showed that it covers the needs of storage and subsequent support to data analysis processes, from a simple query to application of data mining techniques, through multidimensional analysis.
Figure 2. Academic Data Warehouse.
The design of the hybrid data warehouse takes advantage of the two approaches of storing data in data warehouse: the relational model and the multidimensional model. Relational models have benefits such as integrity, compatibility, standardization, reliability, independence guarantee and ease of connectivity with programming languages, and there are great possibilities for queries [6]. On the other hand, the multidimensional model as a technique of logical design of data warehouses is characterized by presenting the data intuitively and with high performance [4].
Each of the facts and dimensions tables considered for the data storage model is detailed below.
Fact_academic_information. In this table the data of the
academic behavior of the user is stored, that is to say, the relationship between each student's income and each subject studied and how the academic average is behaved, based on this it is possible to identify trends and possible problems of foundation that leads to poor performance in certain courses.
Fact_information_personal. This table records the
changes in the socio-economic information of the user, such as the type of residence, address, stratum, municipality, income, etc., with the objective of identifying if these changes affected the academic performance of the user. Crossing the data of academic behavior with the data stored in this table, you can
make decisions, thought to carry out an accompaniment to identify possible problems and try to find solutions.
Fact_information_family. This table shows the changes in
the socio-economic family information of the user in aspects such as the family economic situation, type of family housing, number of family members and other aspects that may present changes in the family environment and that may affect some way the behavior and therefore the academic performance of the user in the institution.
Fact_interaccion. This table shows the interactions that
the user makes in each course with the virtual education platforms available in the institution, in order to determine to what extent the use of such platforms affects the academic performance that the user can present during their learning process. The fields that are recorded in this table are the type of interaction that the user performed on the platform, the duration of the interaction, the course in which the interaction was performed, the time of the interaction. This data can help identify habits of study and how beneficial they are for the user taking into account the results obtained in the qualifications.
Dim_departamento. This is a dimension of location, where
you find the data of the departments of the country, with attributes such as the code and name of the department.
Dim_ciudad. In this table are the data of the municipalities
in the country, which determines the location of each of the actors present in the system, this is of great relevance to determine trends in behavior in the region. This table have attributes such as municipality code, municipality name and a relationship with dim_departamento to determine in which department the municipality is located.
Dim_colegio. This table stores the data of the colleges or
institutions of secondary education to relate them to the students in the data warehouse, which can help determine relations between academic performance of the students and school, and can help to take decisions to give special support to students of certain institutions and thus improve academic quality. This table has attributes such as: school code, school name, academic period, mode, calendar and relationship with the municipality table to indicate where it is located.
Dim_usuario. This table contains all the basic and
permanent data of the user, such as name, document number, sex, email, date of birth, marital status, military district where the military notebook was obtained (in the case of men), among others; In addition this table is related to dim_colegio to determine from which educational institution comes the student.
Dim_ingreso. This table contains data about student
admission to university. It presents very specific data such as the entrance score, the type of student's income to the institution, among others. In addition to this, this table can present several input per student, since in some institutions, students can opt for double degrees, or can present different admissions and for each one, data related to the courses and academic average may vary.
Dim_curso. In this table, the data of the courses that users
attend are kept, these data are necessary to record the academic behavior that these have over time and how the
academic average is affected, based on which they can be searched behavioral trends.
Dim_tiempo. This table records the dates in which the
events of each student are happening, then the reference between this table, the table dim_estudiante and the facts where it is necessary to register changes in the time is used late.
4 APPLICATION OF THE PROPOSED STORAGE
MODEL
To validate the proposal, the Universidad Nacional de Colombia - Manizales was taken as a case study. The records were extracted from the Academic Information System (SIA) corresponding to the periods between the first semester of 2009 and the first semester of 2015. Also included were data from two LMS, Blackboard and Moodle, corresponding to the second half of 2013 and first Semester of 2014 for the case of Blackboard and 2014 for Moodle.
In order to have the data required for the validation of the proposal, several difficulties were encountered: data collection and integration (various sources and platforms, with non-uniform data), data schemas unknown by the generators of the data; a high volume of non-relevant data. One factor that affects the expected results is to be able to count the student grading information, which leads to an analysis on a less fine granularity.
The data sources are described below.
4.1 Data of the academic information system (SIA)
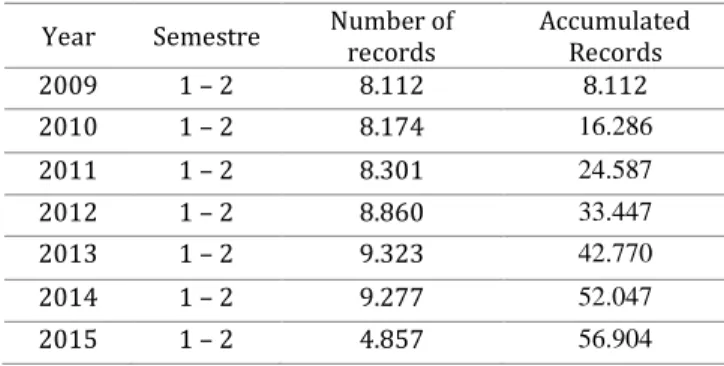
The academic data provided by the institution, as mentioned above, comprise between the first semester of 2009 and the first semester of 2015. Table 1 presents a summary of the number of registrations received for each academic period extracted from SIA.
Table I. Frequency of Special Characters.
Yéar Séméstré Numbér of récords Accumulatéd Récords 2009 1 – 2 8.112 8.112 2010 1 – 2 8.174 16.286 2011 1 – 2 8.301 24.587 2012 1 – 2 8.860 33.447 2013 1 – 2 9.323 42.770 2014 1 – 2 9.277 52.047 2015 1 – 2 4.857 56.904
We identified 91 attributes and were grouped into six categories: identification or personal data, academic admission, socio-economic, academic, family and academic performance.
4.2 Data on student interactions on Blackboard and
Moodle platforms
The interaction data is obtained from the records in the LMS Blackboard and Moodle.
Blackboard. As for the educational platform Blackboard
(BB) had a considerable number of databases. Table 2 presents a consolidated of these databases, which indicates the number of tables each contains.
Given the diversity of versions and the number of tables, it is required, for the integration of the data in the warehouse, an additional effort to simply populate a database.
Through a review of the Blackboard documentation and the examination of the data, it is possible to identify that there are different schemes and different databases for the same academic periods, that is, they have repeated records in different backups. These databases vary according to the functionalities that are required; many of them are for administrative operations and others for platform functionality as an educational tool.
Table II. Consolidated database BB.
BBS DBN BBV DBV ND Numbér of tablés WD T As_coré 8.4 2005 8.4 8.7 2005 167 438 8.7 9.1 2008 294 656 9.1 Stats 8.4 2005 8.4 8.7 2005 11 20 8.7 9.1 2008 74 133 9.1 Admin 8.4 2005 8.4 8.7 2005 8.7 9.1 2008 7 6 13 9.1 N/A 9.1 2008 81 29 110 9.1 9.1 2008 12 15 27 9.1
BBS – BB Schema; DBN – Database Name; BBV – BB version; DBV – Database version; SD – Non Data; WD – with data; T – total of tables
Moodle. The Moodle database [4] is composed of a total of
325 tables, which contain information for the second half of 2014. An existence of 172,279 users was identified, including students, teachers and administrators. In general, it is possible to identify that the database has a design focused on the functional operation of the platform. It also highlights the existence of modular hierarchical ranges, where a table stores the general information according to the type of action or operation required for Moodle. There are several tables lacking data or presenting parametric information specific to the operation of the platform.
As an important factor in the data integration process, the data relevant to the system to be implemented and the quality of the data were determined. A detailed exploration of these databases was done to determine the records that could really add value to the model.
4.3 ETL process
Due to the amount of data, the different schemes used to store them and different periods to which they belong, it is common the presence of noise, inconsistent or redundant data. In order
to store the data in the data warehouse, the application of preprocessing techniques to the original data sets is required; such a process is known as ETL (Extract, Transform, Load). ETL process help integrate from sources data to the data warehouse. ETL operations are specific to the data set to be considered [4].
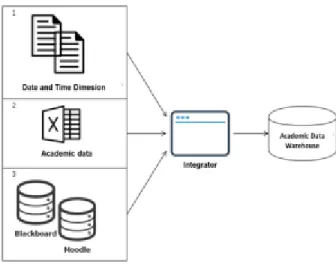
The proposed storage model, reflected in the Academic Data Warehouse, was implemented in the PostgreSQL database engine [11]. An ETL tool was developed in JAVA that captures both academic data and interactions in LMS and applies different operations for integration. The general scheme of the ETL process is shown in Fig 3.
Figure 3. ETL process.
The function of the module in ETL that performs the integration of the data was oriented, in the first instance, to load the records corresponding to the dimensions date and time. This was done prior to loading the other data as they are required to apply the relationships to the other tables.
In the second instance, the processing of academic data is done. In this case, each original record is taken and each attribute is mapped to each of the tables that make up the academic data model. The verification of the data is done to avoid entering duplicate data in the relational component of the storage model, seeking the normalization of the same. Subsequently, some data completion tasks are done, for example, for students who do not report the city of origin, this field is completed with a designated value within the system; in this case "Do not report". Finally the data is loaded.
The third step corresponds to the processing of the data of the interactions, which are taken from the databases of the LMS. First, a Java Database Connectivity (JDBC) connection is made and the data is extracted by each of the students already entered into the storage model if the student presents interaction records within the platform these are extracted by a SQL query that selects the attributes that were determined after the process of pre-processing and initial characterization. Each record is analyzed and it is verified if the course where the student had interaction is stored in the model and the record is created or recovered, as the case may be; then the identifiers of
the date and time dimensions are consulted, the relation is made and the record of the interaction is saved.
In Fig. 4 the interface of the ETL module is presented for loading the data to each of the components of the data warehouse.
Figure 4. ETL module interface.
ETL process
SQL queries were used to load interaction data: SELECT
users.pk1 AS id_usuario_plataforma, users.user_id AS nombre_usuario, us-ers.firstname AS nombre, users.lastname AS apellidos, users.student_id AS documento, users.email AS correo,
users.last_login_date AS ultimo_ingreso, ods_aa_session_activity.login_time AS hora_acceso_sesion, ods_aa_session_activity.logout_time AS hora_salida_sesion, ods_aa_session_activity.user_pk1 AS id_sesion_usuario, ods_aa_course_activity.initial_datetime_access AS hora_acceso_curso, ods_aa_course_activity.course_access_minutes AS duracion_acceso_curso, ods_ls_course.pk1 AS id_curso, ods_ls_course.course_name AS nombre_curso FROM users
INNER JOIN ods_aa_session_activity
ON ods_aa_session_activity.user_pk1=users.pk1 INNER JOIN ods_aa_course_activity
ON
ods_aa_course_activity.session_pk1=ods_aa_session_a ctivity.session_pk1
INNER JOIN ods_ls_course ON
ods_ls_course.pk1=ods_aa_course_activity.course_pk1 ORDER BY users.pk1
At the end of the ETL process, an academic data warehouse was populated with the number of records shown in Table 3.
Table III. Number of records in Data warehouse. Fact Tablé Numbér of récords fact_académica 56.904 fact_pérsonal 56.904 fact_familiar 56.904 fact_intéraccion 105.609
4.4 Analysis process
This subsection seeks to show the possibility of applying various types of analysis to the data, taking advantage of the proposed academic data warehouse, not the discussion of them, which would be outside the scope of the paper.
Data analysis in the data warehouse is performed under various approaches to learning analytics. Below are some results on each.
4.4.1 Descriptive approach. In order to generate statistical indicators of a global form of the various variables treated in order to establish an identification of trends of the data, by means of calculations we identified the measures of central tendency, dispersion measures and measures of position. Table 4 show the indicators for interactions.
Table IV. Descriptive statistics indicators for interactions.
Attributés Mé Mo M Va Std Hours 0.00 0.00 1.48 3.14 1.77 Minutés 12.00 0.00 18.43 353.18 18.79 Séconds 26.00 2.00 27.20 301.71 17.37 Total duration (min) 56.62 0.03 107.86 13494.06 116.16 Numbér of intéraction s pér studént 17.00 1.00 28.74 1103.58 33.22
Me – Median; Mo – Mode; M – Mean; Va – Variance 4.4.2 Diagnostic approach. In this approach, an analysis was carried out through relational queries (SQL) and a multidimensional analysis. Some of the results are shown below.
Relational analysis: Table 5 shows the results of a specific
query.
Multidimensional analysis: In the second instance, a
multidimensional analysis was carried out, using a tool built in the Research Group oriented to OLAP (On-Line Analytical Processing). Figure 5 shows the interactions versus curriculum.
Table V. Distribution of students by strata.
Numbér of studénts Strata 27 - 1265 Strata 1 3385 Strata 2 4250 Strata 3 1170 Strata 4 282 Strata 5 251 Strata 6 22 No strata 126 N/A
Figure 5. Number of interactions per curriculum.
4.4.3 Mining approach. In order to carry out the analyzes corresponding to the mining approach, a dataset was initially created, consisting of some of the attributes considered relevant to find a pattern of behavior regarding the interactions of students in virtual learning platforms and their academic performance.
As example, the distribution of clusters with respect to the
delta_papa (academic average) and the
average_time_interaction is presented in Figure 6.
Figure 6. Distribution of Clusters with respect to the delta_papa and the average_time_interaction for K = 3.
5 CONCLUSIONS AND FUTURE WORK
Educational institutions collect and generate a large amount of data about their students, not only about their academic performance, socioeconomic status and socio-cultural situation, but also about their study habits, reflected in interactions with virtual education platforms. However, usually, these data are handled in isolation, which makes it difficult to take advantage of the information that is hidden there.
The proposed hybrid academic data warehouse combines the relational and dimensional approaches, allowing the integration of data from different sources and facilitating different analysis of the data. It is confirmed that ETL occupies a high percentage of the process.
The proposed model can be applied in different institutions, thanks to the possibilities of defining the dimensions and measures that will be used for the analysis. This was proven in the very development of the project where, from the new data obtained, adjustment was required in some aspects.
As future work is intended to improve some of the elements involved, for example, include new data sources and strengthening the layer of data analysis. In order to further standardize the research product, it is proposed the incorporation of two principal specifications for learning analytics interoperability: Caliper, from IMS, and xAPI, from ADL.
Finally, it has been proposed to add within the application developed in JAVA for the ETL process, a module that allows the generation of graphs of statistical and relational analysis of the data.
ACKNOWLEDGMENTS
This work is part of the development of the project entitled "Consolidation of research lines of the Research Group in
Adaptive Intelligent Environments GAIA", with code 32059 favored in the Internal Research Call of the Faculty of Administration 2015.
REFERENCES
[1] Buldu, A. and Üçgün, K. 2010. Data mining application on students’ data.
Procedia - Social and Behavioral Sciences. 2, 2 (2010), 5251–5259.
DOI:https://doi.org/10.1016/j.sbspro.2010.03.855.
[2] Castro, S.M. et al. 2013. ANALIZAMOS 19 PLATAFORMAS DE E-LEARNING Investigación colaborativa sobre LMS. Investigación colaborativa
sobre LMS. 1, (Dec. 2013), 152.
[3] DeFreitas, K. and Bernard, M. 2014. A Framework for Flexible Educational Data Mining. Proceedings of the International Conference on Data Mining (DMIN). (2014), 1.
[4] Duque-Méndez, N.D. et al. 2014. Hydro-meteorological data analysis using OLAP techniques. DYNA. 81, 185 (2014), 168–175.
[5] Falakmasir, M.H. and Habibi, J. 2010. Using Educational Data Mining Methods to Study the Impact of Virtual Classroom in E-Learning. Proceedings of the 3rd
International Conference on Educational Data Mining. (2010), 241–248.
[6] Jaramillo Valbuena, S. and Londoño, J.M. 2015. Sistemas para almacenar grandes volúmenes de datos. Revista Gerencia Tecnológica Informática. 13, 37 (Mar. 2015), 17–28.
[7] Kumar, S. et al. 2015. A new sustainable prototype USP for education information system. 2015 1st International Conference on Futuristic Trends in
Computational Analysis and Knowledge Management, ABLAZE 2015 (Feb.
2015), 174–179.
[8] Long, P.D. and Siemens, G. 2011. Penetrating the Fog: Analytics in Learning and Education. Educause Review.
[9] Mohamad, S.K. and Tasir, Z. 2013. Educational Data Mining: A Review.
Procedia - Social and Behavioral Sciences. 97, (2013), 320–324.
DOI:https://doi.org/10.1016/j.sbspro.2013.10.240.
[10] Peña-Ayala, A. 2014. Educational data mining: A survey and a data mining-based analysis of recent works. Expert Systems with Applications.
[11] Peña-Ayala, A. 2017. Learning Analytics : Fundaments , Applications , and A
View of the Current State of the Art to. Springer.
[12] Siemens, G. et al. 2011. Open Learning Analytics : an integrated & modularized platform. Knowledge Creation Diffusion Utilization. (2011), 1–20.