Microorganisms 2020, 8, 1799; doi:10.3390/microorganisms8111799 www.mdpi.com/journal/microorganisms Article
Settleable Dust and Bioburden in Portuguese
Dwellings
Carla Viegas 1,2,3,*, Marta Dias 1, Beatriz Almeida 1, Estela Vicente 4, Liliana Aranha Caetano 1,5,
Elisabete Carolino 1 and Célia Alves 4
1 H&TRC-Health & Technology Research Center, ESTeSL-Escola Superior de Tecnologia da Saúde, Instituto Politécnico de Lisboa, 1990-096 Lisbon, Portugal; [email protected] (M.D.);
[email protected] (B.A.); [email protected] (L.A.C.); [email protected] (E.C.) 2 NOVA National School of Public Health, Public Health Research Centre, Universidade NOVA de Lisboa,
1600-560 Lisboa, Portugal
3 Comprehensive Health Research Center (CHRC), 1169-056 Lisbon, Portugal
4 Department of Environment and Planning, Centre for Environmental and Marine Studies (CESAM), University of Aveiro, 3810-193 Aveiro, Portugal; [email protected] (E.V.); [email protected] (C.A.) 5 Research Institute for Medicines (iMed.ULisboa), Faculty of Pharmacy, University of Lisbon,
1649-003 Lisbon, Portugal
* Correspondence: [email protected]
Received: 21 October 2020; Accepted: 14 November 2020; Published: 16 November 2020
Abstract: Monitoring campaigns in several buildings have shown that occupants exposed to contaminated indoor air generally exhibit diverse health symptoms. This study intends to assess settleable dust loading rates and bioburden in Portuguese dwellings by passive sampling onto quartz fiber filters and electrostatic dust cloths (EDCs), respectively. Settled dust collected by EDCs was analyzed by culture-based methods (including azole-resistance screening) and qPCR, targeting four different toxigenic Aspergillus sections (Flavi, Fumigati, Circumdati, and Nidulantes). Dust loading rates and bioburden showed higher variability in the summer season. In both seasons, Penicillium sp. was the one with the highest prevalence (59.1% winter; 58.1% summer), followed by Aspergillus sp. in winter (13.0%). Fungal contamination increased in the winter period, while bacterial counts decreased. Aspergillus sections Circumdati and Nidulantes, detected in voriconazole supplemented media, and Aspergillus sections Fumigati and Nidulantes, detected by molecular tools, were found in the winter samples. This study reinforces the importance of applying: (a) Passive sampling methods in campaigns in dwellings; (b) two different culture media (MEA and DG18) to assess fungi; (c) in parallel, molecular tools targeting the most suitable indicators of fungal contamination; and (d) azole resistance screening to unveil azole resistance detection in fungal species.
Keywords: indoor air quality; dwellings; passive sampling methods; settleable dust; bioburden; azole-resistance screening; Aspergillus sp.
1. Introduction
According to the World Health Organization (WHO), 4.3 million people die each year from exposure to domestic air pollution. Presently, people spend more than 90% of the day indoors in their own dwellings or in workplace [1,2], so it is of utmost importance to study indoor air quality (IAQ). Organic dust consists mainly of particulate matter with microbial, vegetable, or animal origin. Its specific agents include viruses, bacteria, gram negative endotoxins, actinomycetes, fungi, mycotoxins, algae or plant cells, enzymes and proteins from plants or animals, antibiotics or other products from other processes, insects, and mites (and their fragments and particles) [3,4]. Among organic dust, bioaerosols are usually defined as particulate matter with biological origin, such as
pollen, plant fibers, and microorganisms. Exposure to bioaerosols can lead to a wide range of adverse health effects [5–8]. Fungi and bacteria present in bioaerosols are often called as the bioburden and should be well characterized [9].
IAQ studies in several buildings have shown that occupants exposed to contaminated air generally exhibit signs of lethargy or fatigue, headaches, dizziness, vomiting, difficulty in concentrating, and other symptoms [10]. Among the monitoring of other environmental parameters, the collection of particulate matter (PM) inside buildings is commonly used for studies linking human health to disease [11]. Additionally, it is apparent that not only quantitative but also qualitative aspects (species present) of the microbial exposure may be important to understand agents and the mechanisms causing health outcomes in building occupants [12].
Previous studies have pointed out Cladosporium, Penicillium, and Aspergillus as the most prevalent genera indoors [13,14]. Micrococcus sp., Staphylococcus auricularis, and the gram-negative bacteria Bacillus sp. have been documented as dominant among bacteriota [2,13].
Several studies reporting a wide range of environmental factors that influence bioburden indoors [6,15–18] have indicated that microbial sampling should be achieved by passive methods, as a complement or alternative to the more conventional air sampling techniques [19–21]. Indeed, passive methods allow reporting the contamination of an extended period of time (ranging from days to several months), while air samples can only reproduce the load for a shorter period of time (mostly minutes) [22].
Passive monitoring of settleable dust onto filters has been used both indoors and outdoors [23– 25]. It is a cost-effective and simpler alternative to active sampling, allowing the simultaneous obtaining of a larger number of samples in various locations. On the other hand, passive sampling is less disturbing for indoor occupants since it does not rely on noisy pumps.
Electrostatic dust cloths (EDC) are an inexpensive passive sampling method comprising an electrostatic polypropylene cloth inside an open sterilized petri dish [22,26,27]. The cloth consists of electrical fibers that increase the retention of particles [22,27] and, if located on an elevated surface, it allows the efficient collection of the dust present in the air [27,28].
In previous studies carried out in Portugal, passive sampling has, moreover, allowed the recovery of fungal contaminants with reduced susceptibility to azoles in distinct indoor environments [29–31]. The emergence in the environment of human pathogenic fungal species, such as Candida sp. and Aspergillus fumigatus, with reduced susceptibility to the antifungal drugs, raises concern regarding the limited therapeutic arsenal available to treat fungal infections that might become severe, even mortal, particularly in individuals with some type of immune impairment [32– 34]. This phenomenon calls for worldwide surveillance of fungal resistance both indoors and outdoors [35,36].
In this study, the seasonal deposition rates of total settleable dust and bioburden in dwellings was assessed by passive sampling. The suitability of EDC as screening method to characterize bioburden was also explored. Additionally, the study comprised the molecular detection of toxigenic fungal species and the analysis of antifungal resistance profiles.
2. Materials and Methods
2.1. Location of the Studied Dwellings
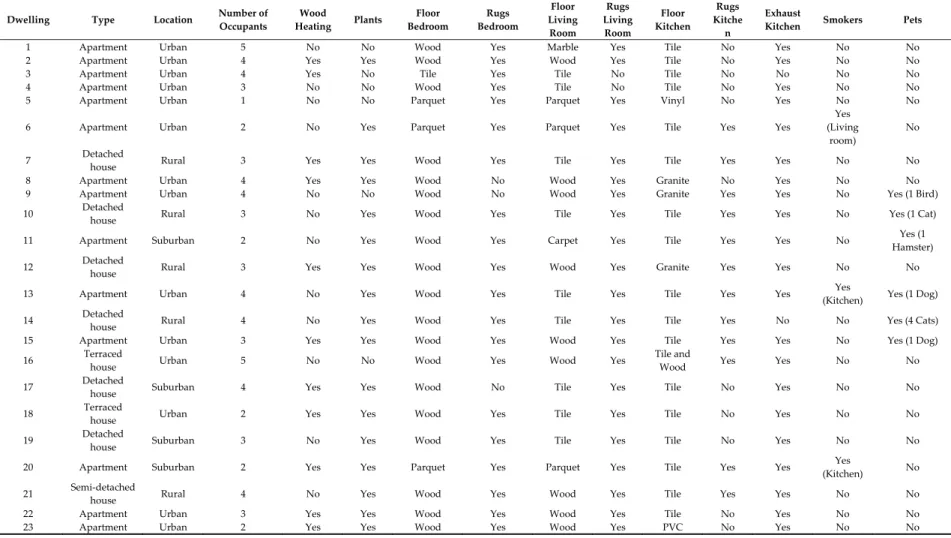
This study was conducted in 23 naturally ventilated dwellings located in the district of Aveiro, Portugal (Figure 1). Simultaneous samplings were made in 3 rooms of each house: Kitchen, bedroom, and living room. Table 1 summarizes the main characteristics of each dwelling.
Table 1. Characteristics of the dwellings where dust sampling took place.
Dwelling Type Location Number of
Occupants Wood Heating Plants Floor Bedroom Rugs Bedroom Floor Living Room Rugs Living Room Floor Kitchen Rugs Kitche n Exhaust
Kitchen Smokers Pets
1 Apartment Urban 5 No No Wood Yes Marble Yes Tile No Yes No No
2 Apartment Urban 4 Yes Yes Wood Yes Wood Yes Tile No Yes No No
3 Apartment Urban 4 Yes No Tile Yes Tile No Tile No No No No
4 Apartment Urban 3 No No Wood Yes Tile No Tile No Yes No No
5 Apartment Urban 1 No No Parquet Yes Parquet Yes Vinyl No Yes No No
6 Apartment Urban 2 No Yes Parquet Yes Parquet Yes Tile Yes Yes
Yes (Living
room)
No
7 Detached
house Rural 3 Yes Yes Wood Yes Tile Yes Tile Yes Yes No No
8 Apartment Urban 4 Yes Yes Wood No Wood Yes Granite No Yes No No
9 Apartment Urban 4 No No Wood No Wood Yes Granite Yes Yes No Yes (1 Bird)
10 Detached
house Rural 3 No Yes Wood Yes Tile Yes Tile Yes Yes No Yes (1 Cat)
11 Apartment Suburban 2 No Yes Wood Yes Carpet Yes Tile Yes Yes No Yes (1
Hamster) 12 Detached
house Rural 3 Yes Yes Wood Yes Wood Yes Granite Yes Yes No No
13 Apartment Urban 4 No Yes Wood Yes Tile Yes Tile Yes Yes Yes
(Kitchen) Yes (1 Dog) 14 Detached
house Rural 4 No Yes Wood Yes Tile Yes Tile Yes No No Yes (4 Cats)
15 Apartment Urban 3 Yes Yes Wood Yes Wood Yes Tile Yes Yes No Yes (1 Dog)
16 Terraced
house Urban 5 No No Wood Yes Wood Yes
Tile and
Wood Yes Yes No No
17 Detached
house Suburban 4 Yes Yes Wood No Tile Yes Tile No Yes No No
18 Terraced
house Urban 2 Yes Yes Wood Yes Tile Yes Tile No Yes No No
19 Detached
house Suburban 3 No Yes Wood Yes Tile Yes Tile No Yes No No
20 Apartment Suburban 2 Yes Yes Parquet Yes Parquet Yes Tile Yes Yes Yes
(Kitchen) No 21 Semi-detached
house Rural 4 No Yes Wood Yes Wood Yes Tile Yes Yes No No
22 Apartment Urban 3 Yes Yes Wood Yes Wood Yes Tile No Yes No No
Figure 1. Location of the district of Aveiro.
2.2. Settled Dust Sampling
Two 47 mm diameter quartz fiber filters (Pallflex® Putnam, CT, US) were exposed in uncovered petri dishes (Analyslide® Pall, München, Germany), which were placed side by side to collect settleable particulate matter in the rooms of each home in two different seasons. The filters were placed at a height of approximately 1.5 m above ground level and exposed to dust fall for about 1 month. Sampling took place approximately between 20 May and 20 June 2017 (summer campaign) and between 20 January and 27 February 2018 (winter campaign). The gravimetric quantification was performed with a microbalance (RADWAG 5/2Y, Radom, Poland) after conditioning the filters for 24 h in a room with constant humidity (50%) and temperature (20 °C) in accordance with the European Standard EN14907:2005. Filter weights were obtained from the average of six consecutive measurements with variations less than 0.02%.
To assess bacterial and fungal contamination indoors, dust was also collected through a passive method using an Electrostatic Dust Collector (EDC), which comprises an electrostatic polypropylene cloth [26]. A total of 79 EDC was collected in summer and 78 in winter. EDCs were placed in large petri dishes (surface expose area of 154 cm2) in parallel with the two small petri dishes with quartz filters used for gravimetric quantification. The 3 devices were exposed to dust fall for the same time. After transport in refrigerated conditions (<4 °C), EDCs were then used for the bioburden assessment.
2.3. Electrostatic Dust Cloth Extraction and Bioburden Characterization
Settled dust collected by EDCs was analyzed by culture-based methods and qPCR, targeting 4 different toxigenic Aspergillus sections (Flavi, Fumigati, Circumdati, and Nidulantes). The target fungi were selected upon the classification as indicators of harmful fungal contamination through culture-based methods [37].
EDC samples were subjected to extraction and bioburden characterized by culture-based methods, as previously described [22,38]. EDCs were washed and plated onto 2% malt extract agar (MEA) (Frilabo, Maia, Portugal) with 0.05 g/L chloramphenicol media, dichloran glycerol (DG18) (Frilabo, Maia, Portugal) agar-based media, tryptic soy agar (TSA) (Frilabo, Maia, Portugal) with 0.2% nystatin, and violet red bile agar (VRBA) (Frilabo, Maia, Portugal). Incubation of MEA and DG18 plates at 27 °C for 5 to 7 days and TSA and VRBA plates at 30 °C and 35 °C for 7 days, respectively, was performed. From the EDC suspension, 150 µL were additionally plated on Sabouraud dextrose agar (SDA) (Frilabo, Maia, Portugal), as well as on SDA plates supplemented with 4 mg/L itraconazole (ITR) (Frilabo, Maia, Portugal), 1 mg/L voriconazole (VOR) (Frilabo, Maia, Portugal), 0.5 mg/L posaconazole (POS) (Frilabo, Maia, Portugal), and incubated at 27 °C (adapted from the EUCAST 2020 guidelines).
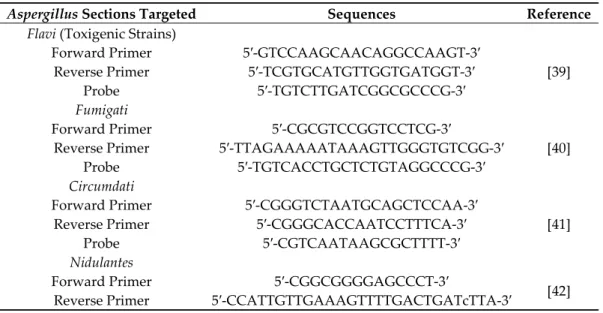
Molecular identification of the different fungal species/strains was achieved by Real Time PCR (qPCR) using the CFX-Connect PCR System (Bio-Rad, Hercules, CA, USA) on each EDC. Reactions included 1× iQ Supermix (Bio-Rad Hercules, CA, USA), 0.5 µM of each primer (Table 2), and 0.375 µM of TaqMan probe in a total volume of 20 µL. Amplification followed a three-step PCR: 50 cycles with denaturation at 95 °C for 30 s, annealing at 52 °C for 30 s, and extension at 72 °C for 30 s. A non-template control was used in every PCR reaction. For each gene that was amplified, a non-non-template control and a positive control were used, consisting of DNA obtained from a reference that belonged to the culture collection of the Reference Unit for Parasitic and Fungal Infections, Department of Infectious Diseases of the Ricardo Jorge National Institute of Health. These strains have been sequenced for ITS B-tubulin and calmodulin.
Table 2. Sequence of primers and TaqMan probes used for Real Time PCR.
Aspergillus Sections Targeted Sequences Reference
Flavi (Toxigenic Strains)
Forward Primer 5′-GTCCAAGCAACAGGCCAAGT-3′
[39]
Reverse Primer 5′-TCGTGCATGTTGGTGATGGT-3′
Probe 5′-TGTCTTGATCGGCGCCCG-3′ Fumigati
Forward Primer 5′-CGCGTCCGGTCCTCG-3′
[40]
Reverse Primer 5′-TTAGAAAAATAAAGTTGGGTGTCGG-3′
Probe 5′-TGTCACCTGCTCTGTAGGCCCG-3′ Circumdati
Forward Primer 5′-CGGGTCTAATGCAGCTCCAA-3′
[41]
Reverse Primer 5′-CGGGCACCAATCCTTTCA-3′
Probe 5′-CGTCAATAAGCGCTTTT-3′ Nidulantes
Forward Primer 5′-CGGCGGGGAGCCCT-3′
[42]
Reverse Primer 5′-CCATTGTTGAAAGTTTTGACTGATcTTA-3′
2.4. Statistical Analysis
Data were analyzed using the statistical software SPSS V26.0 for Windows. Results were considered significant at the 5% significance level. For the characterization of the sample, frequency analysis (n, %) was used for qualitative data and mean and standard deviation for quantitative data. To test the normality of the data, the Shapiro–Wilk test was used. In order to study the relationship between bacterial and fungal counts, azole resistance, dust load, and Cq, the Spearman’s correlation coefficient was used, since the assumption of normality was not verified. The Kruskal–Wallis test was used to compare house divisions, since the assumption of normality was not confirmed. To compare the bacterial and fungal counts, azole resistance, and dust load between summer and winter, the Wilcoxon test was used, as the assumption of normality was also not observed.
3. Results
3.1. Dust Loading Rates
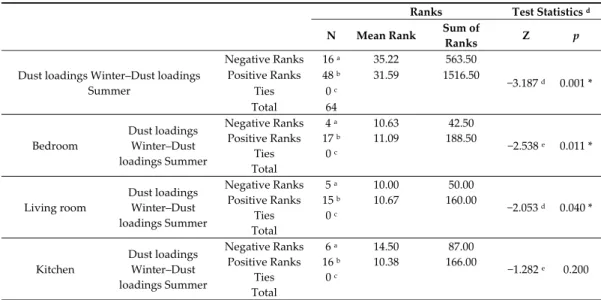
The highest values were registered in the three rooms of an apartment with a baby, still in the phase of changing diapers with the use talcum powder, in the kitchen of a dwelling where four cats remained full time, and in a terraced house in the vicinity of construction works (Table 3). Between summer and winter, statistically significant differences were detected in relation to dust load (z = −3.187, p = 0.001), with lower values in the cold season (Table 4).
Table 3. Seasonal dust loadings (mean standard deviation) in dwelling of the district of Aveiro. Values are given in mg/m2/day.
Winter Summer
Global mean 4.29 ± 4.51 5.70 ± 2.70 Bedrooms 4.03 ± 4.04 6.26 ± 2.74 Living rooms 3.55 ± 4.28 5.08 ± 2.63 Kitchens 5.38 ± 5.11 6.19 ± 2.68
Table 4. Comparison between dust loads (µg/cm2/day)in summer and winter.
Ranks Test Statistics d
N Mean Rank Sum of
Ranks Z p
Dust loadings Winter–Dust loadings Summer Negative Ranks 16 a 35.22 563.50 −3.187 d 0.001 * Positive Ranks 48 b 31.59 1516.50 Ties 0 c Total 64 Bedroom Dust loadings Winter–Dust loadings Summer Negative Ranks 4 a 10.63 42.50 −2.538 e 0.011 * Positive Ranks 17 b 11.09 188.50 Ties 0 c Total Living room Dust loadings Winter–Dust loadings Summer Negative Ranks 5 a 10.00 50.00 −2.053 d 0.040 * Positive Ranks 15 b 10.67 160.00 Ties 0 c Total Kitchen Dust loadings Winter–Dust loadings Summer Negative Ranks 6 a 14.50 87.00 −1.282 e 0.200 Positive Ranks 16 b 10.38 166.00 Ties 0 c Total
a Dust loadings Winter < Dust loadings Summer. b Dust loadings Winter > Dust loadings Summer. c Dust loadings Winter = Dust loadings Summer. d Based on negative ranks. e Based on positive ranks. * Statistically significant differences at the 5% significance level.
The comparison between house divisions in both seasons also revealed lower dust loads in the winter period for bedrooms (z = −2.538, p = 0.011) and living rooms (z = −2.053, p = 0.040). However, in the kitchens, no statistically significant differences were detected between summer and winter (z = −1.282, p = 0.200).
3.2. Bacterial Contamination
In EDC collected in summer, the total bacteria sedimentation rates ranged from 0 to 1.42 × 10⁵ CFU/m2/day, while the Gram-negative bacteria varied from 0 to 3.65 × 10³ CFU/m2/day. In winter samples, total bacteria and Gram-negative bacteria were in the range 0–1.07 × 10³ CFU/m2/day and 0– 8.67 × 10² CFU/m2/day, respectively (Table 5).
Table 5. Distribution of bacterial contamination on Electrostatic Dust Collector (EDC).
Summer
Mean (SD) CFU/m2/Day TSA 6.03 × 10³ (1.84 × 10⁴) VRBA 1.33 × 10² (5.50 × 10²)
Winter
Mean (SD) CFU/m2/day TSA 5.17 × 101 (1.73 × 10²) VRBA 1.15 × 101 (9.81 × 101)
3.3. Fungal Contamination
Fungal counts ranged from 0 to 3.18 × 10² CFU/m2/day on MEA and from 0 to 3.72 × 10² CFU/m2/day on DG18. Penicillium sp. presented the highest prevalence (1.45 × 10³ CFU/m2/day; 58.1%) on MEA media, followed by C. sitophila (2.48 × 10² CFU/m2/day; 9.92%). On DG18, the highest prevalence was found for Cladosporium sp. (1.45 × 10³ CFU/m2/day; 46.3%), followed by Penicillium sp. (1.09 × 10³ CFU/m2/day; 34.9%).
In winter samples, fungal counts ranged from 0 to 2.18 × 10² CFU/m2/day on MEA and from 0 to 3.34 × 10² CFU/m2/day on DG18. Penicillium sp. presented the highest prevalence on both media (1.47 × 10³ CFU/m2/day, 59.1% MEA; 1.69 × 10³ CFU/m2/day, 52.2% DG18), followed by Aspergillus sp. (3.22 × 10² CFU/m2/day, 13.0% MEA) and Cladosporium sp. (7.11 × 10² CFU/m2/day; 21.9% DG18) (Table 6).
Table 6. Fungal contamination found in each season.
Summer
MEA DG18
Fungi CFU/m2/Day % Fungi CFU/m2/Day %
Penicillium sp. 1.45 × 10³ 58.1 Cladosporium sp. 1.45 × 10³ 46.3 C. sitophila 2.48 × 10² 9.92 Penicillium sp. 1.09 × 10³ 34.9 Cladosporium sp. 1.92 × 10² 7.65 C. sitophila 2.25 × 10² 7.16 Aspergillus sp. 1.67 × 10² 6.67 Aspergillus sp. 1.99 × 10² 6.35
Other species 4.43 × 10² 17.7 Other species 1.68 × 10² 5.37
TOTAL 2.50 × 10³ 100 TOTAL 3.14 × 10³ 100
Winter
MEA DG18
Fungi CFU/m2/day % Fungi CFU/m2/day %
Penicillium sp. 1.47 × 10³ 59.1 Penicillium sp. 1.69 × 10³ 52.2 Aspergillus sp. 3.22 × 10² 13.0 Cladosporium sp. 7.11 × 10² 21.9 Fusarium sp. 2.21 × 10² 8.90 Chrysosporium sp. 5.49 × 10² 16.9 Cladosporium sp. 2.17 × 10² 8.75 Aspergillus sp. 1.61 × 10² 4.98
Other species 2.55 × 10² 10.3 Other species 1.30 × 10² 4.00
TOTAL 2.48 × 10³ 100 TOTAL 324 × 104 100
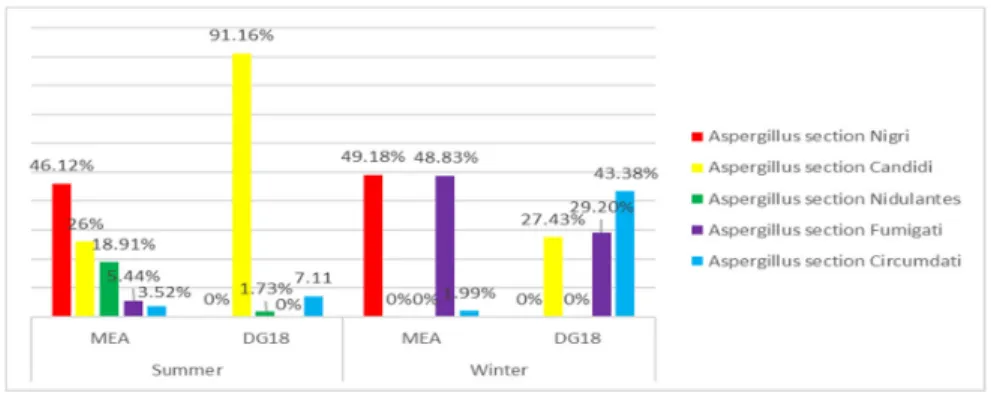
Among Aspergillus genus, section Nigri was found as the most prevalent in both seasons on MEA media (46.1% summer; 49.2% winter), followed by section Candidi in summer (26.0%) and section Fumigati in winter (48.8%). Regarding DG18 media, section Candidi presented the highest prevalence in summer (91.2%), followed by section Circumdati (7.11%). In winter, section Circumdati was identified as the most abundant (43.4%), succeeded by section Fumigati (29.2%) (Figure 2).
3.4. Azole-Resistance Screening
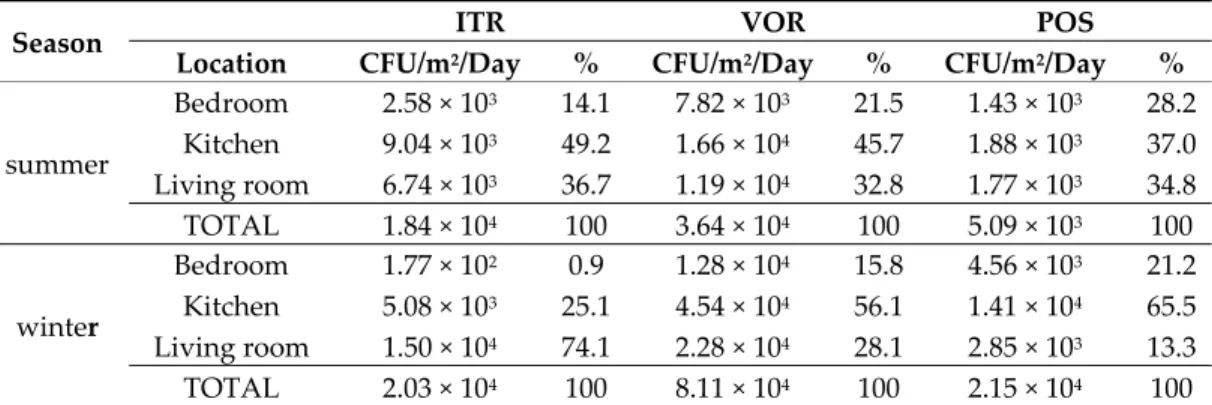
Azole resistance frequencies were as follows: From 43.5% (winter) to 60.9% (summer) in ITR, from 91.3% (winter) to 95.7% (summer) in VOR, and from 39.1% (summer) to 52.2% (winter) in POS. Pan-azole resistance (in homes where fungal growth was observed in the three azoles at tested concentrations) was found to be in the range from 21.7% (summer) to 30.4% (winter). Table 7 summarizes fungal burden found in each home location. Kitchens revealed the highest burdens among all tested azoles, with one exception. In fact, in wintertime, the fungal burden was higher in samples from living rooms cultivated in ITR media.
Table 7. Fungal burden found in each home location, per season.
Season ITR VOR POS
Location CFU/m2/Day % CFU/m2/Day % CFU/m2/Day %
summer Bedroom 2.58 × 10³ 14.1 7.82 × 10³ 21.5 1.43 × 10³ 28.2 Kitchen 9.04 × 10³ 49.2 1.66 × 10⁴ 45.7 1.88 × 10³ 37.0 Living room 6.74 × 10³ 36.7 1.19 × 10⁴ 32.8 1.77 × 10³ 34.8 TOTAL 1.84 × 10⁴ 100 3.64 × 10⁴ 100 5.09 × 10³ 100 winter Bedroom 1.77 × 10² 0.9 1.28 × 10⁴ 15.8 4.56 × 10³ 21.2 Kitchen 5.08 × 10³ 25.1 4.54 × 10⁴ 56.1 1.41 × 10⁴ 65.5 Living room 1.50 × 10⁴ 74.1 2.28 × 10⁴ 28.1 2.85 × 10³ 13.3 TOTAL 2.03 × 10⁴ 100 8.11 × 10⁴ 100 2.15 × 10⁴ 100
Results of identified fungal genera are presented in Table 8, organized by season, for SDA media only (which served as growth control without antimycotic), 4 mg/L itraconazole (ITR), 1 mg/L voriconazole (VOR), and 0.5 mg/L posaconazole (POS).
Table 8. Fungal levels found in EDCs during azole screening, per season.
SDA ITR VOR POS
Season Fungi CFU/m2/Day % CFU/m2/Day % CFU/m2/Day % CFU/m2/Day %
summer Aspergillus sp. 1.26 × 10³ 13.9 n.d. 0.0 n.d. 0.0 n.d. 0.0 Chrysosporium sp. 4.71 × 101 0.5 3.73 × 101 3.0 4.62 × 101 1.0 0.83 × 101 7.6 Cladosporium sp. 1.04 × 10² 1.1 2.50 × 101 2.0 5.45 × 101 1.2 n.d. 0.0 Fusarium sp. 0.83 × 101 0.1 0.83 × 101 0.7 0.41 × 101 0.1 0.41 × 101 3.8 Mucor sp. 2.07 × 10³ 22.9 n.d. 0.0 2.03 × 10³ 45.1 n.d. 0.0 Penicillium sp. 4.46 × 10² 4.9 1.99 × 10² 15.9 3.05 × 10² 6.8 9.64 × 101 88.6 Rhizopus sp. 4.07 × 10³ 45.0 9.84 × 10² 78.5 2.05 × 10³ 45.6 n.d. 0.0 Other species 1.04 × 10³ 11.5 n.d. 0.0 0.43 × 101 0.1 n.d. 0.0 TOTAL 9.05 × 10³ 100 1.25 × 10³ 100 4.50 × 10³ 100 1.09 × 10² 100 Winter Aspergillus sp. 1.75 × 10² 4.6 n.d. 0.0 0.72 × 101 1.3 n.d. 0.0 Chrysosporium sp. 1.12 × 10² 3.0 0.17 × 101 3.2 2.02 × 101 3.8 n.d. 0.0 Cladosporium sp. 2.44 × 101 0.6 0.90 × 101 17.5 2.25 × 10² 42.0 1.23 × 10² 70.2 Fusarium sp. 0.35 × 101 0.1 n.d. 0.0 n.d. 0.0 0.18 × 101 1.0 Mucor sp. 9.28 × 10² 24.3 n.d. 0.0 n.d. 0.0 n.d. 0.0 Penicillium sp. 8.36 × 10² 21.9 4.06 × 101 79.3 2.84 × 10² 52.9 5.02 × 101 28.8 Rhizopus sp. 1.71 × 10³ 44.8 n.d. 0.0 n.d. 0.0 n.d. 0.0 Other species 2.56 × 101 0.7 n.d. 0.0 n.d. 0.0 n.d. 0.0 TOTAL 3.81 × 10³ 100 5.13 × 101 100 5.37 × 10² 100 1.75 × 10² 100 n.d., not detected.
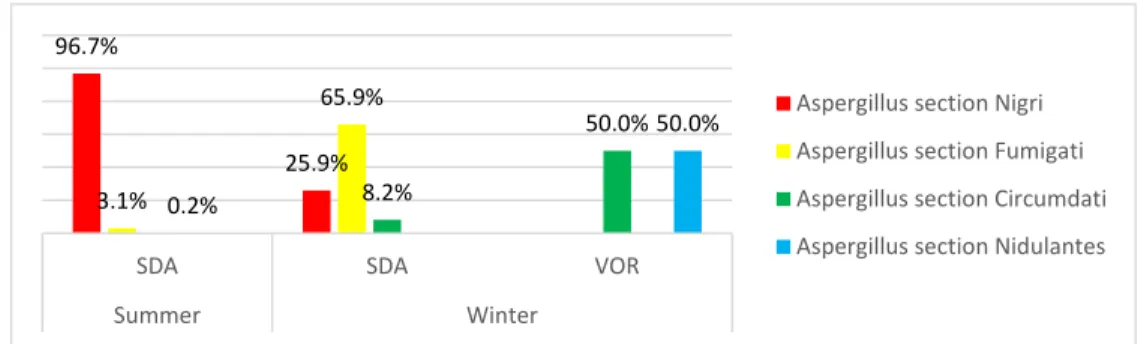
Among Aspergillus genera, sections Nigri (96.7% summer, 26.0% winter) and Fumigati (65.9% winter, 3.1% summer) presented the highest frequencies on SDA, whereas Aspergillus sections Circumdati and Nidulantes were detected in voriconazole supplemented SDA media in samples from the winter campaign (Figure 3).
Figure 3. Aspergillus sections identified in summer and winter EDC samples by the azole screening method.
3.5. Molecular Assessment
Aspergillus sections were detected by molecular tools in nine samples (9 out of 154 samples, i.e., 5.8%) in the winter season. In these nine EDCs, only one Aspergillus section was detected in each sample. Sections Fumigati and Nidulantes were detected in seven (4.6%, 7 out of 154 samples) and two samples (1.3%, 2 out of 154 samples), respectively (Table 9).
Table 9. Molecular detection of Aspergillus sections Fumigati and Nidulantes.
Aspergillus Section
Detected Sample Origin CFU.m
−2 (in MEA/DG18) Cq Fumigati Bedroom 0/0 32.6 0/0 34.9 Living room 1.06 × 10²/0 33.8 0/0 31.1 Kitchen 0/0 30.3 0/0 31.4 0/0 29.7 Nidulantes Bedroom 0/0 38.1 Kitchen 0/0 37.7 3.6. Correlation Analyses
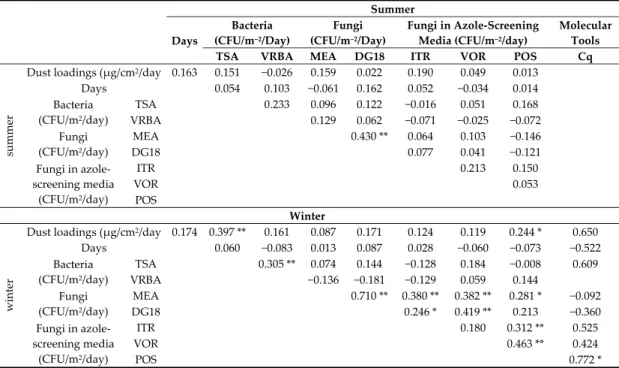
In summer, only a significant correlation was detected between fungal counts on MEA and on DG18 (rS = 0.430, p = 0.000), indicating that higher fungal counts on MEA is related to higher fungal counts on DG18 (Table 6).
In winter, more significant positive correlations were detected: (i) Dust loadings with bacteria counts on TSA (rS = 0.397, p = 0.001) and fungi in azole-screening on POS (rS = 0.244, p = 0.050); (ii) bacterial counts on TSA with bacterial counts on VRBA (rS = 0.305, p = 0.009); (iii) fungal counts on MEA and on DG18 (rS = 0.710, p = 0.000), and, at a lower extent, with fungal counts on ITR (rS = 0.380, p = 0.001), VOR (rS = 0.382, p = 0.001), and POS (rS = 0.281, p = 0.016); (iv) fungal counts on DG18 with fungal counts on ITR (rS = 0.246, p = 0.035) and VOR (rS = 0.419, p = 0.000); (v) fungal counts on ITR and POS (rS = 0.312, p = 0.006); (vi) fungal counts on VOR and on POS (rS = 0.463, p = 0.000); and (vii) fungal counts on POS with Cq (rS = 0.772, p = 0.015) (Table 10).
96.7% 25.9% 3.1% 65.9% 8.2% 50.0% 0.2% 50.0%
SDA SDA VOR
Summer Winter
Aspergillus section Nigri Aspergillus section Fumigati Aspergillus section Circumdati Aspergillus section Nidulantes
Table 10. Relationships between bacterial counts, fungal counts (MEA and DG18), azole resistance (itraconazole (ITR), voriconazole (VOR), and posaconazole (POS) media), and molecular tools (Cq) established by Spearman correlations.
Summer Days Bacteria (CFU/m−2/Day) Fungi (CFU/m−2/Day) Fungi in Azole-Screening Media (CFU/m−2/day)
Molecular Tools
TSA VRBA MEA DG18 ITR VOR POS Cq
su
mmer
Dust loadings (µg/cm2/day 0.163 0.151 −0.026 0.159 0.022 0.190 0.049 0.013
Days 0.054 0.103 −0.061 0.162 0.052 −0.034 0.014 Bacteria (CFU/m2/day) TSA 0.233 0.096 0.122 −0.016 0.051 0.168 VRBA 0.129 0.062 −0.071 −0.025 −0.072 Fungi (CFU/m2/day) MEA 0.430 ** 0.064 0.103 −0.146 DG18 0.077 0.041 −0.121 Fungi in azole-screening media (CFU/m2/day) ITR 0.213 0.150 VOR 0.053 POS Winter wi nter
Dust loadings (µg/cm2/day 0.174 0.397 ** 0.161 0.087 0.171 0.124 0.119 0.244 * 0.650 Days 0.060 −0.083 0.013 0.087 0.028 −0.060 −0.073 −0.522 Bacteria (CFU/m2/day) TSA 0.305 ** 0.074 0.144 −0.128 0.184 −0.008 0.609 VRBA −0.136 −0.181 −0.129 0.059 0.144 Fungi (CFU/m2/day) MEA 0.710 ** 0.380 ** 0.382 ** 0.281 * −0.092 DG18 0.246 * 0.419 ** 0.213 −0.360 Fungi in azole-screening media (CFU/m2/day) ITR 0.180 0.312 ** 0.525 VOR 0.463 ** 0.424 POS 0.772 *
** Correlation is significant at the 0.01 level (2-tailed). * Correlation is significant at the 0.05 level (2-tailed).
3.7. Comparison Analysis
The comparison between the three sampling locations, bedroom, living room, and kitchen, both in summer and winter, revealed statistically significant differences only for fungal counts on MEA for the cold period 𝜒 2 9.140, 𝑝 0.010 . The application of the Kruskal–Wallis test showed significant differences between the bedroom and the other divisions of the house. Fungal counts were found to be substantially higher in kitchens and living rooms (Figures 4 and 5). Furthermore, from the analysis of Figure 5, it can be observed that the trend is identical in summer and in winter, both in relation to bacterial and fungal counts and to fungal growth in azole-supplemented media.
Figure 4. Results of the Kruskal–Wallis multiple comparisons of bacterial and fungal counts, azole, and Cq in the three sampling locations (bedroom, living room, and kitchen), in summer.
Figure 5. Results of the Kruskal-Wallis multiple comparisons of bacterial and fungal counts, azole, and Cq in the three sampling locations (bedroom, living room, and kitchen), in winter.
Among the three types of geographical location of the houses (urban, rural, or suburban), no statistically significant differences were detected, either in summer or in winter, in relation to dust loadings, bacterial counts (TSA and VRBA), fungal counts (MEA and DG18), and azole resistance screening (ITR, VOR, and POS) (p’s > 0.05).
The comparison between seasons displayed statistically significant differences with higher values in winter for: (i) Bacterial counts on TSA (z = −6.624, p = 0.000), (ii) bacterial counts on VRBA (z = −2.761, p = 0.005), (iii) fungal counts on MEA, and (iv) fungal counts on DG18 (Table 11).
Table 11. Comparison between summer and winter for dust loads, bacterial and fungal counts, and azole screening resistance.
Ranks Test Statistics v
N Mean
Rank
Sum of
Ranks z p
TSA Winter (CFU/m2/day)-TSA Summer (CFU/m2/day) Negative Ranks 58 a 29.50 1711.00 −6.624 w 0.000 * Positive Ranks 0 b 0.00 0.00 Ties 6 c Total 64
VRBA Winter (CFU/m2/day)-VRBA Summer (CFU/m2/day) Negative Ranks 10 d 8.50 85.00 −2.761 w 0.006 * Positive Ranks 3 e 2.00 6.00 Ties 53 f Total 66
MEA Winter (CFU/m2/day)-MEA Summer (CFU/m2/day) Negative Ranks 16 g 13.63 218.00 −5.584 x 0.000 * Positive Ranks 49 h 39.33 1927.00 Ties 0 i Total 65
DG18 Winter (CFU/m2/day)-DG18 Summer (CFU/m2/day) Negative Ranks 8 j 15.13 121.00 −6.073 x 0.000 * Positive Ranks 55 k 34.45 1895.00 Ties 3 l Total 66
ITR Winter (CFU/m2/day)-ITR Summer (CFU/m2/day) Negative Ranks 15 m 14.97 224.50 −1.245 w 0.213 Positive Ranks 11 n 11.50 126.50 Ties 40 o Total 66
VOR Winter (CFU/m2/day)-VOR Summer (CFU/m2/day) Negative Ranks 23 p 25.39 584.00 −1.558 x 0.119 Positive Ranks 32 q 29.88 956.00 Ties 11 r Total 66
POS Winter (CFU/m2/day)-POS Summer (CFU/m2/day) Negative Ranks 10 s 10.70 107.00 −1.229 x 0.219 Positive Ranks 14 t 13.79 193.00 Ties 42 u Total 66
a TSA Winter < TSA Summer. b TSA Winter > TSA Summer. c TSA Winter = TSA Summer. d VRBA Winter < VRBA Summer. e RB Winter > RB Summer. f RB Winter = RB Summer. g MEA Winter < MEA Summer. h MEA Winter > MEA Summer. i MEA Winter = MEA Summer. j DG18 Winter < DG18 Summer. k DG18 Winter > DG18 Summer. l DG18 Winter = DG18 Summer. m ITRA Winter < ITRA Summer. n ITRA Winter > ITRA Summer. o ITR Winter = ITRA Summer. p VOR Winter < VOR Summer. q VOR Winter > VOR Summer. r VOR Winter = VOR Summer. s POS Winter < POS Summer. t POS Winter > POS Summer. u POS Winter = POS Summer. v Wilcoxon Signed Ranks Test. w Based on positive ranks. x Based on negative ranks. * statistically significant differences at the 5% significance level.
As observed for the dwellings, lower bacteria counts and higher fungal levels were detected in winter in bedrooms and living rooms. For kitchens, in the cold season, lower bacterial counts on TSA (z = −3.724, p = 0.000), and higher fungal counts on MEA (z = −3.389, p = 0.001) and DG18 (z = −3.620, p = 0.000) were found.
With regard to the characteristics of the dwellings (Table 1), comparisons were not possible due to the small number of observations.
4. Discussion
The use of the passive sampling methods in this study allowed the simultaneous collection of settleable dust, for extended periods, in several homes with wide spatial coverage and without disturbing daily life [43]. A single EDC analysis is equivalent to the sum of several air-impaction measurements, with much shorter sample collection duration, permitting a more consistent estimation of exposure [44]. Although settleable dust analysis is only a surrogate measure for airborne exposure, and differences between settled and airborne bioburden should be considered [28], with EDCs it was possible to obtain a greater fungal diversity. This situation was corroborated with Aspergillus sections counts, when compared to air samples collected by impaction or even with other passive methods, such as surface swabs, as it was the case in other studies [22]. Five different Aspergillus sections were observed in this study.
Sampling in parallel, and in duplicate, of settleable dust, whose sedimentation rates were gravimetrically determined according to an international standard, allowed a more accurate estimation of exposure levels inside the dwellings [43] and, together with the dwellings’ characteristics, can give indications about possible risks and assist in taking remedial measures.
Differences between sampling locations in the dwellings can be due to several reasons. In fact, particle deposition depends on the size of the particles, their sedimentation processes (gravity in the case of larger particles or diffusion in the case of smaller particles) [45], the amount of furniture indoors [46], the type of ventilation, and air turbulence caused by human activities [47].
The dust loading rates of the present study are lower than the values described for dwellings in arid regions, but close to those addressed in other European countries. Khoder and colleagues evaluated the loading rates of surface dust in domestic houses in an urban area of Giza, Egypt, reporting a mean value of 226 mg/m2/day [48]. Shraim and colleagues collected dust samples from 38 naturally ventilated houses of arid and dry climatic regions, documenting loading rates from 2.5 to 19.4 mg/m2/day, with a median of 8.5 mg/m2/week [49]. Seifert and colleagues registered mean values of 9.52 and 10.9 mg/m2/day in homes of the German adult and children population, respectively [50]. Overall, as in dust loading rates, bioburden presented a wider range in the summer season. This can be due to the fact that particles can act as carriers of bioburden inside dwellings through open
windows [51]. Since microbial exposures may have different sources, both indoors and outdoors, the air exchange rates (AER) may influence the indoor bioaerosol levels. It has been reported that the higher the AER, the more bioaerosols enter the home, especially when the outdoor temperature is favourable for the presence of microbial species [52]. Previous studies reported a positive correlation between the particulate matter concentration and the levels of airborne microorganisms [53]. In the present studies, bacterial counts were correlated with fungal counts on posaconazole. In fact, particles present in the air may be single microorganisms, groups of microorganisms, single or grouped spores, or fragments of organisms [54]. Overall, bioburden indoors can originate from outdoor air or from humans, e.g., building occupants or visitors, and can vary greatly depending on their activities [55]. Kitchens and living rooms revealed higher fungal counts when compared with bedrooms. This is likely because vegetables and fruits, which are generally prepared in the kitchen, can have an important role as fungal contamination sources [56]. The living room is where most of the visitors and dwelling occupants spend most of the time and this can impact the fungal counts, since human activities have influence on fungal profiles [57]. The fact that occupants spend more time at home in the winter season can also justify the increased fungal contamination in the kitchen [58]. However, the trend of bacterial contamination was opposite to that of fungi, presenting higher counts in the summer season. This can happen due to substrate competition between fungi and bacteria that can boost bacteria and restrict fungi dissemination [59].
Although correlated in the counts, MEA and DG18 presented a different distribution with respect to the species of observed. These results are in line with previous studies in which both culture media were used to obtain a wider characterization of the fungal diversity [30,39,60]. In fact, MEA is the culture media most applied to samples aiming at assessing indoor contamination. It is mainly suitable for yeasts and filamentous fungi, since it contains a high concentration of maltose and other saccharides as energy sources [61]. DG18 is more recently indicated as a better alternative for colony counting and to obtain higher diversity of genera, since this medium also contains dichloran, which inhibits spreading of fungi belonging to Mucorales order [22,62] and restricts the colony size of other genera [62]. Both culture media features justify the differences between the most prevalent fungi in the same sample.
Aspergillus sections were detected by molecular tools in nine samples from the winter season. In eight of them, it was not possible to identify the section detected with culture-based methods. This finding corroborates the need to apply both methods in parallel to achieve a better characterization of Aspergillus sections, thus overcoming the limitations of each method [2,22,29–31,63,64]. Indeed, culture-based methods provide information on the viable/culturable form required to estimate health risks, as it affects biological mechanisms, such as the cytotoxic and inflammatory responses [65], while molecular tools allow a rapid identification and are being gradually used to obtain data on the microbial biodiversity in different indoor environments [63].
As mentioned above, lower bacterial loads in winter, associated with higher amounts of time spent indoors during the cold season, may favor the proliferation of fungi in dwellings, as it was observed in this study. The most frequent fungal species in VOR in samples from the winter campaign were Penicillium sp., followed by Cladosporium sp., Chrysosporium sp., and Aspergillus sp., of which the most abundant were sections Circumdati and Nidulantes. These fungi agree relatively well with those observed in MEA and DG18.
The correlation between the presence of fungi in regular media (MEA and DG18) and azole-supplemented media (ITR, VOR, POS) might indicate some reduced susceptibility to antifungal drugs among the collected species in domestic environments. Several studies describe azole resistance as an emerging problem worldwide, including in Europe, challenging the treatment of azole-resistant Aspergillus disease, mainly caused by Aspergillus section Fumigati [33,34,66–68]. No active surveillance for azole resistance is performed in indoor air quality studies in Portugal and guidelines on how to perform it in complex and composite samples (such as environmental samples) are lacking. We have adapted the EUCAST referential (not well validated for azole resistance detection in fungal species other than Aspergillus section Fumigati) and have used a four-plate agar system to screen the resistance phenotype of fungal species collected in the environment, mostly by
passive sampling, as in the present study. Although this approach does not allow to establish a single resistance phenotype per fungal species, it is a broad and feasible strategy for resistance surveillance campaigns, which even enables the detection of unknown resistance mechanisms that might escape molecular detection [31,69].
On the other hand, the fact that higher values on POS were related to higher values of Cq suggests that fungal species with some reduced susceptibility to posaconazole might be from Aspergillus sp., although not observed by culture-based methods. This aspect reinforces, once more, the importance of an algorithm of combined methods (molecular and culture-based) for an accurate fungal assessment in the environment, as the one suggested previously to be applied in occupational environments with azole pressure [31].
5. Conclusions
The use of passive sampling methods to assess settleable dust and bioburden allowed having a wider pool of dwellings and sampling locations. Dust loading rates and bioburden presented a wider range in the summer season. However, fungal contamination increased in winter, while bacterial contamination decreased. Aspergillus sections Circumdati and Nidulantes were observed in VOR, as well as in MEA and DG18.
Overall, this study reinforces the importance of applying:
(a) Passive sampling methods in campaigns to assess sedimentable dust and bioburden in dwellings;
(b) MEA and DG18 when using culture-based methods to assess fungi;
(c) In parallel, with culture methods, molecular tools targeting the most suitable indicators of fungal contamination indoors;
(d) Azole resistance screening to unveil azole resistance detection in fungal species besides Aspergillus section Fumigati.
Author Contributions: Conceptualization, C.V.; formal analysis, C.V., M.D., B.A., E.V., L.A.C., and E.C.; funding acquisition, C.V., C.A.; Investigation, C.V. and C.A.; methodology, C.V., C.A.; project administration, C.A. C.A.; resources, C.V. and C.A.; supervision, C.V. and C.A.; writing—original draft, C.V., M.D., B.A., E.V., L.A.C., E.C., and C.A.; writing—review and editing, C.V. and C.A. All authors have read and agreed to the published version of the manuscript.
Funding: The financial support to CESAM (UIDP/50017/2020+UIDB/50017/2020) is also acknowledged. The sampling campaign was supported by the project “Chemical and toxicological SOurce PROfiling of particulate matter in urban air (SOPRO)”, POCI-01-0145-FEDER-029574, supported by FEDER, through COMPETE2020-Programa Operacional Competitividade e Internacionalização (POCI), and by national funds (OE), through FCT/MCTES. Estela Vicente thanks FCT and the POHP/FSE funding programme for the fellowship SFRH/BD/117993/2016.
Acknowledgments: H&TRC authors gratefully acknowledge the FCT/MCTES national support through the UIDB/05608/2020 and UIDP/05608/2020.
Conflicts of Interest: The authors declare no conflict of interest.
References
1. Almeida-Silva, M.; Almeida, S.M.; Wolterbeek, T.H. Elderly exposure to indoor air pollutants. Atmos. Environ. 2014, 85, 54–63.
2. Viegas, C.; Viegas, S.; Quintal Gomes, A.; Taubel, M.; Sabino, R. Exposure to Microbiological Agents in Indoor and Occupational Environments; Springer Nature: London, UK; Berlin, Germany; New York, NY, USA, 2017; doi:10.1007/978-3-319-61688-9.
3. Eduard, W.; Heederik, D.; Duchaine, C.; Green, B.J. Bioaerosol exposure assessment in the workplace: The past, present and recent advances. J. Environ. Monit. 2012, 14, 334–339, doi:10.1039/c2em10717a.
4. Sturm, R. Bioaerosol sin the lungs of subjects with different ages-part1: Deposition modeling. Ann. Transl. Med. 2016, 4, 211.
5. Bunger, J.; Antlauf-Lammers, M.; Schulz, T.; Westphal, G.; Muller, M.; Ruhnau, P.; Hallier, E. Health complaints and immunological markers of exposure to bioaerosols among biowaste collectors and compost workers. Occup. Environ. Med. 2000, 57, 458–464.
6. Douwes, J.; Thorne, P.; Pearce, N.; Heederik, D. Bioaerosol health effects and exposure assessment: Progress and prospects. Ann. Occup. Hyg. 2003, 47, 187–200.
7. Heldal, K.; Halstensen, A.S.; Thorn, J.; Djupesland, P.; Wouters, I.; Eduard, W.; Halstensen, T.S. Upper airway inflammation in waste handlers exposed to bioaerosols. Occup. Environ. Med. 2003, 60, 444–450. 8. Eduard, W.; Halstensen, A. Quantitative exposure assessment of organic dust. SJWEH Suppl. 2009, 7, 30. 9. Prussin, A.J.; Marr, L.C. Sources of airborne microorganisms in the built environment. Microbiome 2015, 3,
78, doi:10.1186/s40168-015-0144-z.
10. Cincinelli, A.; Martellini, T. Indoor Air Quality and Health. Int. J. Environ. Res. Public Health 2017, 14, 1286, doi:10.3390/ijerph14111286.
11. Adams, K.; Greenbaum, D.S.; Shaikh, R.; van Erp, A.M.; Russell, A.G. Particulate matter components, sources, and health: Systematic approaches to testing effects. J. Air Waste Manag. Assoc. 2015, 65, 544–558, doi:10.1080/10962247.2014.1001884.
12. Jayaprakash, B.; Adams, R.I.; Kirjavainen, P.; Karvonen, A.; Vepsäläinen, A.; Valkonen, M.; Järvi, K.; Sulyok, M.; Pekkanen, J.; Hyvärinen, A.; et al. Indoor microbiota in severely moisture damaged homes and the impact of interventions. Microbiome 2017, 5, 138, doi:10.1186/s40168-017-0356-5.
13. Mentese, S.; Arisoy, A.; Rad, A.Y.; Güllü, G. Bacteria and Fungi Levels in Various Indoor and Outdoor Environments in Ankara, Turkey. Clean-Soil Air Water 2009, 37, 487–493.
14. Ayanbimpe, G.M.; Wapwera, S.D.; Kuchin, D. Indoor air mycoflora of residential dwellings in Jos metropolis. Afr. Health Sci. 2010, 10, 172–176.
15. Ekhaise, F.O.; Isitor, E.E.; Idehen, O.; Emoghene, A.O. Airborne Microflora in the Atmosphere of an Hospital Environment of University of Benin Teaching Hospital (UBTH), Benin City, Nigeria. World J. Agric. Sci. 2010, 6, 166–170.
16. Ekhaise, F.O.; Ogboghodo, B.I. Microbiological indoor and outdoor air quality of two major hospitals in Benin City, Nigeria. Sierra Leone J. Biomed. Res. 2011, 3, 169–174.
17. Sudharsanam, S.; Swaminathan, S.; Ramalingam, A.; Thangavel, G.; Annamalai, R.; Steinberg, R.; Balakrishnan, K.; Srikanth, P. Characterization of indoor bioaerosols from a hospital ward in a tropical setting. Afr. Health Sci. 2012, 12, 217–225.
18. Salama, K.F.; Berekaa, M.M. Assessment of air quality in Dammam slaughter houses, Saudi Arabia. Int. J. Med. Sci. Public Health 2015, 5, 287–291.
19. Park, D.U.; Yeom, J.K.; Lee, W.J.; Lee, K.M. Assessment of the levels of airborne bacteria, gram-negative bacteria, and fungi in hospital lobbies. Int. J. Environ. Res. Public Health 2013, 10, 541–555.
20. Tang, C.S.; Wan, G.H. Air quality monitoring of the post-operative recovery room and locations surrounding operating theatres in a medical center in Taiwan. PLoS ONE 2013, 8, e61093.
21. Cabo Verde, S.; Almeida, S.M.; Matos, J.; Guerreiro, D.; Meneses, M.; Faria, T.; Botelho, D.; Santos, M.; Viegas, C. Microbiological assessment of indoor air quality at different hospital sites. Res. Microbiol. 2015, 166, 557–563.
22. Viegas, C.; Twarużek, M.; Lourenço, R.; Dias, M.; Almeida, B.; Caetano, L.A.; Carolino, E.; Gomes, A.Q.; Kosicki, R.; Soszczyńska, E.; et al. Bioburden Assessment by Passive Methods on a Clinical Pathology Service in One Central Hospital from Lisbon: What Can it Tell Us Regarding Patients and Staff Exposure? Atmosphere 2020, 11, 351.
23. Alves, C.A.; Candeias, C.; Nunes, T.V.; Tome, M.J.C.; Vicente, E.D.; Avila, P.F.; Rocha, F. Passive monitoring of particulate matter and gaseous pollutants in Fogo Island, Cape Verde. Atmos. Res. 2018, 214 250–262.
24. Beamer, P.I.; Sugeng, A.J.; Kelly, M.D.; Lothrop, N.; Klimecki, W.; Wilkinson, S.T.; Loha, M. Use of dust fall filters as passive samplers for metal concentrations in air for communities near contaminated mine tailings. Environ. Sci. Process. Impacts 2014, 16, 1275–1281.
25. Canha, N.; Almeida, S.M.; Freitas, M.C.; Trancoso, M.; Sousa, A.; Mouro, F.; Wolterbeek, H.T. Particulate matter analysis in indoor environments of urban and rural primary schools using passive sampling methodology. Atmos. Environ. 2014, 83, 21–34, doi:10.1016/j.atmosenv.2013.10.061.
26. American Conference of Governmental Industrial Hygienists (ACGIH). Threshold Limit Values for Chemical Substances and Physical Agents and Biological Exposure Indices; ACGIH: Cincinnati, OH, USA, 2009.
27. Kilburg-Basnyat, B.; Metwali, N.; Thorne, P.S. Performance of electrostatic dust collectors (EDCs) for endotoxin assessment in homes: Effect of mailing, placement, heating and electrostatic charge. J. Occup. Environ. Hyg. 2016, 13, 85–93.
28. Normand, A.C.; Vacheyrou, M.; Sudre, B.; Heederik, D.J.J.; Piarroux, R. Assessment of dust sampling methods for the study of cultivable- microorganism exposure in stables. Appl. Environ. Microbiol. 2009, 75, 7617–7623, doi:10.1128/AEM.01414-09.
29. Viegas, C.; Monteiro, A.; Aranha Caetano, L.; Faria, T.; Carolino, E.; Viegas, S. Electrostatic Dust Cloth: A Passive Screening Method to Assess Occupational Exposure to Organic Dust in Bakeries. Atmosphere 2018, 9, 64, doi:10.3390/atmos9020064.
30. Viegas, C.; Santos, P.; Almeida, B.; Monteiro, A.; Carolino, E.; Quintal Gomes, A.; Viegas, S. Electrostatic dust collector: A passive screening method to assess occupational exposure to organic dust in primary health care centers. Air Qual. Atmos. Health 2019, 12, 573–583, doi:10.1007/s11869-018-0650-9.
31. Viegas, C.; Almeida, B.; Caetano, L.A.; Afanou, A.; Straumfors, A.; Veríssimo, C.; Gonçalves, P.; Sabino, R. Algorithm to assess the presence of Aspergillus fumigatus resistant strains: The case of Norwegian sawmills. Int. J. Environ. Health Res. 2020, doi:10.1080/09603123.2020.1810210.
32. Denning, D.W.; Perlin, D.S. Azole resistance in Aspergillus: A growing public health menace. Future Microbiol. 2011, 6, 1229–1232.
33. Snelders, E.; Melchers, W.J.; Verweij, P.E. Azole resistance in Aspergillus fumigatus: A new challenge in the management of invasive aspergillosis? Future Microbiol. 2011, 6, 335–347, doi:10.2217/fmb.11.118. 34. Verweij, P.E.; Chowdhary, A.; Melchers, W.J.G.; Meis, J.F. Azole resistance in Aspergillus fumigatus: Can
we retain the clinical use of mold-active antifungal azoles? Clin. Infect Dis. 2016, 62, 362–368, doi:10.1093/cid/civ885.
35. Fisher, M.C.; Hawkins, N.J.; Sanglard, D.; Gurr, S.J. Worldwide emergence of resistance to antifungal drugs challenges human health and food security. Science 2018, 360, 739–742.
36. Monteiro, C.; Pinheiro, D.; Maia, M.; Faria, M.A.; Lameiras, C.; Pinto, E. Aspergillus species collected from environmental air samples in Portugal-molecular identification, antifungal susceptibility and sequencing of cyp51A gene on A. fumigatus sensu stricto itraconazole resistant. J. Appl. Microbiol. 2019, 126, 1140–1148, doi:10.1111/jam.14217.
37. American Industrial Hygiene Association. Field Guide for the Determination of Biological Contaminants in Environmental Samples, 2nd ed.; AIHA: Fairfax, VA, USA, 1996.
38. Madsen, A.M.; Matthiesen, C.B.; Frederiksen, M.W.; Frederiksen, M.; Frankel, M.; Spilak, M.; Timm, M. Sampling, extraction and measurement of bacteria, endotoxin, fungi and inflammatory potential of settling indoor dust. J. Environ. Monit. 2012, 14, 3230–3239.
39. Mayer, Z.; Bagnara, A.; FaÅNrber, P.; Geisen, R. Quantification of the copy number of nor-1, a gene of the aflatoxin biosynthetic pathway by real-time PCR, and its correlation to the CFU of Aspergillus flavus in foods. Int. J. Food Microbiol. 2003, 82,143–51, doi:10.1016/S0168-1605(02)00250-7.
40. Cruz-Perez, P.; Buttner, M.P.; Stetzenbach, L.D. Detection and quantitation of Aspergillus fumigatus in pure culture using polymerase chain reaction. Mol. Cell. Probes 2001, 15, 81–88, doi:10.1006/mcpr.2000.0343. 41. Viegas, C.; Faria, T.; de Oliveira, A.C.; Caetano, L.A.; Carolino, E.; Quintal-Gomes, A.; Twarużek, M.; Kosicki, R.; Soszczyńska, E.; Viegas, S. A new approach to assess occupational exposure to airborne fungal contamination and mycotoxins of forklift drivers in waste sorting facilities. Mycotoxins Res. 2017, 33, 285– 295, doi:10.1007/s12550-017-0288-8.
42. EPA, United States Environmental Protection Agency. About the National Exposure Research Laboratory (NERL). 2017. Available online: http://www.epa.gov/nerlcwww/moldtech.htm (accessed on 19 June 2017). 43. Viegas, C.; Almeida, B.; Dias, M.; Caetano, L.A.; Carolino, E.; Gomes, A.Q.; Faria, T.; Martins, V.; Marta Almeida, S. Assessment of Children’s Potential Exposure to Bioburden in Indoor Environments. Atmosphere 2020, 11, 993.
44. Institute of Medicine. Damp Indoor Spaces and Health; The National Academies Press: Washington, DC, USA, 2004.
45. Estokova, A.; Stevulova, N. Investigation of Suspended and Settled Particulate Matter in Indoor Air. In Atmospheric Aerosols–Regional Characteristics–Chemistry and Physics; Abdul-Razzak, H., Ed.; IntechOpen: London, UK, 2012; pp. 455–480, doi:10.5772/46130.
46. Thatcher, T.L.; Lai, A.C.K.; Moreno-Jackson, R.; Sextro, R.G.; Nazaroff, W.W. Effects of room furnishings and air speed on particle deposition rates indoors. Atmos. Environ. 2002, 36, 1811–1819, doi:10.1016/S1352-2310(02)00157-7.
47. Thatcher, T.L.; Layton, D.W. Deposition, resuspension, and penetration of particles within a residence. Atmos. Environ. 1995, 29, 1487–1497, doi:10.1016/1352-2310(95)00016-R.
48. Khoder, M.I.; Hassan, S.K.; El-Abssawy, A.A. An evaluation of loading rate ofd, Pb, Cd, and Ni and metals mass concentration in the settled surface dust in domestic houses and factors affecting them. Indoor Built Environ. 2010, 19, 391–399, doi:10.1177/1420326X10367284.
49. Shraim, A.M.; Alenazi, D.A.; Abdel-Salam, A.S.G.; Kumar, P. Loading rates of dust and metals in residential houses of arid and dry climatic regions. Aerosol Air Qual. Res. 2016, 16, 2462–2473.
50. Seifert, B.; Becker, K.; Helm, D.; Krause, C.; Schulz, C.; Seiwert, M. The German Environmental Survey 1990/1992 (GerES II): Reference concentrations of selected environmental pollutants in blood, urine, hair, house dust, drinking water and indoor air. J. Expo. Anal. Environ. Epidemiol. 2000, 10, 552–565.
51. Qian, J.; Ferro, A.R.; Fowler, K.R. Estimating the resuspension rate and residence time of indoor particles. J. Air Waste Manag. Assoc. 2008, 58, 502–516, doi:10.3155/1047-3289.58.4.502.
52. Frankel, M.; Bekö, G.; Timm, M.; Gustavsen, S.; Hansen, E.W.; Madsen, A.M. Seasonal variations of indoor microbial exposures and their relation to temperature, relative humidity, and air exchange rate. Appl. Environ. Microbiol. 2012, 78, 8289–8297, doi:10.1128/AEM.02069-12.
53. Dong, L.; Qi, J.; Shao, C.; Zhong, X.; Gao, D.; Cao, W. Concentration and size distribution of total airborne microbes in hazy and foggy weather. Sci. Total Environ. 2016, 541, 1011–1018.
54. Madelin, T.M.; Johnson, H.E. Fungal and actinomycete spore aerosols measured at different humidities with an aerodynamic particle sizer. J. Appl. Bacteriol. 1992, 72,400–409.
55. Aydogdu, H.; Asan, A.; Otkun, M.T. Indoor and outdoor airborne bacteria in child day-care centers in Edirne City (Turkey), seasonal distribution and influence of meteorological factors. Environ. Monit. Assess. 2010, 164, 53–66.
56. Bouakline, A.; Lacroix, C.; Roux, N.; Gangneux, J.P.; Derouin, F. Fungal contamination of food in hematology units. J. Clin. Microbiol. 2000, 38, 4272–4273, doi:10.1128/JCM.38.11.4272-4273.2000.
57. Dunn, R.R.; Fierer, N.; Henley, J.B.; Leff, J.W.; Menninger, H.L. Home life: Factors structuring the bacterial diversity found within and between homes. PLoS ONE 2013, 8, e64133.
58. Yamamoto, N.; Hospodsky, D.; Dannemiller, K.C.; Nazaroff, W.W.; Peccia, J. Indoor emissions as a primary source of airborne allergenic fungal particles in classrooms. Environ. Sci. Technol. 2015, 49, 5098–5106. 59. Mille-Lindblom, C.; Fischer, H.; Tranvik. L.J. Antagonism between bacteria and fungi: Substrate
competition and a possible tradeoff between fungal growth and tolerance towards bacteria. Oikos 2006, 113, 233–242, doi:10.1111/j.2006.0030-1299.14337.x.
60. Viegas, C.; Faria, T.; Monteiro, A.; Aranha Caetano, L.; Carolino, E.; Quintal Gomes, A.; Viegas, S. A Novel Multi-Approach Protocol for the Characterization of Occupational Exposure to Organic Dust—Swine Production Case Study. Toxics 2018, 6, 5, doi:10.3390/toxics6010005.
61. Hung, L.L.; Miller, J.D.; Dillon, H.K. Field Guide for the Determination of Biological Contaminants in Environmental Samples, 2nd ed.; Fairfax, V., Ed.; American Industrial Hygiene Association: Fairfax, VA, USA, 2005; pp. 3–100.
62. Wu, P.; Su, H.J.; Ho, H. A comparison of sampling media for environmental viable fungi collected in a hospital environment. Environ. Res. 2000, 82, 253–257.
63. Mbareche, H.; Veillette, M.; Bilodeau, G.J.; Duchaine, C. Fungal aerosols at dairy farms using molecular and culture techniques. Sci. Total Environ. 2019, 653, 253–263.
64. Madsen, A.M.; Frederiksen, M.W.; Jacobsen, M.H.; Tendal, K. Towards a risk evaluation of workers’ exposure to handborne and airborne microbial species as exempli fied with waste collection workers. Environ Res. 2020, 183, 109177, doi:10.1016/j.envres.2020.109177.
65. Croston, T.L.; Nayak, A.P.; Lemons, A.R.; Goldsmith, W.; Gu, J.K.; Germolec, D.R.; Beezhold, D.H.; Green, B.J. Influence of Aspergillus fumigatus conidia viability on murine pulmonary micro RNA and m RNA expression following subchronic inhalation exposure. Clin. Exp. Allergy 2016, 46, 1315–1327.
66. Arendrup, M.C. ‘Environmental study of azole-resistant Aspergillus fumigatus and other aspergilli in Austria, Denmark, and Spain’. Antimicrob. Agents Chem. 2010, 54, 4545–4549, doi:10.1128/AAC.00692-10. 67. Chowdhary, A.; Kathuria, S.; Xu, J.; Sharma, C.; Sundar, G.; Singh, P.; Gaur, S.; Hagen, F.; Klaassen, C.H.;
fumigatus Strains Carrying the TR34/L98H Mutations in the cyp51A Gene in India. PLoS ONE 2012, 7, e52871, doi:10.1371/journal.pone.0052871.
68. Chowdhary, A.; Kathuria, S.: Xu, J.; Meis, J.F. Emergence of Azole-Resistant Aspergillus fumigatus Strains due to Agricultural Azole Use Creates an Increasing Threat to Human Health. PLoS Pathog. 2013, 9, e1003633, doi:10.1371/journal.ppat.1003633.
69. Caetano, L.A.; Almeida, B.; Viegas, C. Assessment of azole resistance in clinical settings by passive sampling. In Health and Social Care Systems of the Future: Demographic Changes, Digital Age and Human Factors–HEPS 2019: Advances in Intelligent Systems and Computing; Cotrim, T., Serranheira, F., Sousa, P., Hignett, S., Albolino, S., Tartaglia, R., Eds.; Springer: Cham, Switzerland, 2019; 1012, 248–256.
Publisher’s Note: MDPI stays neutral with regard to jurisdictional claims in published maps and institutional affiliations.
© 2020 by the authors. Licensee MDPI, Basel, Switzerland. This article is an open access article distributed under the terms and conditions of the Creative Commons Attribution (CC BY) license (http://creativecommons.org/licenses/by/4.0/).