CIÊNCIAS AGRÁRIAS, ALIMENTARES E VETERINÁRIAS AGRICULTURAL SCIENCES, FOOD AND VETERINARY
CIENCIAS AGRÍCOLAS, ALIMENTOS Y VETERINARIA
mill
e
nium
23
Millenium, 2(7), 23-37.
IMPLEMENTAÇÃO DO CONTROLO ESTATÍSTICO DO PROCESSO NUMA LINHA DE ENGARRAFAMENTO NA
INDÚSTRIA VINÍCOLA
IMPLEMENTATION OF STATISTICAL PROCESS CONTROL IN A BOTTLING LINE IN WINERY INDUSTRY
IMPLEMENTACIÓN DEL CONTROL ESTADÍSTICO DEL PROCESO EN UNA LÍNEA DE ENGARRAFAMENTO EN LA
INDUSTRIA VINÍCOLA
António Abreu
1José Gomes Requeijo
2João Calado
31Instituto Superior de Engenharia de Lisboa, Lisboa, Portugal 2
Universidade Nova de Lisboa, Faculdade de Ciências e Tecnologias, Departamento de Engenharia Mecânica e Industrial, Caparica, Portugal
3
Instituto Politécnico de Lisboa, Departamento de Engenharia Mecânica do Instituto Superior de Engenharia de Lisboa, Lisboa, Portugal
António Abreu - [email protected] | José Gomes Requeijo - [email protected] | João Calado - [email protected]
Corresponding Author António Abreu
Instituto Superior de Engenharia de Lisboa Rua Conselheiro Emídio Navarro, 1 1959-007 Lisboa, Portugal
RECEIVED: 28th March 2018 ACCEPTED: 13th September 2018
Abreu, A., Requeijo, J. G. & Calado J. (2018). Implementation of statistical process control in a bottling line in winery industry. Millenium, 2(7), 23-37.
DOI: https://doi.org/10.29352/mill0207.02.00180
m
24
7
RESUMO
Introdução: A grande exigência dos mercados tem conduzido a situações em que os sistemas produtivos são caracterizados pela
produção de diversos lotes mas de reduzida dimensão. Este novo paradigma exige que sejam desenvolvidas técnicas adequadas, tanto em termos de planeamento como em termos de Controlo Estatístico do Processo (SPC), uma vez que podem existir situações em que não é possível proceder à recolha de dados suficientes para se estimar convenientemente os parâmetros do processo (média e variância).
Objectivos: Implementação do Controlo Estatístico do Processo na indústria vitivinícola para melhorar a qualidade do produto final. Métodos: Quando nos confrontamos com situações em que não é possível proceder à recolha suficiente de dados, a abordagem
sugerida consiste em adotar os desenvolvimentos propostos por Charles Quesenberry. Nestes casos, a estatística da amostra no instante i é transformada através das estimativas dos parâmetros do processo recorrendo à informação obtida (dados) até ao instante (i-1). O estudo univariado da capacidade do processo é realizada através dos índices de capacidade QL e QU. São
abordadas duas situações de controlo estatístico, uma em que é feito um estudo univariado, com base em cartas Q, e outra em que é feito o estudo multivariado, com base nas cartas MQ.
Resultados: Este estudo refere-se à implementação do SPC , de uma marca de vinho que possui baixos volumes de produção, no
seu processo de engarrafamento, que é considerado que é considerado uma etapa critica uma vez que é necessário ter alguns cuidados como por exemplo o evitar a ocorrência de contaminações microbiológicas ou a oxidação do vinho.
Conclusões: Sempre que não seja possível aplicar cartas de controle tradicionais, a utilização das cartas de controlo Q (análise
univariada) e as cartas de controlo MQ (análise multivariada) revela-se a escolha mais adequada, não só para o controlo de um ou mais produto como para vários conjuntos de características da qualidade.
Palavras-chave: SPC (Controlo Estatístico do Processo), Cartas de Controlo, Cartas de Controlo MQ, Short-Runs, Capacidade do
Processo
ABSTRACT
Introduction: The great demand of the markets has led to situations in which the production systems are characterized by the
production of several batches but of small size. This new paradigm requires that adequate techniques be developed, both in terms of planning and in terms of Statistical Process Control (SPC), since there may be situations where it is not possible to collect enough data to properly estimate the parameters of the process (mean and variance).
Objectives: Implementation of Statistical Process Control techniques in a wine industry in order to improve its final product. Methods: Whenever there is not enough data to properly estimate the parameters of the process, the suggested approach, is to
adopt the developments proposed by Charles Quesenberry. In this case, the statistic of the sample at time i is transformed through the estimations of the process parameters using the information obtained (data) until the instant (i-1). The univariate study of process capability is performed through the capability indices QL and QU. Thus, in this paper, two situations of statistical
control are addressed, one in which a univariate study is done, based on Q charts, and another in which the multivariate study is made, based on the MQ charts.
Results: This study comprised the implementation of the SPC) of a wine brand that has low production volumes, in the process
of bottling wine, which is considered a critical step since some care is needed, such as avoiding the occurrence of microbiological contaminations or oxidation of the wine.
Conclusions: Whenever it is not possible to apply traditional control charts the use of the control Q charts (univariate analysis)
and the control MQ charts (multivariate analysis) are the most appropriate choice not only for the control of one or more products but also for several sets of quality characteristics.
Keywords: Statistical Process Control, Control Charts, MQ Control Charts, Short-Runs, Process Capability.
RESUMEN
Introducción: La gran exigencia de los mercados ha conducido a situaciones en que los sistemas productivos se caracterizan por
la producción de diversos lotes de reducida dimensión. Este nuevo paradigma exige que se desarrollen técnicas adecuadas tanto en términos de planificación como de control estadístico del proceso (SPC), ya que pueden existir situaciones en las que no es posible proceder a la recogida de datos suficientes para estimar convenientemente los parámetros del proceso (media y varianza).
Objetivos: Aplicación del control estadístico del proceso en la industria vitivinícola para mejorar la calidad del producto final. Métodos: Cuando nos enfrentamos con situaciones en que no es posible proceder a la recogida suficiente de datos, el enfoque
sugerido consiste en adoptar los desarrollos propuestos por Charles Quesenberry. En estos casos, la estadística de la muestra en el instante i se transforma a través de las estimaciones de los parámetros del proceso recurriendo a la información obtenida
Abreu, A., Requeijo, J. G. & Calado J. (2018).
Implementation of statistical process control in a bottling line in winery industry. Millenium, 2(7), 23-37.
DOI: https://doi.org/10.29352/mill0207.02.00180
m
7
25
(datos) hasta el instante (i-1). El estudio univariado de la capacidad del proceso se realiza a través de los índices de capacidad QL y QU. Se abordan dos situaciones de control estadístico, una en que se realiza un estudio univariado, basado en cartas Q, y otra en que se realiza el estudio multivariado, sobre la base de las cartas MQ.
Resultados: Este estudio se refiere a la implementación del SPC, de una marca de vino que tiene bajos volúmenes de
producción, en su proceso de embotellado, que se considera que se considera una etapa crítica, ya que es necesario tener algunos cuidados como por ejemplo evitar que se produzcan contaminaciones microbiológicas o la oxidación del vino.
Conclusiones: Siempre que no sea posible aplicar cartas de control tradicionales, la utilización de las cartas de control Q (análisis
univariado) y las cartas de control MQ (análisis multivariado) se revela la elección más adecuada, no sólo para el control de uno o más producto como para varios conjuntos de características de calidad.
Palabras clave: SPC (Control Estadístico del Proceso), Cartas de Control, Cartas de Control MQ, Short-Runs, Capacidad del
Proceso
INTRODUCTION
The Statistical Process Control (SPC) has become a crucial tool to ensure the competitive advantage of any company in relation to its competition. The demand of consumers, due to the consistency of quality, entails great efforts at the level of guaranteeing the stability of the processes and of minimizing the variability around the desired values for the quality characteristics. According to Pereira and Requeijo (2012) and Qiu (2014) The major goal of SPC is to monitor sequential processes, to ensure that they operating stably and satisfactorily by constructing a statistical control charts that allow not only reducing the inherent variability of the process, but also estimate the parameters to it and to determine if it is capable of producing according to the specifications defined in the design and development phase.
The univariate control charts were introduced by Shewhart (1931) and have been used in several industrial environments, both for the control of discrete variables and for the control of continuous variables. This type of statistical techniques assumes Normality, Randomness and Independence of data. In situations where there is a need to control various quality characteristics, multivariate control charts are more advantageous since they allow the simultaneous analysis of two or more characteristics in a single chart. As in the univariate study it is necessary to confirm the Normality, Randomness and Independence of the data used. This topic has been developed by several authors, Pignatiello and Runger (1990), Pereira and Requeijo (2012), Montgomery (2012), Wand et al. (2015), between others. However there are situations in which there is no possibility of estimating the process parameters due to insufficient data available. To this end, the developments of Quesenberry (1997) should be used, which transforms a certain statistic of a sample of a certain quality characteristic under study, X, in a variable, Q, which in turn follows, approximately, the Standard Normal distribution, with mean zero and variance one. For the multivariate situation, these developments were adapted where the statistic MQ represents a transformation of the vector of means at a given instant r. The paper is organized as follows. Section 2 presents the authors’ proposed methodology. Section 3 provides the background to understand the Statistic Process Control univariate approach, while Section 4 describes the background for the Statistic Process Control multivariate approach. Section 5 includes a case study based on an industry of the wine sector aiming to assess the robustness of the authors´ proposed approach, including a discussion of the results achieved. In Section 6 some concluding remarks are provided.
1. METHODS
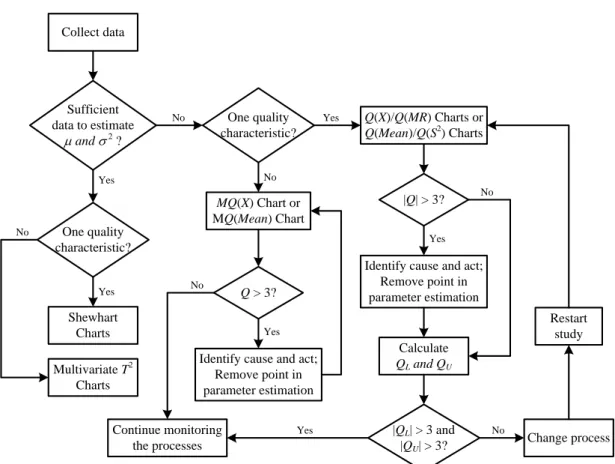
When the amount of data concerning the quality characteristics of the study are restricted i.e., when there is not enough information to properly estimate the process parameters, the authors of this paper suggest the methodology depicted in Figure 1.
Abreu, A., Requeijo, J. G. & Calado J. (2018). Implementation of statistical process control in a bottling line in winery industry. Millenium, 2(7), 23-37.
DOI: https://doi.org/10.29352/mill0207.02.00180
m
26
7
Figure 1. A holistic methodology for implementation of the SPC
2. UNIVARIATED SPC
The implementation of SPC depends on the amount of data available in the control of the various characteristics of the quality under study. Thus, there are two distinct situations, when there are enough data to properly estimate the process parameters (mean and variance) and when there is a limited amount of data which prevents a proper estimation of the processes parameters.
When it is possible to conveniently estimate the process parameters, the SPC is developed in two stages, Phase I and Phase II, using the traditional charts of Shewhart (Phase I) and with dimensionless Z and W charts (Phase II). It should be noted that the study is only one quality characteristic, it should be applied in the Phase I of SPC the charts of Shewhart. For several characteristics/products to be controlled, it is suggested to implement the Z and W charts which include all the characteristics/products in the same chart.
2.1. Sufficient Data
For the correct implementation of the Shewhart charts (Traditional Control Charts), in addition to Normality, Independence and Randomness, it is necessary to ensure that the sampling frequency, or individual observations, is made within a period of time that is significant enough to ensure that the data collected reflect the behaviour of the process. Authors as Quesenberry (1997), Pyzdek (1999), Ryan (2000), Pereira and Requeijo (2012) and Montgomery (2012), between others, consider that the procedure for the construction of control charts is based on two distinct phases. A first phase (Phase I) in which the stability of the process is verified in order to estimate its parameters and to study its capability. And a second phase (Phase II) which, after being confirmed in Phase I, the process is controlled and which has ability to produce according to the technical specification required, then proceeds to the monitoring thereof.
2.1.1. Phase I
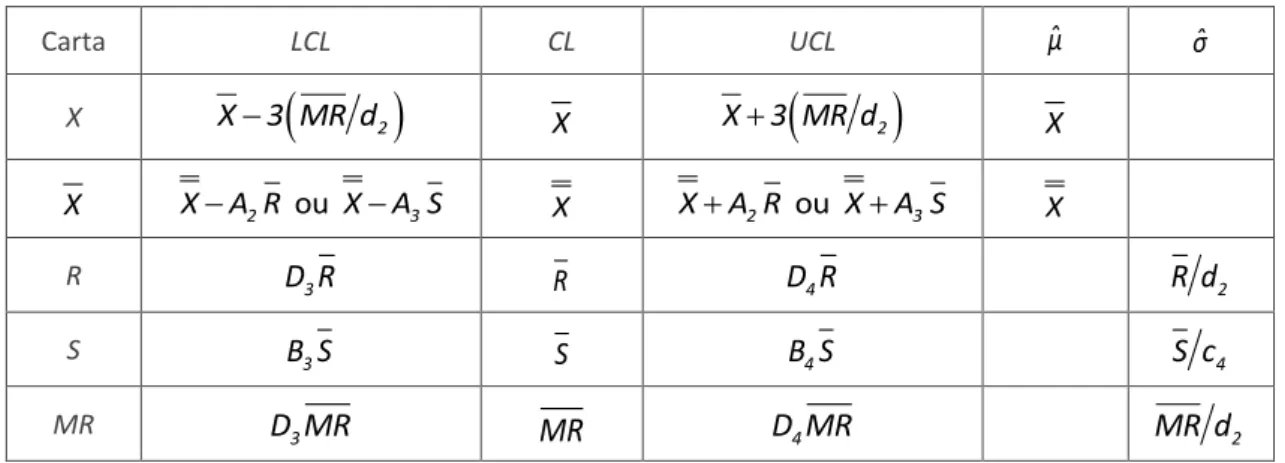
At this stage the stability of the process is ascertained, as such the upper and lower control limits are calculated (UCL and LCL, respectively), which in turn are at a distance from the center line (CL) of 3 standard deviation of the sample statistical distribution to be controlled, which corresponds to a level of significance of 0,27%. After checking that the process is under control, that is, when all samples corresponding to special causes have been removed and no non-random patterns are evident, the parameters must be estimated. The various estimates, calculated from the data collected, are presented in Table 1.
Collect data Sufficient data to estimate m and s 2 ? Yes Q(X)/Q(MR) Charts or Q(Mean)/Q(S2) Charts |Q| > 3?
Identify cause and act; Remove point in parameter estimation Calculate QL and QU |QL| > 3 and |QU| > 3? Change process Restart study Multivariate T2 Charts One quality characteristic? Shewhart Charts Yes No One quality characteristic? No No Yes MQ(X) Chart or MQ(Mean) Chart No Yes No Yes Q > 3?
Identify cause and act; Remove point in parameter estimation Yes Continue monitoring the processes No
Abreu, A., Requeijo, J. G. & Calado J. (2018).
Implementation of statistical process control in a bottling line in winery industry. Millenium, 2(7), 23-37.
DOI: https://doi.org/10.29352/mill0207.02.00180
m
7
27
Table 1 - Control Limits for Shewhart charts of Phase I and process parameters estimators.
Carta LCL CL UCL
ˆμ
ˆσ XX 3 MR d
2
X
X 3 MR d
2
X
X
X A R
2ou
X A S
3 XX A R
2ou
X A S
3 X RD R
3R
D R
4R d
2 SB S
3S
B S
4S c
4 MRD MR
3MR
D MR
4MR d
2In the equations in Table 1 it is considered:
n sample size;
m
estimated process mean;s
estimated process standard deviation; X individual observation;R sample range;
S sample standard deviation; MR moving range;
X
sample mean;X average of the samples means;
R
average of the range samples;S
average of the samples standard deviations;MR
average of the moving ranges;2
, A , , , , D , d , c
3 3 4 3 4 2 4A
B B D
constants that depend on the sample size n.After verifying that the process is under statistical control and to make the estimation of their parameters, it is possible to analyse the process capability with regard to its technical specification, in which LSL is the lower specification limit and USL is the upper specification limit. Usually are used the indexes, Cp and Cpk, for Normally distributed data, which in turn can be obtained
through the following equations:
p USL LSL C 6 σ (1)
, pk pk L pk U C min C C (2)
pk Lμ L SL
C
3 σ
(3)
Cpk UUSL μ 3 σ (4)Traditionally a process is considered capable if Cp and Cpk are simultaneously greater than 1.33 if the technical specification is
bilateral, or 1.25 if one is faced with unilateral technical specifications. In order to confirm the assumptions mentioned above, it is suggested to use the Test of Kolmogorov-Smirnov to verify the Normality of the process and the implementation of the Auto Correlation Functions (ACF) and Partial Auto Correlation Functions (PACF), to verify the independence.
Abreu, A., Requeijo, J. G. & Calado J. (2018). Implementation of statistical process control in a bottling line in winery industry. Millenium, 2(7), 23-37.
DOI: https://doi.org/10.29352/mill0207.02.00180
m
28
7
2.1.2. Phase II
Once the stability of the process has been verified, the parameters of the process have been estimated and the capability study has been carried out, there are conditions to proceed to Phase II of the SPC that is related to process monitoring.
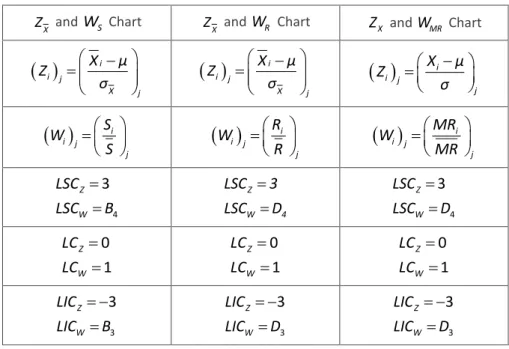
When there are several characteristics/products under control, it is suggested the use of Z and W charts. These charts are constructed based on the transformation of a variable X (or
X
) and S (or R, or MR), thus allowing different characteristics of various products to be represented on the same chart. In Table 2, for a instant i and product j, we present the equation used in the calculation of the statistics of the charts Z and W.Table 2 – Statistics of the Z and W charts and their control limits and centreline.
X
Z and
W
S Chart ZX andW
R ChartZ
X andW
MR Chart
i i j X jX
μ
Z
σ
i i j X jX
μ
Z
σ
i i j jX
μ
Z
σ
i i j jS
W
S
i i j jR
W
R
i i j jMR
W
MR
43
Z WLSC
LSC
B
Z W 4LSC
3
LSC
D
43
Z WLSC
LSC
D
0
1
Z WLC
LC
0
1
Z WLC
LC
0
1
Z WLC
LC
33
Z WLIC
LIC
B
33
Z WLIC
LIC
D
33
Z WLIC
LIC
D
In the equations in Table 2 it is considered the following notation:
n
i j - sample size i for product j;
R
i j - sample range i for product j;
S
i j - sample standard deviation i for product j;
MR
i
j - moving range i for product j;
i jX - sample mean i for product j;
S j - average of the samples standard deviations for product j;
R j - average of the range samples for product j;
m
j - process mean relative to characteristic X for product j;
s
j - process standard deviation relative to characteristic X for product j;
s
Xj - standard deviation of the sample means distribution for the product j.
With this type of charts, it is possible to analyse the process capability in real time through the indices ZL and ZU, developed by
Pereira and Requeijo (2012). Table 3 presents the equations that allow to obtain the respective estimators and indices at each moment r.
Abreu, A., Requeijo, J. G. & Calado J. (2018).
Implementation of statistical process control in a bottling line in winery industry. Millenium, 2(7), 23-37.
DOI: https://doi.org/10.29352/mill0207.02.00180
m
7
29
Table 2 - Capacity index and parameters estimators for the charts Z
Index/Estimator Equation
ˆZ
U r j r r j ˆ USL μ ˆ k σ
ˆZ
L r j r r j ˆ LSL μ ˆ k σ
r rˆμ
X
X
r
1
r 1 X
r 1
X , r 2, 3,
r
r
r rˆμ
X
X
r
1
r 1 X
r 1
X , r 2, 3,
r
r
r r 4S
ˆσ
c
r
r 1 r
1 S r 1 S S , r 2, 3, r
r r 2R
ˆσ
d
r
r 1 r
1 R r 1 R R , r 2, 3, r
r r 2MR
ˆσ
d
r
r 1 r
1 MR r 1 MR MR , r 2, 3, rTo be capable, the index ZU must be greater than 3 and the index ZL must be lower than -3. The value of k is usually equal to 1.33
for bilateral specifications and 1.25 for unilateral specifications.
2.2. Restricted Data
In situations where there are insufficient data to estimate the parameters of a particular process, should be used the approach proposed by Quesenberry (1997), which are based on the construction of the Q charts. As in the situation where there is sufficient data, the data collected must follow an approximately Normal distribution and must be independent.
In the case of data being individual observations, one should use the Q(X) chart in the control of the process mean and the
Q(MR) chart in controlling the process dispersion. To the Q(X) chart, the value of individual observation X, in a certain moment r (Xr), is transformed into statistics Qr(Xr) given by the following equation:
1 r r 1 r r r 2 r 1 X X r 1 Q X G r 3, 4, r S , (5)Regarding the Q(MR) chart the statistic that is represented graphically, in order to control the dispersion for a certain instant r, is given by the following equation:
2 1 r r r 1,ν 2 2 2 2 4 r 2 ν MR Q MR F r 4, 6, MR MR MR , (6)In equations (5) and (6) the following notation was used:
r
X
- observation in instant r;1
r
X
- average of the
r
1
observations;1
r
Abreu, A., Requeijo, J. G. & Calado J. (2018). Implementation of statistical process control in a bottling line in winery industry. Millenium, 2(7), 23-37.
DOI: https://doi.org/10.29352/mill0207.02.00180
m
30
7
r
MR
- moving range determined in the observation r;
1 - inverse of the Normal Distribution Function;
G
- Distribution Function t-student, with freedom degrees;
1,2
F
- Fisher Distribution Function, with
1 and
2freedom degrees.Since the variables Q(X) and Q(MR) are Normally distributed according to the Standard Normal distribution, the control limits of these charts are given by,
and
Q X Q MR Q X Q MR Q X Q MRUCL
3 UCL
3
CL
0
CL
0
LCL
3 LCL
3
(7)As regards the situation where the data collected are samples, should be made to the construction of the
Q X
and Q(S2) charts. The statistic represented graphically in theQ X
chart for the sample i, is given by the following equation:
1 i
1 i i ν ν i i i Q X G ω , i 2, 3, , ν n 1 (8) where,
i i 1 i 1 i 1 i 1 i p,i 1 n n n X X ω , i 2, 3, n n s(9)
To control the dispersion, it should be represented in the Q(S2) chart, for a sample i, the statistic given by the following equation:
i 1 i 1
2 1 i i ν ,ν ν i i i Q S F
, i 2, 3, , ν n 1 (10) where,
i2 i 2 p,i 1 S , i 2, 3, S(11)
i 2 j j 2 2 j 1 2 1 1 i i p,i i i i 1 i j j 1 ν S ν S ν S S , ν n 1 ν ν ν (12)As in the situation where the data are individual observations, the variables
Q X
and Q(S2) are Normally distributed according to a standard Normal distribution, so the control limits of these charts will be given by, and 2 2 2 Q X Q S Q X Q S Q X Q S UCL 3 UCL 3 CL 0 CL 0 LCL 3 LCL 3 (13)
Regarding the process capability, it is monitored in real time as the data are collected based on the indexes QL and QU. Table 4
Abreu, A., Requeijo, J. G. & Calado J. (2018).
Implementation of statistical process control in a bottling line in winery industry. Millenium, 2(7), 23-37.
DOI: https://doi.org/10.29352/mill0207.02.00180
m
7
31
Table 3 – Capability index for charts Q.
Carta
Q
LQ
Um
ˆ
rs
ˆ
r
Q X
r L r r ˆ L SL μ ˆ Q ˆ k σ
r U r r ˆ USL μ ˆ Q ˆ k σX
r r 4S
c
Q X
r L r r ˆ L SL μ ˆ Q ˆ k σ
r U r r ˆ USL μ ˆ Q ˆ k σX
r p,r 4S
c
As in the case of the Z and W charts, for the process to be capable it is necessary that the index QL is lesser than -3 and the index
QU is greater than 3. The value of k is usually equal to 1.33 for bilateral specifications and 1.25 for unilateral specifications.
3. MULTIVARIATE SPC
When it is desired to control more than one quality characteristic simultaneously, multivariate statistical control appears as the most adequate alternative, since it allows controlling simultaneously the two or more variables under study, as well as the correlation between them, being only necessary the construction of a control chart. In addition, joint control of variables may allow the identification of potential alarming situations, which in turn could be overlooked in the univariate charts. As univariate SPC, there are two distinct situations, when there is sufficient data to adequately estimate the process parameters (mean vector and the covariance matrix) and when the amount of data is insufficient for adequate estimation of the parameters.
3.1. Sufficient Data
When there are sufficient data to adequately estimate the mean vector of the process and the matrix of covariance, multivariate
SPC is based, like the univariate SPC, in two distinct phases (Phase I and Phase II). In Phase I the stability of the process is verified
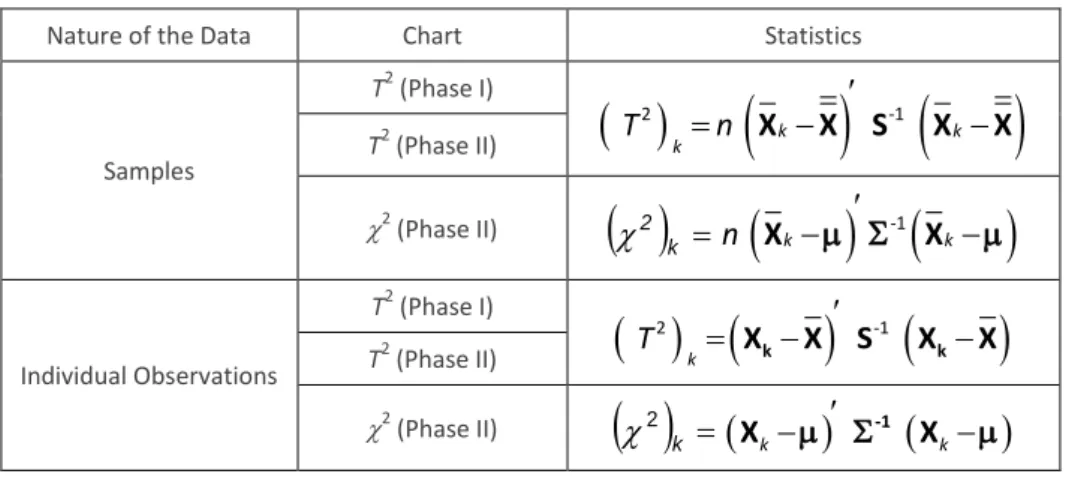
and the process capability is analysed. In Phase II, the process is monitored. The assumptions to be verified are identical to those of the univariate study. The T2 chart is the statistical technique of excellence for the multivariate control of the mean vector of the process. Table 5 shows the types of multivariate control charts and statistics that are plotted.
Table 4 – Multivariate control charts and their statistics.
Nature of the Data Chart Statistics
Samples T2 (Phase I)
2
-1
k k kT
n
X
X S X
X
T2 (Phase II) 2 (Phase II)
k 2
m
-1
m
k kn X
X
Individual Observations T2 (Phase I)
2
-1
kT
X
kX S X
kX
T2 (Phase II) 2 (Phase II)
2 k
X
k
m
-1X
k
m
Abreu, A., Requeijo, J. G. & Calado J. (2018). Implementation of statistical process control in a bottling line in winery industry. Millenium, 2(7), 23-37.
DOI: https://doi.org/10.29352/mill0207.02.00180
m
32
7
Table 5 - Control Limits for Multivariate Charts
Nature of the Data Chart UCL LCL
Samples T2 (Phase I)
11
1
1
;p ,mn m pp m
n
F
mn m p
0 T2 (Phase II)
11
1
1
;p ,mn m pp m
n
F
mn m p
2 (Phase II)
2;p Individual Observations T2 (Phase I)
2 2 1 21
;p , m pm
m
T2 (Phase II)
1
1
;p ,m pp m
m
F
m m p
2 (Phase II)
2;pIn the equations in Table 5 and Table 6 the following notation was used:
n sample size; m number of samples;
p number of quality characteristics; k
X
individual observations vector at instant k; kX
mean vector of sample k;X mean vector of samples average; S sample covariances matrix;
m
process mean vector;
process covariances matrix;
;a ,b right percentile, for a probability , of a Beta distribution with parameters a and b; ;1,2
F
right percentile, for a probability , of a Fisher distribution with 1 and 2 freedom degrees in numerator anddenominator respectively.
2;p right percentile, for a probability , of a Chi-Square distribution with freedom degrees.
In this type of control charts, after identifying and removing all special causes of variation, the process capability is studied. In the scope of the multivariate capability study, it is suggested to use of CpM index, which evaluates the potential capability of the
process, very similar to the Cp index of the univariate study, the index PV which compares the location of the process mean
vector with the target vector of the process and the index LI which assesses whether or not the modified region of the process is contained in the region defined by the technical specification. In the case of characteristics with unilateral and bilateral technical specification, refers developments by Jalili et al. (2012).
3.2. Restricted Data
Similar to what happens for the univariate study, there are multivariate statistical control techniques suitable for situations where there is insufficient data for the convenient estimation of the mean vector and the covariance matrix of the process. Thus, on the basis of developments in Quesenberry (1997), can be built the MQ(X) or
MQ X
chart.In case the data collected are individual observations, the statistic that is represented in the chart MQ(X) is given by the following equation:
1
12
3
r r p ,r p rQ
X
F
A
, r
p
, p
,
(14) where,
Abreu, A., Requeijo, J. G. & Calado J. (2018).
Implementation of statistical process control in a bottling line in winery industry. Millenium, 2(7), 23-37.
DOI: https://doi.org/10.29352/mill0207.02.00180
m
7
33
1 1 1 11
1
2
-r r r r r - rr
r
p
A
rp r
X
X
S X
X
(15)
In the situation where the data collected are samples, the chart should be
MQ X
, where the statistic to be represented in the chart is given by the following equation:
1
12 3
r r r p ,N r p rQ
X
F
A
, r
, ,
(16) where,
1 1 1 11
r r r -r r r r r pool,r r rn N
N
r
p
A
N p N
r
X
X
S
X
X
(17) r rN
n
1n
(18)
1 1 11
1
1
1
1
1
1
r pool,r i i r pool,r r r i r rn
N
r
n
N
N
S
S
S
S
(19)0
S
pool,0
(20)The control limits and the center line, for this type of charts, are given by:
3 3 0 and 0 3 3 MQ X MQ X MQ X MQ X MQ X MQ X UCL UCL CL CL LCL LCL (21)
4. CASE STUDY
The case study was carried out in a unit of a leading wine company in the Portuguese market. The company has implemented a quality management system in accordance with the requirements of ISO 9001.
The case study comprised the implementation of the SPC for various products (wine brands) in the process of bottling wine which is considered a critical step since some care is needed, such as avoiding the occurrence of microbiological contaminations or oxidation of the wine.
In general, the bottling lines are divided into cells, there being operators responsible for each of these cells, which in turn may consist of more than one set of machines.
Based on the methodology proposed in Figure 1, it is possible to identify the statistical techniques to apply when there is sufficient data for the convenient estimation of the process parameters (mean and variance) as well as when the data is restricted and as such estimation cannot be performed conveniently.
For the case study presented, two quality characteristics (Filling Volume and Torque applied in the capsule) of a product of the premium range designated "CA" with a very restricted number of units produced were selected, reason why, according to the methodology presented in Figure 1, statistical techniques were applied for this situation, i.e., the Q charts (univariate study) and the MQ charts (multivariate study).
This study was based on the collection of samples with dimension 5 of a wine product that has low production volumes. The key quality characteristics analysed were the filling volume and the torque required to break the sealing capsule.
To this product were collected 15 samples of each of the characteristics under consideration. In this paper an example is presented where the univariate and multivariate analysis was carried out, through the application of the charts.
The procedure used to collect the data concerned with the control of volume consisted of weighing 5 properly identified empty bottles which, after passing through the filling line, are collected and reweighed in order to calculate the net mass value and consequently the volume of filling. In relation to the torque value, adequate equipment was used to measure the torque. The sampling frequency is hourly, and the measuring equipment used is calibrated.
The "filling volume" quality characteristic is measured in "l" (liter) and the limits of the technical specification is equal to 0,750 ± 0,10; the "torque" quality characteristic is measured in "in.lbs" and its technical specification is equal to 15 ± 7.
Abreu, A., Requeijo, J. G. & Calado J. (2018). Implementation of statistical process control in a bottling line in winery industry. Millenium, 2(7), 23-37.
DOI: https://doi.org/10.29352/mill0207.02.00180
m
34
7
4.1. Univariate Analysis
This section includes the SPC study considering an univariate approach based on the problem mentioned above, where two characteristics are analysed.
4.1.1. Filling Volume
In order to control the mean process, 15 samples of size n = 5 were collected for the filling volume of the product "CA" and the
Q X
chart was constructed, as well as theQ S
2 chart, which are respectively depicted in Figure 2 and Figure 3.The statistics
Q X
andQ S
2 were determined respectively by equations 8 and 10, based on the means and variances of the 15 samples collected from the production referring to the quality characteristic of "filling volume".The capacity indexes QL and QU, represented in the chart
Q X
of Figure 2 are determined using the equations in Table 4.Regarding the
Q X
chart no special causes of variation were detected, but sample 15 is a point that should merit some attention as it is quite close to the lower control limit. In terms of capability, the process has capability, but is not centred since the indexes QL e QU are not approximately equal in magnitude. InQ S
2 chart no special causes of variation were detectedeither, only in the sample 13 an increase in the dispersion of the process occurred, a situation related to a problem in the regulation of the level of filling.
Figure 2.
Q X
Chart to monitor the filling volume’s mean of the product “CA”Figure 3.
Q S
2 Chart to monitor the dispersion of the filling volume of product “CA”4.1.2. Torque Applied in the Capsule
The other characteristic analysed was the torque in the sealing capsule, where 15 samples of size 5 were also collected. Figure 4 and Figure 5 depict, respectively, the
Q X
chart and theQ S
2 chart corresponding to this characteristic.The statistics
Q X
andQ S
2 were determined respectively by equations 8 and 10, based on the means and the variances of the 15 samples collected from the production referring to the quality characteristic "torque".The capacity indexes QL and QU, represented in the chart
Q X
of Figure 4 are determined using the equations in Table 4.-7 -6 -5 -4 -3 -2 -1 0 1 2 3 4 5 6 1 2 3 4 5 6 7 8 9 10 11 12 13 14 15 Q (X) Sample Q (X) Chart Q LCL CL UCL QL Qu -4 -3 -2 -1 0 1 2 3 4 1 2 3 4 5 6 7 8 9 10 11 12 13 14 15 Q (S2) Sample Q (S2) Chart Q LCL CL UCL
Abreu, A., Requeijo, J. G. & Calado J. (2018).
Implementation of statistical process control in a bottling line in winery industry. Millenium, 2(7), 23-37.
DOI: https://doi.org/10.29352/mill0207.02.00180
m
7
35
Figure 4.
Q X
Chart to monitor the torque’s mean for product “CA”Figure 5.
Q S
2 Chart to monitor the dispersion of the torque on the closing capsule of product “CA”In
Q X
chart of this characteristic it is possible to observe the presence of a special cause of variation associated to a non-random pattern (sample 7 to sample 11), which according to ISO 7870-2: 2013 corresponds to rule 6 (four of five consecutive points in the zone B or A or beyond this zone on the same side of the centre line). As such, this sample was duly analysed in order to ascertain the root cause of the problem in the productive process and corrective actions were implemented. In addition to sample 11, there are no more special causes, however sample 13 should merit some attention since the value of the statistic is very close to the lower control limit. In terms of capability, the process is capable but not centred for the same reason already observed for the characteristic filling volume.Regarding
Q S
2 chart no special causes of variation were found, however, sample 4 is a point that should merit some attention as it is very close to the lower control limit.4.2. Multivariate Analysis
When more than one quality feature is controlled simultaneously using the same samples, it is possible to perform the univariate study for each of the quality characteristics, although the multivariate study has advantages. These advantages are revealed on the one hand by the smaller number of documents analysed (increased with the increase in the number of characteristics under study) but mainly for the possibility of controlling not only the values of the characteristics under study but also the correlation between them. The multivariate charts detect special causes of variation when the correlation between the variables is drastically altered, besides obviously a significant change in the value of the characteristic (s) under study. A common example in which the application of multivariate charts is clearly advantageous is the simultaneous control of the thickness and weight of a given piece; in this case the correlation between the weight and the thickness of the piece is positive; if the thickness increases the weight is expected to increase; if this does not happen and this situation is not detected using an univariate chart of weight and thickness, it is probable that the multivariate chart detects this situation due to the change in the correlation between the two quality characteristics that will leave at that moment of being positive and started to be negative. Thus, we chose to perform the multivariate study and compare it with the univariate study presented in section 5.1.
-5 -4 -3 -2 -1 0 1 2 3 4 5 1 2 3 4 5 6 7 8 9 10 11 12 13 14 15 Q (X) Sample Q (X) Chart Q LCL CL UCL QL Qu -4 -3 -2 -1 0 1 2 3 4 1 2 3 4 5 6 7 8 9 10 11 12 13 14 15 Q (S2) Sample Q (S2) Chart Q LCL CL UCL UCL LCL CL
Abreu, A., Requeijo, J. G. & Calado J. (2018). Implementation of statistical process control in a bottling line in winery industry. Millenium, 2(7), 23-37.
DOI: https://doi.org/10.29352/mill0207.02.00180
m
36
7
Then, after the univariate study was done, a multivariate study was carried out through the construction of the
MQ X
chart, which is shown in Figure 6.The statistics
MQ X
was determined by the equation 16, based on the mean vectors and covariance matrices of the 15 samples collected from the production concerned with the quality characteristics "filling volume" and "torque".Figura 6. Multivariate
MQ X
chart for control of the mean vector of the characteristics of the filling volume and product torque "CA".Through the analysis of the
MQ X
chart it is possible to verify a special cause of variation (sample 5 to sample 8) referring to a non-random pattern (rule 6). This same non-random pattern was also detected in theQ X
chart for the torque characteristic.The multivariate
MQ X
chart reveals a greater sensitivity than the chartQ X
since this special cause is detected in sample 8 unlike the univariate chart where it was only detected in sample 11.Another sample that stands out, although not being a special cause of variation, is sample 13 (value of the statistic very close to the control limit) that reflects the situation verified in the univariate chart of the torque.
CONCLUSIONS
The purpose of this study was the implementation of Statistical Process Control techniques in a wine industry in order to improve its final product. For this study, two quality characteristics, the filling volume and the torque required to open the seal cap, were considered.
However, as the case study was applied to products with low production volumes, since bottling is done in small batches, the use of traditional techniques becomes impractical due to the reduced number of data available for parameter estimation which would lead to erroneous conclusions.
Considering, the methodology proposed with the use of the control Q charts (univariate analysis) and the control MQ charts (multivariate analysis) proves to be the most appropriate choice not only for the control of one or more products but also for several sets of quality characteristics.
Furthermore, the methodology followed has several advantages over traditional approaches, as follows:
1) The Q charts enable the statistical control of all quality products/characteristics in the same chart, even when there is insufficient data to adequately estimate process parameters (mean and variance);
2) The MQ charts allow the simultaneous statistical control of several quality characteristics of several products in the same chart, even when there are not sufficient data to estimate the process parameters (process mean vector and process covariance matrix);
3) Allows to study together different characteristics; 4) Drastically reduces the time for analysis;
5) The introduction in the univariate study (
Q X
orQ X
charts) the capability indexes QL and QU, allows themonitoring of the process capability, proving to be an important added value;
6) The use of capability indexes QL and QU, which allow studying the process capability in real time, has reduced the
probability of producing nonconforming units, i.e., product that does not meet the technical specification.
One of the major drawbacks of Q control charts is the difficulty in analysing the existence of non-random patterns, increasing the complexity of this analysis with the number of products/characteristics to control.
Another disadvantage of Q and MQ charts, in particular the latter, is the poor sensitivity in detecting special causes of variation, specifically at the beginning of the study. Although the lack of sensitivity in detecting non-random patterns is a limitation of the
-4 -3 -2 -1 0 1 2 3 4 1 2 3 4 5 6 7 8 9 10 11 12 13 14 15 MQ (X) Sample MQ (X) Chart MQ LCL CL UCL UCL LCL CL
Abreu, A., Requeijo, J. G. & Calado J. (2018).
Implementation of statistical process control in a bottling line in winery industry. Millenium, 2(7), 23-37.
DOI: https://doi.org/10.29352/mill0207.02.00180
m
7
37
Q and MQ charts, its use nevertheless proves to be of great importance and utility, since traditional univariate and multivariate
approaches are not amenable of implementation when there is a restricted number of data. One way to increase the sensitivity of these cards is based on the use of charts with memory, such as the Cumulative Sums charts (CUSUMQ and MCUSUMQ) and charts of Exponentially Weighted Moving Average (EWMAQ and MEWMAQ), as referred in Pereira and Requeijo (2012).
REFERENCES
Jalili, M. Bashiri, M. & Amiri, A. (2012). A new multivariate process capability index under both unilateral and bilateral quality characteristics. Quality and Reliability Engineering International, 28, (8), 925–941. https://doi.org/10.1002/qre.1284 Montgomery, D. C. (2012). Introduction to Statistical Quality Control. 7th Edition. New York: John Wiley & Sons.
Pereira, Z. L. and Requeijo, J. G. (2012). Quality: Statistical Process Control and Planning. 2th Edition. Lisbon: Fundation of FCT/UNL. Pignatiello, J. J. & Runger, G. C. (1990). Comparisons of Multivariate CUSUM Charts. Journal of Quality Technology, 22, 173–186.
https://doi.org/10.1080/00224065.1990.11979237
Pyzdek, T. (1999). Quality Engineering Handbook. New York: Marcel Dekker.
Quesenberry, C. P. (1997). SPC Methodos for Quality Improvement. New York: John Wiley & Sons. Qiu, P. (2014). Introduction to Statistical Process Control. Boca Raton: CRC Press.
Ryan, T. P. (2000). Statistical Methods for Quality Improvement. 2nd Edition. New York: John Wiley & Sons.
Shewhart, W. A. (1931). Economic Control of Quality of Manufactured Product. New York: D. Van Nostrand Company.
Wang, H., Huwang, L. and Hung, J. (2015). Multivariate control charts based on the James – Stein estimator. European Journal of Operational Research, 246, (1), 119–127. https://doi.org/10.1016/j.ejor.2015.02.046