Environmental Modelling and Software 124 (2020) 104585
Available online 6 November 2019
1364-8152/© 2019 The Authors. Published by Elsevier Ltd. This is an open access article under the CC BY license (http://creativecommons.org/licenses/by/4.0/).
OPENCoastS: An open-access service for the automatic generation of
coastal forecast systems
A. Oliveira
a,*, A.B. Fortunato
a, J. Rogeiro
a, J. Teixeira
b, A. Azevedo
a, L. Lavaud
c, X. Bertin
c,
J. Gomes
d, M. David
d, J. Pina
d, M. Rodrigues
a, P. Lopes
aaNational Laboratory for Civil Engineering, Av. do Brasil, 101, 1700-066, Lisbon, Portugal
bPortuguese Institute for Sea and Atmosphere (IPMA), Rua C do Aeroporto, 1749-077, Lisboa, Portugal cUMR LIENSs 7266, La Rochelle Universit�e, CNRS, 2 Rue Olympe Gouges, F-17000, La Rochelle, France dLaborat�orio de Instrumentaç~ao & Física Experimental de Partículas, LIP, Lisbon, Portugal
A R T I C L E I N F O Keywords: SCHISM Forecast systems Unstructured grids Web platform EOSC A B S T R A C T
Coastal forecast systems are used for many purposes, including harbor management, search and rescue opera-tions, and response to extreme events. However, the generation and operation of these systems is time- consuming, requires expertise in both information technologies and modeling of coastal processes, and needs dedicated computational power. The new service OPENCoastS overcomes these difficulties by generating on- demand coastal circulation forecast systems through a web platform with minimal user intervention. Using a web platform, the user is guided through seven simple steps to generate an operational forecast system for any coastal region. The only requirements are an unstructured grid of the study area and information on river flow, if applicable. The platform provides ocean and atmospheric forcings and data for model validation, and includes interfaces for results visualization and forecasts management. Forecasts are generated with the community model SCHISM, and computing resources are provided through the European Open Science Cloud.
Software availability
Program title: OPENCoastS
Developers: Jo~ao Rogeiro, Joana Teixeira Contact address: [email protected]
Software Access: https://opencoasts.ncg.ingrid.pt/
Year first available: 2018
Software required: Browser: Firefox, Google Chrome Program language: Python & HTMLþCSSþJavaScript
Availability and cost: Open access upon registration (email required)
1. Introduction
In the late 20th and early 21st centuries, the oceanographic com-munity started developing forecast systems to provide short-term pre-dictions of ocean and coastal hydrodynamics (e.g., Clancy and Sadler, 1992; Brassington et al., 2007; Baptista et al., 2008; Mehra and Rivin, 2010). These forecast systems use hydrodynamic models forced by at-mospheric model results to provide, among other variables, sea surface elevations, currents and wave spectra a few days in advance. More
recently, forecast systems were extended to oil spills (e.g., Sotillo et al., 2008; Oliveira et al., 2014; Abascal et al., 2017) and biochemical models (e.g., Triantafyllou et al., 2007; Marta-Almeida et al., 2012). Initially fuelled by military needs, these forecast systems now have a variety of uses, such as search and rescue operations (Breivik and Allen, 2008), warning of extreme events (Fortunato et al., 2017a; Ferrarin et al., 2019) and bathing water quality (Viegas et al., 2009; Bedri et al., 2014; Oli-veira et al., 2015). As the quality of the predictions increases, due to more accurate atmospheric forecasts, data assimilation, improved models and higher computational power, ocean forecast systems are increasingly being adopted by a variety of end-users, such as coastal managers, harbor authorities, civil protection agencies, and the surfing and sailing communities.
Presently, the development and operation of ocean forecast systems require significant resources: large teams with expertise in both nu-merical modeling of ocean processes and information technologies, and powerful computational resources, such as computer clusters. Also, the daily maintenance of these systems can be very time-consuming, since they can crash for a variety of reasons (numerical instabilities of the model, network communication problems, power shortages, hardware failures, lack of forcing conditions due to crashes in forcing forecast
* Corresponding author.
E-mail address: [email protected] (A. Oliveira).
Contents lists available at ScienceDirect
Environmental Modelling and Software
journal homepage: http://www.elsevier.com/locate/envsoft
https://doi.org/10.1016/j.envsoft.2019.104585
Environmental Modelling and Software 124 (2020) 104585
systems, etc.). As a result, the development and operation of forecast systems have mostly been limited to large research groups from uni-versities and research centers. In some countries, operational organi-zations (such as NOAA in the USA) provide predictions freely for their national coasts. However, most countries lack the availability of coastal predictions for coastal management tasks, coastal-centered economic activities or even recreation opportunities for the population, in particular at the required spatial resolution. Clearly, many organizations could benefit from these forecast systems but do not have the resources required to develop and maintain them.
There is, therefore, a clear need to develop a service that can empower potential users to develop and maintain their own forecast systems with little effort and cost. By significantly reducing the cost and time required to develop coastal forecast systems, as similar software-as- a-service technological platforms (Swain et al., 2016; Golding et al., 2019) have achieved, an on-demand service available through a Web platform is expected to promote a drastic increase in the number of existing forecast systems and their uptake by various end-users and the society in general. Web portals have been recognized as an excellent solution for sharing and managing spatial data (Jiang et al., 2019, Saah et al., 2019).
The OPENCoastS service aims at filling this need, supported by Eu-ropean Open Science Cloud (EOSC) resources. This service assembles on- demand circulation forecast systems for user-defined coastal areas and keeps them running operationally. It generates daily forecasts of water levels and depth-averaged velocities over the region of interest for 48 h, based on numerical simulations of all relevant physical processes. Forcing conditions at the boundaries and over the domain are defined by the user from global and regional forecast databases. Automatic com-parison with real-time in-situ sensor data can be provided for a number of user-specified locations, taking advantage of the European Marine Observation and Data Network (EMODnet, http://www.emodnet. eu/what-emodnet). The present paper describes OPENCoastS and il-lustrates its application at estuarine and shelf scales. This service is in operation in the Portuguese and Spanish infrastructures for Distributing Computing, in the framework of the European Open Science Cloud (EOSC) initiative.
Cloud resources are increasingly popular in environmental modeling, due to their flexibility to provide resources on request and to the simplicity of their use (Chandrasekar et al., 2012; Gentzsch, 2014;
Gomes et al., 2018). Issues related to model performance remain a concern for environmental applications, given the need for infrastruc-ture abstraction and multi-tenancy occupation (O’Donncha et al., 2016). In spite of these challenges, cloud resources are the backbone of several complex modeling and data-based applications, providing computa-tional power to many application fields (e.g. Glenis et al., 2013; Qiao et al., 2019; Phuong et al., 2019). In the context of environmental forecasting, additional concerns for the use of cloud computing include communication between nodes for parallel computations (O’Donncha et al., 2016), security of data and quality of service, in particular to guarantee the delivery time of the forecasts (Rogeiro et al., 2018). In the field of coastal hydrodynamic and water quality modelling, a compari-son of model performance indicators for an operational forecast simu-lation executed in local workstations, a HPC cluster and a pilot cloud revealed the good performance of cloud computing resources (Rogeiro et al., 2018). Because the size of the computational jobs is unknown a
priori, OPENCoastS poses new challenges to cloud computing resource
allocation, thus calling for simple and robust solutions to deliver pre-dictions efficiently and on time.
This paper is organized as follows. Section 2 provides an overview of OPENCoastS. This service is then described in detail in sections 3
(Frontend) and 4 (Backend). Section 5 presents the implementation of OPENCoastS in the European Open Science Cloud (EOSC). The appli-cation of the service and its platform is then illustrated in Section 6. Finally, Section 7 provides an overview of the experience gained in the development of OPENCoastS and its worldwide application and
discusses its evolution in the near future.
2. Concept and general description
2.1. OPENCoastS requirements and main properties
A forecast system is typically based on a local implementation of the model of choice, duly validated and calibrated for local conditions. Forcings for this forecast are based on available providers of local boundary conditions and the user interface is built to address the tar-geted end-users’ requirements. This approach provides tailored results but lacks the generic methodology and high flexibility behind a service. Initial deployments of the Water Information Forecast Framework (WIFF) are examples of this legacy approach (e.g Oliveira et al., 2015;
Fortunato et al., 2017a). More sophisticated approaches provide higher flexibility to the users (Werner et al., 2013), by making several models available and allowing for some customization according to user’s needs. However, all these approaches are based on a local imple-mentation concept and do not automatically provide the capacity to build forecasts on demand over a web interface, nor the integrated connection to the necessary computational resources. As a result, building and maintaining these systems in operation require consider-able human resources and a continuous demand for supporting computational resources. The coastal forecast service paradigm, pro-posed herein through the OPENCoastS service, provides fully flexible deployment customization, from the user to the backend perspective.
Forecast services are generic platforms that can be applied by users of any discipline to produce customized applications to specific sites. They are often used in the atmospheric sciences domain, taking advantage of the availability of global forecast system results (Kim et al., 2018; Golding et al., 2019). Unlike forecast systems, coastal forecast services are site-independent, applicable to any site through custom-ization of its platform, hide the complexity of computational resources allocation from users and optimize resource usage depending on the characteristics of the application site. OPENCoastS goes one step further from existing forecast systems and provides a Forecast-as-a-Service so-lution (similarly to Software-as-a-Service – SaaS), where users are empowered to build their own forecast systems on-demand. This plat-form is therefore a forecast-building service, supported by a site-independent model and computational infrastructure, that can be used to generate site-specific forecast systems on demand by the users. Based on the outcomes of similar services for other domains (Swain et al., 2016; Golding et al., 2019), coastal forecast services should thus allow for smooth implementations to distinct domains, choices of pa-rameters and forcings, and on-the-fly output production and visualiza-tion (Saah et al., 2019), from a user perspective. For forecast administration roles, services provide simple adaptation to different models and model versions and expedite interoperability among distinct computational resources providers. Moreover, all parts in the forecast engine are modular and can easily be used to address repetitive tasks in an efficient and quality-controlled fashion.
Building a framework to provide a forecast service of broad appli-cation in the coastal community requires the identifiappli-cation of the necessary requirements from both user and administration perspectives. The requirements analysis for the development of the OPENCoastS service identified several properties that need to be addressed. The list is provided below along with a short explanation on how these were addressed at the implementation stage.
1. Broadly available: the service should be available through a broad access platform, without requiring additional configuration or soft-ware installation. The OPENCoastS service is provided through a Web application, usable on multiple devices.
2. Simplicity and usability: the service should be accessible to all coastal community members and provide a straightforward experi-ence to them. OPENCoastS allows both inexperiexperi-enced and
experienced users to apply state-of-the-art models to develop fore-casts systems for their domain of interest while benefiting, in a transparent way, from the computational infrastructure provided through the H2020 EOSC-hub project. A single item is required to use the service: a computational grid of the domain of interest. 3. Comprehensive: the service should provide access to all forecast-
related tasks through a single platform, minimizing dependencies on external software for full uptake of the service. OPENCoastS was built as a one-stop-shop tool for users, providing forecast configu-ration, management, and output visualization facilities in a single platform. From an administration perspective, integrating the Django Web Framework within the platform allows taking advantage of its automatic administration interface that provides simple and straightforward management of users, all tasks on deployments and all their properties, as well as accounting and quality control tasks. 4. Accurate and reliable: forecast quality and persistence depend directly on the accuracy and robustness of the model being used for the predictions and on the quality of the deployment input condi-tions. OPENCoastS is based on SCHISM (Zhang et al., 2016), an open-source, unstructured-grid, high performance modeling suite supported by a strong international community.
5. Flexible: a service should provide some degree of freedom for users to select the conditions that are deemed more adequate for their system of interest. OPENCoastS allows for the selection of the domain of simulation (at the required spatial discretization), of the forcings (amongst broad-use options) and of some model configu-rations. Through this flexible approach, it is also adapted to users’ knowledge, by providing pre-defined selections for less experienced users.
6. Modular: forecast services need to be comprehensive in terms of processes and spatial coverage, for full support to all entities in the water cycle. The modularization of the development parts constitutes a core property to support growth and adaptation to the best avail-able components. OPENCoastS was built in a modular way, to pro-vide support to grow from the current two-dimensional (2DH) barotropic physics to all processes in the water cycle, including the urban dimension. Simultaneously, it was prepared to accommodate new models, forcing options and the ability to quickly replicate an existing deployment to allow for small changes in model parameters. The development of an unopinionated framework defining simple entities, with clear ways of interaction, and a well-planned data model are the ingredients to achieve this property.
7. Verifiable: forecast systems are based on modeling tools and their applications. Their validity should, therefore, be automatically checked against field data, preferably from multiple sources, to prevent misleading conclusions based on data errors. In OPEN-CoastS, the nearest data stations available at EMODnet are auto-matically proposed to the user, providing a systematic procedure to evaluate prediction quality against one of the major data providers. An operational forecast service with worldwide coverage such as OPENCoastS requires the availability of considerable, reliable and replicated computational resources to guarantee the delivery of the forecasts outputs to the users in due time. The simulations in the OPENCoastS service are performed with the model SCHISM, a model based on MPI that can take advantage of several connected nodes. Indeed, a comparison of model performance indicators for an opera-tional forecast simulation with SCHISM executed in local workstations, a HPC cluster and a pilot cloud revealed the good performance of SCHISM in cloud computing environments (Rogeiro et al., 2018). For resource size allocation, OPENCoastS defines several resource allocation classes, each with different amounts of computational resources. The classes are defined based on the available computational resources. Each of the operating deployment daily simulations’ is associated to one of the predefined resources size classes, depending on the horizontal grid size. This approach makes for an efficient and fair of use of resources, while
keeping the distribution of resources among the simulations fairly sim-ple and robust.
In the scope of the Portugal’s National Infrastructure for Distributing Computing (INCD) infrastructure roadmap project in Portugal and the H2020 EOSC-hub project in Europe, framed by the European Open Science Cloud initiative implementation, OPENCoastS simulation re-sources are provided at the INCD and IFCA (Instituto de Física de Can-tabria, Spain) facilities in a transparent way to the user. Generic access to other computing centers is being planned through the integration of the core EOSC-hub services for authentication, accounting, computa-tion, and data preservation.
2.2. The overall architecture and components
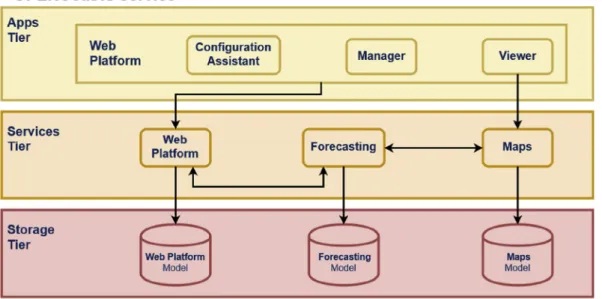
The OPENCoastS service architecture (Fig. 1) includes 1) the “Apps Tier”, a frontend that comprises the user interaction components for forecast systems configuration, management and visualization, via a web application; 2) the “Services Tier”, a backend, where models and mapping services run, and 3) the “Storage Tier” for preservation.
The services and storage tiers are briefly presented below.
2.2.1. Web platform
This component provides access to the service, through web pages hosting the configuration wizard, the forecast manager, and the viewer applications (apps). Each of these apps allows users to interact with the different facilities of the service. The Django Web Framework is used as the development framework of this component, which follows Django’s design philosophy of having a project composed of applications, each with a set of concerns and functionalities.
2.2.2. Forecasting
While the web application allows the users to interact with the OPENCoastS service and manage their operational real-time forecast systems, the forecasting component is responsible for producing the forecast results for each deployment. Since it is a central part of OPENCoastS, it interacts with all other components, directly or indi-rectly, to be able to gather all the necessary information to run each deployment simulation and make the forecast results available through the web.
The OPENCoastS service is based on WIFF (Water Information Forecast Framework, Fortunato et al., 2017a), a framework that includes the building blocks required to assemble custom forecast systems easily. These blocks cover different aspects of a forecast system. The top block – Forecast – includes a Simulation block, which in turn is comprised by Steps (detailed descriptions of each entity can be found in Section 4.2). A Step encapsulates self-contained tasks, allowing them to be (re)used in different Simulations. The definition of a Simulation includes the list of Steps, to be executed following a specific order. The modularity requirement is fulfilled by having the possibility of reusing any of the steps within different Simulations. For instance, changing from SCHISM to a different circulation model in OPENCoastS would only require replacing the Step wrapping the model execution by a new one for the new model, assuming both models are compatible (e.g. use the same inputs and configurations).
2.2.3. Mapping
The mapping services complement the web application ones, by providing Web Map Services (WMS) which are then used by the viewer component of the web application. The forecasting models output files are NetCDF files composed of unstructured mesh data and, considering most commonly used Web Map Servers (such as GeoServer and Map-Server) are limited to serving vector and structured grid data, ncWMS2 software (Blower et al., 2013) is used to serve unstructured grids on the web.
Environmental Modelling and Software 124 (2020) 104585
2.2.4. Storage
The storage component keeps the state of all services and is a requirement for all of them. The storage technologies range from typical relational databases servers to lower-level shared file systems. The relational database software used is the PostgreSQL plus the PostGIS extension, storing most structured information about the service. The storage service, currently provided by Nextcloud, makes input and output files available to the other OPENCoastS components. Shared file systems, in this case NFS, are used to share folders and files among the computation and mapping host resources.
The following sections present in detail the two main components of the OPENCoastS platform.
3. Frontend
The OPENCoastS web application (https://opencoasts.ncg.ingrid.pt) has three main components: the “configuration assistant” guides users through several steps to assemble circulation forecast systems for coastal areas of their choice; the “forecast systems manager” provides infor-mation about the user’s systems status and tools to edit them; and the “outputs viewer” provides access to the model’s output files and tools to view the results in a web map and to compare them with pre-selected observation stations data in the form of charts. Along with these main components, the web application includes a User Profile page and a rating feature that enables users to provide feedback on their experience and, therefore, contribute to improving the service.
The OPENCoastS web application life cycle includes the develop-ment of new functionalities in the near future. This section describes the main components listed above in the currently available version.
3.1. The configuration assistant
This component guides the user, over the seven steps described below, through the creation of a new forecast system at the user’s region of interest. The only mandatory requirement from the user is a 2D triangular computational grid, which includes the bathymetry, as an input file. Other inputs, such as a spatially variable friction coefficient, can also be provided by the user but are not mandatory.
In step 1 (Model) the user selects the model version to use in the forecasts and the forecast period. The current version of the OPENCoastS service offers a single model and period: the SCHISM-v5.4.0 model with a 48 h forecast period.
In step 2 (Domain) the user uploads a triangular 2D unstructured
grid, indicating its coordinate reference system from a provided list or by entering an EPSG code, and the vertical datum. If the uploaded file is successfully validated, the user can preview the grid’s boundaries and bathymetry on a map for visual inspection (Fig. 2).
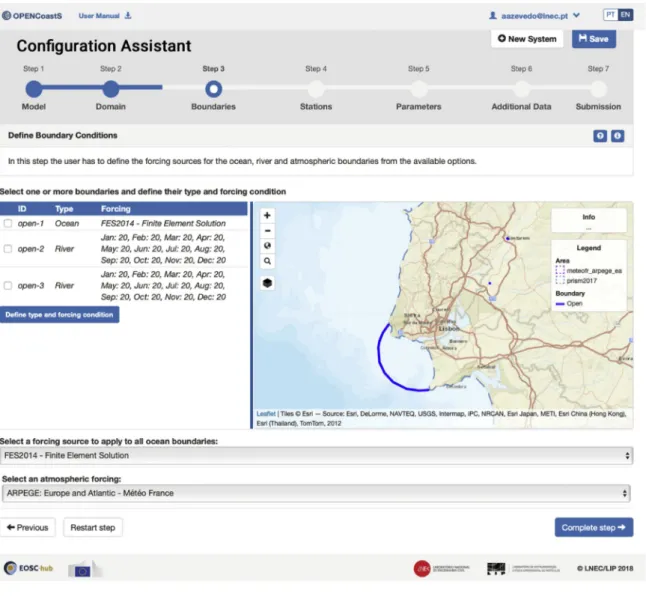
The third step (Boundaries) allows users to specify the type of each open boundary (ocean or river) and the forcing to be used at each of them. For ocean boundaries the current version of the service includes the following forcings:
● PRISM2017 – Portuguese Regional Tide-Surge Model Forecasts 2017 (Fortunato et al., 2016, 2017a), developed to forecast water levels along the Portuguese coast. PRISM2017 simulates tides and storm surges in NE Atlantic using the SCHISM model in 2DH barotropic mode. The model is forced by the global tidal model FES2012, tidal potential, atmospheric pressure and winds from the atmospheric model GFS. The resolution of the grid along the Portuguese coast is about 250 m.
● FES2014 – Finite Element Solution (2014 version, https://www.avis
o.altimetry.fr/en/data/products/auxiliary-products/global-tide-fes/ description-fes2014.html, Carrere et al., 2016), the latest version of the FES tide model developed in 2014–2016. Relative to its prede-cessor FES2012, this version takes advantage of longer altimeter time series and better altimeter standards, improved modeling and data assimilation techniques, a more accurate ocean bathymetry and a refined mesh in most shallow water regions.
For river boundaries, the current version of the service requires the user to provide one average annual flow value or 12 monthly-average flow values.
In addition to the open boundary forcings, the user can also specify an atmospheric forcing in this step (Fig. 3). Two choices are available. ● GFS – Global Forecast System NOAA/NCEP (https://www.ncdc.noaa
.gov/data-access) is a weather forecast model produced by the Na-tional Centers for Environmental Prediction (NCEP) that covers the entire globe at a base horizontal resolution of 0.25�and a time step of
1 h.
● ARPEGE – Europe and Atlantic – M�et�eo France (https://donneespu
bliques.meteofrance.fr/?fond¼produit&id_produit¼130&id_ru brique¼51, Courtier et al., 1991) is a regional atmospheric forecast model provided by M�et�eo France that covers the European continent and seas (longitudes: 32� to 32�; latitudes 32� to 60�) at a base
horizontal resolution of 0.1�and a time step of 1 h. Fig. 1. Architecture of the OPENCoastS service.
Step 4 (Stations) allows users to define locations within the simula-tion grid where to extract model time series with the output model resolution (virtual stations). It also allows to compare them with observation time series provided by the EMODnet web platform (com-parison stations). The observation stations located inside the simulation grid are automatically suggested to the user as comparison stations.
Step 5 (Parameters) generates the file containing the physical and numerical parameters (Fig. 4). The user can choose between a pre-configured parameter file, proposed by the application, or can manually customize some of the parameters. In this version, only a few parameters can be edited, such as the time step or the initial ramp-up period.
Along with the simulation grid and the parameter file, SCHISM re-quires additional data that must be defined in step 6 (Additional Data). In the current version of OPENCoastS, only the Manning coefficient can be specified by the user. This coefficient is used by SCHISM in 2DH mode to determine bottom friction based on local characteristics. The user can either specify a constant value or upload a file with the spatial variation of this parameter.
The seventh and final step (Submission) allows the user to submit the request. At this point, the configuration assistant presents a summary of all the previous steps allowing the user to review previous choices. The user can then submit the configuration or save it for future submission. Submitting the configuration will create and activate a new forecast system and launch a new deployment in the backend component of the OPENCoastS platform.
Presently, simulations are running on the INCD and expire after a month of operation, thus promoting the rational use of INCD resources. Integration with IFCA resources is underway. The first model results are normally available within 24 h.
After submitting a new deployment, the application redirects the user to the “Forecast Systems” page, described below.
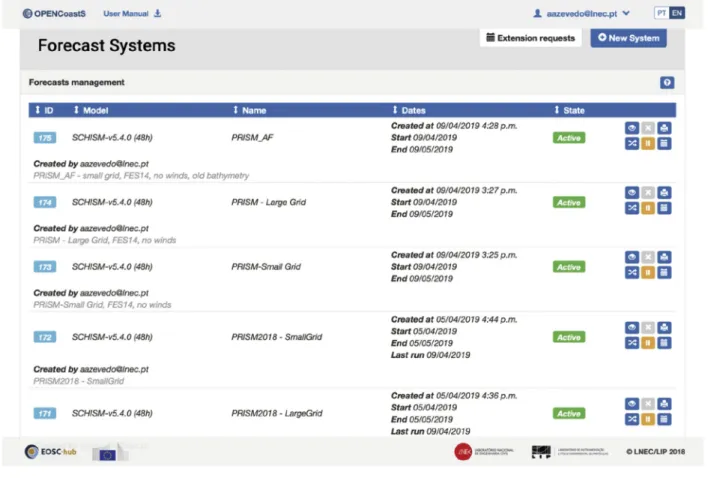
3.2. The forecast systems manager
The forecast systems manager (Fig. 5) enables users to monitor and manage their forecast systems.
This component of the web application allows users to consult basic information from the systems, such as the model and version used, the deployment name and description, the reference dates (creation, start, end and last run dates) and the system’s state, which can be one of the following: at Step ‘n’, Configured, Active, Expired or Disabled.
When a system’s configuration is submitted, the service changes its status to ‘Active’, indicating that the deployment is set up to run at the backend. If errors occur during a deployment’s simulation run an ‘Error’ label is added to the system’s state. In such cases, the user can access the deployment log files to analyze and deduce probable causes of error. Also, when an active system approaches its expiration date, an ‘Expiring’ label is added to the system’s state and, depending on the number of days left, users can request an extension of the deployment. After a system reaches its expiration date, the service updates its state to ‘Expired’ and the deployment at the backend will stop running the model and producing results.
At any time, users can pause an active system, changing the state to ‘Disabled’ and temporarily stopping the deployment. This feature allows users to manage which systems are up and running, a useful feature, considering that the OPENCoastS service restricts each user to a limited number of active systems. Users can re-activate them at any time. The possibility of launching several simultaneous deployments for the same coastal system can be used for model calibration and sensitivity analyses in general.
The forecast systems manager also includes tools to open a system in the configuration assistant (if not submitted yet or still under configu-ration); delete systems; preview systems configuration summary or print
Environmental Modelling and Software 124 (2020) 104585
them as a report; and clone systems. This last operation creates a new system based on another, allowing users to change its configuration and re-submit it under new conditions.
3.3. The outputs viewer
The outputs viewer component (Fig. 6) provides an interface to visualize and access the forecast results and log files. This interface al-lows the user to extract and download time series at user-defined loca-tions using standard formats, download specified model outputs in standard formats, visualize model outputs of water levels and velocity, and access automatic data/model comparisons at selected data stations. The main goal designing this interface was to allow flexibility in the presentation of results. Users can preview a system’s model outputs on a map and on charts (stations time series) and combine them with the outputs of other systems.
The interface is divided into three main panels: the ‘Systems’, ‘Map’ and ‘Charts’ panels.
The ‘Systems’ panel lists all of the user’s active systems as sub-panels that contain the tools to preview and access their outputs. In more detail, the ‘System’ panel contains three tabs: the ‘Maps’ tab lists map outputs that can be added to the map as layers, the ‘Stations’ tab shows the stations defined during the system’s configuration stage that can be added to the charts, and the ‘Files’ tab lists the daily model output files available for download.
The ‘Map’ panel renders model outputs as layers on the map from WMS services created by the mapping component of the OPENCoastS platform. The map displays a toolbar that contains a set of common tools (e.g. zoom in, zoom out, toggle basemaps) and customized tools (e.g. add location bookmarks tool and a probing station tool), along with the ability to view the layer color scheme, toggle the layer opacity and drag and drop layers to change their order on the map (from a ‘Legend’ panel). The model output WMS are served by ncWMS software that supports ‘Time’ dimension. Therefore, the ‘Map’ panel contains an additional toolbar that allows users to slide the map layer steps in time and a play/pause button to view them in an animated fashion.
The ‘Charts’ panel presents the model time series at stations added from the system’s ‘Stations’ tab or added on the fly, using the probing tool from the ‘Map’ panel. For comparison stations, defined at the configuration stage, the interface also tries to load observation time series from the EMODnet platform. If data are available for the same time period, they are added to the charts for model validation.
Finally, the ‘Map’ and ‘Charts’ panels are synchronized, so as users change the time reference on one panel the other one is automatically updated.
In the future, developments the OPENCoastS service will allow users to share their systems with other users giving them permission to consult them.
Fig. 3. OPENCoastS0configuration assistant at step 3 – boundaries.
4. Backend
The OPENCoastS backend, i.e., the forecasting engine, constitutes the core operational component of this service. It is built in modules to promote interoperability and reuse for other applications, in particular to support forecasting of different water dynamics or the use of alter-native simulation models. The next sections present the forecasting en-gine, its supporting framework WIFF and its application within the service OPENCoastS.
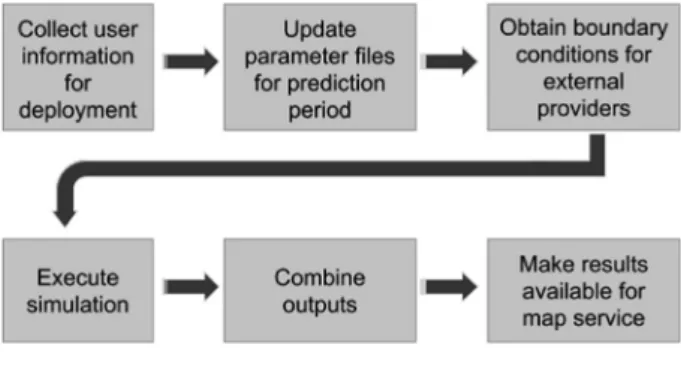
4.1. Forecasting engine
This component generates the forecast results by handling all aspects of the simulation chain established for each forecast (Fig. 7). This chain is updated daily by producing predictions from new model simulations, covering future time intervals, starting from the conditions of the pre-vious day (hot-start). From an information perspective, each simulation run has two types of requirements: the permanent ones are supplied by the user during the setup and remain unchanged throughout the lifetime of the forecast; and the transient requirements, which correspond to boundary forcings, are updated daily for each simulation of a particular system forecast.
A model simulation begins by gathering the information supplied by the user and using it as the foundation for the remaining procedure.
Then, the forcings are retrieved, covering the whole daily prediction interval, for all boundaries. Afterward, parameter files are updated for the daily conditions. After completing all the previous steps, everything is in place to start the simulation execution, which may potentially be a very time-consuming operation. This execution is performed by taking advantage of the parallel computing option in the model SCHISM. Since the previous step produces output results at each subdomain resulting from the parallel model execution, the output files for each variable must be combined into a single file before making these results available in the map server. All the steps described previously are encapsulated within the WIFF, developed specifically to make the creation of forecast deployments as systematic and generic as possible. WIFF was developed to address the limitations of custom-made similar-purposed forecast systems, taking advantage of the experience gathered over the past decade of creating and operating forecast systems at LNEC for estuary to ocean domains (Fortunato et al., 2017a). WIFF is described below.
4.2. The Water Information Forecast Framework (WIFF)
WIFF is a Python-based forecasting framework whose main purpose is to facilitate the creation of forecast systems, encouraging reusability and pluggability. To accomplish that, simple core entities were defined, with clearly defined relationships and interactions, emphasizing the separation of tasks and scope for each of them. This approach facilitates
Environmental Modelling and Software 124 (2020) 104585
the development of complex systems by separating each component to deal with its specific requirements individually, and, simultaneously, obtaining modular and portable components. It takes advantage of the
object-oriented paradigm support provided by Python, which allows maximizing reusability and guarantees the persistence of a functionality already in operation. This strategy simplifies the addition of new
Fig. 5. OPENCoastS0forecast systems component.
Fig. 6. OPENCoastS0outputs viewer: from left to right, the “Systems”, “Charts” and “Map” panels.
functionalities, typically by extending – through subclasses – core en-tities already defined.
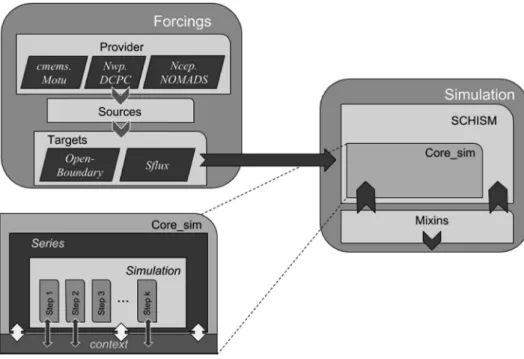
The WIFF framework has several components, or packages, in Py-thon. Currently, the existing components are simulating, forcings,
pro-cessing and a special one called core (Fig. 8):
● core contains common aspects shared by other components; ● simulating addresses the specific details of running simulations; ● forcings implements mechanisms to retrieve boundary conditions; ● processing offers post-processing data routines.
Each component has its own sub-components – sub-packages and modules in Python – with different structures and philosophies, as well as distinct relations with other components.
The core component defines three common features, or core entities, present in almost all other entities of the framework: identification, configuration and logging. These entities provide the most fundamental and common functionalities required by most other entities. Besides the core entities, there is also a utilities helper, providing common stand-alone functions, such as text and date manipulation.
The forcings component gathers the results from global or regional numerical model services, made available through the internet. These global/regional outputs are used as inputs at our model boundaries for the daily prediction period. There are three types of entities in this component: Sources, Targets and Providers, each of them with a different set of tasks and capabilities. By combining one of each type of these en-tities, a complete solution for boundary conditions can be assembled.
Source entities handle the data format of forcing services. Forcing data
must be presented as a NumPy array, a common feature in python sci-entific data libraries, like the NetCDF case. Provider entities must be able to abstract the differences between the services supplying forcings and to offer a generic and consistent interface for fetching them. Currently,
cmems.Motu (http://marine.copernicus.eu/faq/what-are-the-motu-and-p ython-requirements/) from Copernicus, nwp.DCPC (http://dcpc-nwp. meteo.fr/openwis-user-portal/srv/en/main.home) from M�et�eoFrance and ncep.NOMADS (https://nomads.ncep.noaa.gov/) from NOAA are available in OPENCoastS. Lastly, Target entities deal with the specific
details of the output format and produce valid input files by complying with the constraints and requirements imposed by the chosen numerical model. Two targets are implemented, OpenBoundary and Sflux, for model SCHISM’s ocean and atmospheric forcings, respectively.
The simulating component implements all functionalities related to the execution of models, including all sub-components needed to create a forecast system. Being the main component of WIFF, it is split into sub- components, namely core_sim, mixins and schism. The core_sim sub- component comprises four generic entities, named Series, Simulation,
Step and Context. These entities are agnostic and do not perform any
operation concerning a specific simulation model:
● Series builds a chain of simulations with a defined interval or a set of scenarios with different conditions;
● Simulation is responsible for the execution of its corresponding steps; ● Step defines an interface to implement concrete procedures, being
specified later for a specific model; and
● Context monitors and stores the state of execution being updated through the steps of a simulation.
Although Series, Simulation and Context entities may be used directly,
Step is just a skeleton, thus its implementation must be extended to serve
a particular model. The mixins sub-component is also a special kind of entity, intended to be coupled with other entities to perform common tasks. Like core’s base entities, a mixin entity provides behavior to be shared among other entities and cannot be executed individually. An example of the functionalities provided by this entity is copying files from one place to another. The schism sub-component encompasses everything specific about the SCHISM numerical model, from steps dealing with the simulation procedure to parameterization helpers defining systematic ways to produce the required input files. All schism’s steps extend the Step entity, from simulating’s core_sim sub-component.
Fig. 9 illustrates the application of WIFF to support SCHISM predictions.
4.3. OPENCoastS as a WIFF application
WIFF is at the heart of the OPENCoastS service since it handles all aspects of preparing and running forecast simulations. Following WIFF’s philosophy of extending core behavior, OPENCoastS defines new
simu-lating steps to perform the functionality not provided already by WIFF.
The additional steps implement specific procedures devoted only to OPENCoastS. Therefore, they are not included in WIFF, to maintain its generic applicability. The procedures range from reporting the state of each simulation throughout its execution to publishing the results and information produced during the model runs.
OPENCoastS and WIFF are connected at the database level, through the OPENCoastS steps, which retrieve and store the required data during the simulation execution. These steps use the Django object-relational mapping layer (ORM) to generalize the interaction with a specific database solution: it can be used to interact with application data from various relational databases such as PostgreSQL or MySQL. This approach makes the solution more flexible for different database choices and easier to develop. Since database systems have native network support, splitting components of OPENCoastS workflow across different machines in a network becomes effortless.
5. Implementation in EOSC
The OPENCoastS platform has been deployed in the INCD cloud infrastructure, one of the infrastructure provider within EOSC (https:// www.eosc-portal.eu/), to provide the OPENCoastS service. INCD is based on the Openstack Cloud Management Framework and is inte-grated into the EGI Federated Cloud (the EOSC cloud computing ser-vice). EOSC provides several types of services, including computing from EGI (cloud and grid), storage from EUDAT, authentication and authorization infrastructure (AAI) from EGI. The OPENCoastS platform
Fig. 7. Forecasting workflow.
Environmental Modelling and Software 124 (2020) 104585
is being integrated with some of these services in the framework of EOSC-hub Thematic Services. Presently, it takes advantage of both AAI and computing services in EOSC.
OPENCoastS’s architecture implementation in EOSC is shown in
Fig. 10. Its sub-services, such as the Web frontend and backend, data-base, ncWMS and data management services, are deployed in cloud resources. Computing resources for the OPENCoastS Deployments and corresponding simulations can be provided by farm clusters at INCD. The EGI Grid Computing infrastructure can also be used through the DIRAC4EGI workload management service. The EGI Checkin service provides Federated user Authentication for OPENCoastS users. The Authorization policies are implemented in the OPENCoasts backend service. In the future, permanent storage will be provided by the “b2safe” EUDAT service.
The OPENCoastS platform sub-services are also under deployment in the CSIC/IFCA cloud infrastructure (also integrated within the EGI Federated Cloud and part of EOSC resources). This implementation is of major importance to provide scalability of the service as the number of users/deployments grows and to provide redundancy to guarantee
service operation. Guarantee of service is fundamental for quality assurance of operational forecast systems.
6. Examples of application
6.1. Tides and storm surges in the Tagus estuary
The present implementation of OPENCoastS offers the choice be-tween two alternative atmospheric forcings sources and two alternative sources for ocean boundary conditions. Winds and atmospheric pressure are provided by the GFS - NCEP or ARPEGE - M�et�eo-France. Water el-evations at the ocean boundary can be prescribed from either a global tidal model (FES2014; Carrere et al., 2016) or a regional tide-surge model (PRISM2017, Fortunato et al., 2016, 2017a). At the river boundaries, the yearly mean river flows were imposed, as they do not affect the water levels inside the estuary (Vargas et al., 2008). When tidal elevations are imposed from FES2014 and atmospheric forcings are prescribed, the inverse barometer effect is also included at the boundary to estimate the incoming surge, assuming that the surge in the deep
Fig. 9. WIFF application for SCHISM model.
Fig. 10. OPENCoastS architecture implementation.
ocean is dominated by the atmospheric pressure. Each model offers different grid resolutions (GFS: 0.25�; ARPEGE: 0.1�) and extent and
represents different processes. However, it is unclear which options lead to the best results, and comparisons are required to provide guidance to the users.
In order to assess the relative merits of these different forcings to simulate tides and surges, a previously calibrated and validated appli-cation of SCHISM to the Tagus estuary (Fortunato et al., 2017b, Fig. 11) was implemented in OPENCoastS with different forcings. The accuracy of the different implementations was compared in the simulation of the period between December 15, 2018, and February 15, 2019. Three error measures were used in the comparison: the bias, the unbiased root mean square error (URMSE) and the unbiased root mean square error at high tide (UHTRMSE). Unbiased errors were determined by removing the means from both the measurements and the model results before computing the errors. Unbiased errors are independent from the bias, which can be due to both model errors and data errors (e.g. inadequate vertical referencing of the tide gauge).
Errors were computed at two tide gauges (Cascais and Marina,
Fig. 11). Data at Cascais were measured with an acoustic tide gauge until the end of January and with radar in February. Hourly values were obtained using a Butterworth filter to eliminate high-frequency oscilla-tions due to seiches. The water surface at Marina is measured with an optical sensor attached to a structure above the water. Outliers were eliminated from the time series and then the Butterworth filter was again used to determine hourly data. Also, because at low spring tide the spot under the sensor dries out, elevations below a given threshold were clipped. Model results were adjusted to the Cascais Hydrographic Zero by assuming the mean sea level to be 2.29 m above this datum.
Overall, water level errors (Table 1) compare favorably with previ-ous hindcast applications for this estuary (e.g., Fortunato et al., 2017b;
Rodrigues and Fortunato, 2017). Results show that simulations forced by FES2014 are more biased than those forced by PRISM2017. This behavior suggests that computing the surge at the model boundary using the inverse barometer effect alone underestimates its value. This prob-lem could probably be overcome by increasing the extent of the ocean part of the domain. Results also show that, at Cascais, FES2014 leads to smaller URMSE and UHTRMSE than PRISM2017. These results are probably due to the larger number of tidal constituents in FES2014, since PRISM2017 is forced by its predecessor, FES2012. At the Marina station, the unbiased errors are smaller for the simulations forced by PRISM2017 than for those forced by FES2014, possibly due to error compensation. Finally, although ARPEGE has a higher spatial resolution than GFS, the accuracy of the simulations forced by ARPEGE is only marginally superior.
6.2. Impact of domain size on surge simulation: the central part of the Bay of Biscay
Each forecast relies on an unstructured grid provided by the user. However, it is not straightforward to define the grid geographic exten-sion that will accurately reproduce the physical processes that are rep-resented in the forecast system. This application aims at studying the impact of domain size on total water levels and storm surges.
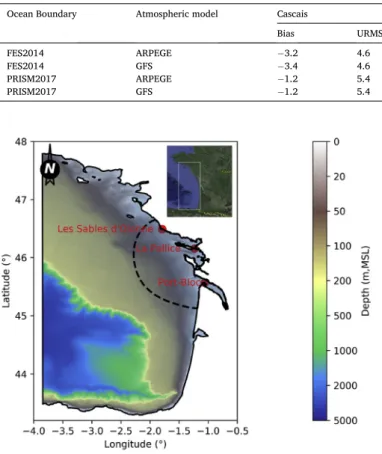
We took advantage of the recent storm Gabriel, which made landfall in the central part of the Bay of Biscay on January 29, 2019 and induced a storm surge with a return period of the order of 5 years at La Rochelle according to the estimations of storm surge return periods of Hamdi et al. (2015). Water levels variations during storm Gabriel were simu-lated with two computational grids of different geographic extents: the larger grid covers the whole Bay of Biscay and the smaller one extends from the French coast to depths of about 130 m in the central part of the Bay of Biscay (Fig. 12).
Both simulations were forced by 10 m winds and sea-level atmo-spheric pressure originating from the ARPEGE - M�et�eo-France. Along the open boundary, both models were forced with the amplitude and phase of the 34 main tidal constituents originating from FES 2014 and an in-verse barometer condition was also prescribed. Freshwater discharges were not included because previous studies showed that their impact on water levels is negligible at the considered tide gauges (Bertin et al., 2014). As both computational domains have an identical spatial reso-lution (100–1200 m) over regions in common and were run with the same forcings and model parameters, one can expect that the differences in model response are mostly due to the different domain size. The model results were compared against observations recorded 24 h before and after the storm at three tide gauges: La Rochelle, Les Sables d’Olonne and Port-Bloc (Fig. 13). Total water levels are well reproduced by both models, with a URMSE ranging from 0.10 m at Les Sables d’Olonne and 0.13–0.14 m at La Pallice and Port-Bloc, respectively. Storm surges were computed from observations using a tidal prediction performed with U_Tide (Codiga, 2011) over one year of water level observations preceding the studied period. Modeled storm surges were computed as the difference between the baseline run and a run forced with tides only. The storm surges from the large grid are reproduced with a URMSE ranging from 0.06 to 0.085 m at the three tide gauges. The surge peak is quite well captured, although with a negative bias ranging from 0.05 m at Port-Bloc to 0.15 m at La Pallice. The comparison between the results of the two grid configurations reveals that the large grid yields total water levels and storm surges less biased than those obtained with the smaller grid. At the three stations, storm surges simulated with the large grid have a URMSE improved by 20%–30% compared to the small grid and the storm peak is better reproduced. After the surge peak, residual water levels display oscillations with pe-riods of 6h00 and amplitudes ranging from 0.10 m at Port-Bloc and Les Sables d’Olonne and 0.20 m at La Pallice. Such oscillations were already described during the storm Xynthia (February 2010) and explained by
Bertin et al. (2012) through a resonant process of the storm surge over the shelf. The comparison between observed and modeled storm surge (Fig. 13) shows that this phenomenon is much better reproduced by the model that uses the large grid compared to the small grid (Fig. 13). This suggests that the whole shelf should be included in the computational domain to capture this resonant process.
The model results analysis demonstrates good predictive skills of the forecast system. However, the surge peak remains underestimated by up to 0.15 m. Previous studies on storm surges in the area reported that the wave setup driven by short wave breaking can propagate outside surf zones and contribute to storm surges by 0.10–0.20 m in the sheltered harbors where the tide gauges are located (Breilh et al., 2014; Bertin et al., 2015a). However, these studies employed a spatial resolution of the order of 25 m along the coast, which is one order of magnitude finer than the grids used in this study. In the near future, OPENCoastS will be updated to a fully coupled wave-current system, using the spectral wind
Environmental Modelling and Software 124 (2020) 104585
wave model WWM (Roland et al., 2012).
The differences obtained between the two domain sizes show that the effect of the inverse barometer is improved by extending the ocean part of the grid, which corroborates the results analysis of the previous application (section 6.1): representing the incoming surge along the open boundary through an inverse barometer alone is less accurate
when the modeled domain is restricted to the inner shelf. Blain et al. (1994) suggested that a domain small in size compared to the size of the storm, and located on the continental shelf can substantially underes-timate the storm surge. Indeed, forcing the domain with adequate boundary conditions is difficult because the corresponding ocean boundaries are situated in an area of storm surges generation. On the contrary, a domain sufficiently extended allows the realistic and accu-rate reproduction of the resonant modes of the basin and the develop-ment and propagation of the storm surge.
6.3. Discussion
The setup of the forecasts and the comparison of the model results with tide gauge data require the knowledge of the vertical datum and its relation to the mean sea level. Usually, tide gauge data and local ba-thymetries are referred to a local hydrographic zero, as is the case for most elevation time series extracted from EMODnet. In many cases, establishing the distance between the hydrographic zero and the mean sea level considered at the boundaries may be difficult. This difficulty can be overcome in the model validations by focusing on unbiased er-rors. However, for the forecast to provide water elevations relative to a known datum, like in the case of the simulation of the storm Gabriel, the user must provide the correct vertical displacement between the grid datum and the mean sea level.
This information is not always readily available. First, sea level rise and local subsidence must be taken into account to determine the pre-sent mean sea level (e.g. W€oppelmann and Marcos, 2016). For instance, the Tagus estuary forecasts presented above used the most recent data from the Cascais tide gauge to estimate the present mean sea level in the modeled domain. Secondly, sea level also varies on seasonal scales, mostly due to thermo-steric effects (e.g., Bertin et al., 2015b). These
Table 1
Errors in the Tagus forecasts (cm).
Ocean Boundary Atmospheric model Cascais Marina
Bias URMSE UHTRMSE Bias URMSE UHTRMSE
FES2014 ARPEGE 3.2 4.6 3.8 4.2 12.2 7.0
FES2014 GFS 3.4 4.6 3.8 4.5 12.2 7.1
PRISM2017 ARPEGE 1.2 5.4 4.4 2.4 11.8 6.7
PRISM2017 GFS 1.2 5.4 4.5 2.3 11.8 6.8
Fig. 12. Large grid and open boundary of the small grid (black dashed line), bathymetry and tide gauges.
Fig. 13. Observed against modeled water elevations and storm surges at La Pallice, Les Sables d’Olonne and Port-Bloc.
effects are associated with changes in the water temperature, which lead to an expansion or a contraction of the water column at regional scales. Mean sea-level can also vary at seasonal and inter-annual timescales due to long-term changes in wind forcing, which can only be partly captured using short-term runs with a 2DH barotropic model. Indeed, Calafat et al. (2012) showed that the stratification of the ocean upper layers can impact the Ekman transport and drive subtle baroclinic effects, resulting for instance in coastally trapped waves. Present forecasts produced by OPENCoastS neglect thermo-steric and baroclinic effects, which they cannot reproduce. This simplification introduces a seasonal error in the predicted elevations, which probably explains part of the negative biases obtained in the Tagus and Bay of Biscay forecasts. Future implementa-tions of OPENCoastS will offer ocean boundary forcings that include estimates of thermo-steric effects.
7. Conclusions and perspectives
The OPENCoastS service, presented herein, builds on-demand cir-culation forecast systems for user-selected coastal regions at a global level and maintains them running operationally for the time frame defined by the user, taking advantage of a transparent linkage to EOSC- hub resources and core services. This innovative concept and tool can now be explored to address the needs of coastal managers, public in-stitutions and private companies with responsibilities in emergency and monitoring purposes across Europe and worldwide, as OPENCoastS can support planning activities, from daily tasks to strategic interventions. Being able to reproduce the operational behavior of coastal engineering interventions (even before they are implemented), the OPENCoastS service is also a valuable tool for consultancy companies working in the field of coastal engineering to support engineering projects and their conceptualization and implementation. This freely available service also facilitates the access to circulation forecasts to research groups with little experience in numerical modeling of oceanic and coastal zones physics, which have strong needs in understanding the impact of water dynamics in water quality, ecology, and sediments dynamics. By making the service available for deployment in any world coastal region, OPENCoastS leverages the conditions for any entity to develop their research responsibilities in a faster, efficient and high accuracy way.
Users’ feedback on the present service (collected from the training events and the service rating at the platform) are very positive. There-fore, the proof of concept attained by this 2DH circulation service is now being extended to more complex coastal physical processes such as 3D baroclinic circulation, the interaction between currents and waves in 2DH and 3D, and morphodynamics. In particular, further developments are needed to consider the wave-induced contribution to storm surge level at the coast, therefore requiring the forecasting of wave dynamics. Also, forcing OPENCoastS with watershed forecasts (e.g., Campuzano et al., 2016) can provide accurate estimations of freshwater flows in natural rivers (i.e., without dam control). These evolutions will improve the accuracy of the forecasts by including neglected physical processes, such as wave-induced setup, and forcings, such as thermo-steric effects. More importantly, it will fully address the most relevant concerns on coastal regions such as coastal erosion, inlet stability, and safety of navigation and shelter in ports.
Our experience indicates that, for many users, providing an un-structured grid is the major difficulty in the adoption of the OPENCoastS service. Although several grid generators are available (e.g., Geuzaine and Remacle, 2009; Conroy et al., 2012; Roberts et al., 2018), they can be difficult to use and the criteria for grid generation are model-dependent. In order to help users, a podcast on grid generation is available through the OPENCoastS web pages, and a public repository of grids for coastal systems was created (https://github.com/LNEC-G TI/OPENCoastS-Grids, Oliveira et al., 2019).
The demonstration of the capacity of a forecast service to address the coastal community needs provided herein also opens the door to its extension to other aquatic domains. Integrating the urban drainage
component as well as the freshwater water bodies’ dynamics sets the stage for a global forecast service. Linking the water compartments that each user requires over the basin-to-ocean dimensions is one of the av-enues to pursue, providing full flexibility and coverage of water physical processes. Once this global provider for physical processes is available, targeted water quality goals can also be analyzed and implemented, bearing in mind that a strong articulation with field data, through in-situ and remote data assimilation and multiple water quality models, be-comes essential for reliable water predictions. Computational resources, in particular for complex process interactions across multiple domains, also becomes a concern and strategies for high efficiency are required, linking CPU and GPU paradigms, as well as distributed and HPC computing.
Acknowledgements
This work was partially funded by the European Commission through the H2020 project EOSC-hub (Grant Agreement No 777536), by the Lisboa2020 Operational Program through the INCD project (LIS-BOA-01-0145-FEDER-022153) and by the Fundaç~ao Portuguesa para a Ci^encia e a Tecnologia through project UBEST (PTDC/AAG-MAA/6899/ 2014). This work made use of results produced with the support of the Portuguese National Grid Initiative; more information in https://wiki. ncg.ingrid.pt. Data from the Marina station were obtained with a SenZ2 sensor in the scope of the agreement between this company and LNEC. The authors thank Sonia Castanedo and Fernando M�endez, from the University of Cantabria, for a thorough review of the manuscript, as well as the editor and two anonymous reviewers for constructive suggestions.
References
Abascal, A.J., Castanedo, S., Nú~nez, P., Mellor, A., Clements, A., P�erez, B., C�ardenas, M., Chiri, H., Medina, R., 2017. A high-resolution operational forecast system for oil spill response in Belfast Lough. Mar. Pollut. Bull. 114, 302–314. https://doi.org/ 10.1016/j.marpolbul.2016.09.042.
Baptista, A.M., Howe, B., Freire, J., Maier, D., Silva, C.T., 2008. Scientific exploration in the era of ocean observatories. Comput. Sci. Eng. 10 (3), 53–58.
Bedri, Z., Corkery, A., O’Sullivan, J.J., Alvarez, M.X., Erichsen, A.C., Deering, L.A., Demeter, K., O’Hare, G.M.P., Meijer, W.G., Masterson, B., 2014. An integrated catchment-coastal modelling system for real-time water quality forecasts. Environ. Model. Softw 61, 458–476. https://doi.org/10.1016/j.envsoft.2014.02.006.
Bertin, X., Bruneau, N., Breilh, J.F., Fortunato, A.B., Karpytchev, M., 2012. Importance of wave age and resonance in storm surges: the case Xynthia, Bay of Biscay. Ocean Model. 42, 16–30.
Bertin, X., Li, K., Roland, A., Breilh, J.F., Zhang, Y.L., Chaumillon, E., 2014. A modeling- based analysis of the flooding associated with Xynthia, central Bay of Biscay. Coast Eng. 94, 80–89.
Bertin, X., Li, K., Roland, A., Bidlot, J.R., 2015a. The contribution of short waves in storm surges: two recent examples in the central part of the Bay of Biscay. Cont. Shelf Res. 96, 1–15.
Bertin, X., Fortunato, A.B., Dodet, G., 2015b. Processes controlling the seasonal cycle of wave-dominated inlets. Rev. Gest~ao Costeira Integr. (15), 9–19.
Blain, C.A., Westerink, J.J., Luettich, R.A., 1994. The influence of domain size on the response characteristics of a hurricane storm surge model. J. Geophys. Res.: Oceans 99 (C9), 18467–18479.
Blower, J.D., Gemmell, A.L., Griffiths, G.H., Haines, K., Santokhee, A., Yang, X., 2013. A Web Map Service implementation for the visualization of multidimensional gridded environmental data. Environ. Model. Softw 47, 218–224. https://doi.org/ 10.1016/j.envsoft.2013.04.002.
Brassington, G.B., Pugh, T., Spillman, C., Schulz, E., Beggs, H., Schiller, A., Oke, P.R., 2007. BLUElink development of operational oceanography and servicing in Australia. J. Res. Pract. Inf. Technol. 39/2, 151–164.
Breilh, J.F., Bertin, X., Chaumillon, E., Giloy, N., Sauzeau, T., 2014. How frequent is storm-induced flooding in the central part of the Bay of Biscay? Glob. Planet. Chang. 122, 161–175.
Breivik, O., Allen, A.A., 2008. An operational search and rescue model for the Norwegian Sea and the North Sea. J. Mar. Syst. 69 (1–2), 99–113. https://doi.org/10.1016/j. jmarsys.2007.02.010.
Calafat, F.M., Chambers, D.P., Tsimplis, M.N., 2012. Mechanisms of decadal sea level variability in the eastern North Atlantic and the Mediterranean Sea. J. Geophys. Res. 117, C09022. https://doi.org/10.1029/2012JC008285.
Campuzano, F., Brito, D., Juliano, M., Fernandes, R., de Pablo, H., Neves, R., 2016. Coupling watersheds, estuaries and regional ocean through numerical modelling for Western Iberia: a novel methodology. Ocean Dyn. 66/12, 1745–1756. https://doi. org/10.1007/s10236-016-1005-4.