Ingredient branding influence on Purchase Intention
and Willingness to Pay:
The Smartphone Case in Portugal
Pedro Rodrigues Vaz
Dissertation written under the supervision of Prof. Nuno Crispim
Dissertation submitted in partial fulfilment of requirements for the
International MSc in Management with Major in Corporate Finance, at
the Católica-Lisbon School of Business and Economics
January 2019
2 “Education is not something you can finish.”
3
ABSTRACT
Title: Ingredient branding influence on Purchase Intention and Willingness to Pay: The
Smartphone Case in Portugal.
Author: Pedro Rodrigues Vaz.
The smartphone industry has been through a drastic revolution. Recent smartphones greatly outperform outdated models, offering a wide range of new functionalities. However, the once fast-growing industry is now facing a slower growth, despite continuous significant investment in R&D.
Consequently, even the biggest players are losing market share and striving to differentiate themselves in such a competitive market. Now, more than ever in the industry, it is very important to understand what exactly consumers are looking for in a smartphone, what they give value to and what features they are willing to pay for.
The aim of this Research is to test the potential of the Ingredient Branding strategy on Smartphones as well as provide Brands with insights on the most valued characteristics. First, the Factors that influence Smartphone Purchase Intention are validated. Then, two scenarios are compared, with and without a branded ingredient, and the differences are analyzed.
The methodology used comprised both qualitative and quantitative data from In-Depth Interviews of 5 different Smartphone User Profiles, gathered in a survey with 240 valid respondents. All the analysis was supported with a detailed analysis of the existing literature on the Factors affecting Smartphone Purchase Intention and Ingredient Branding: its positive and negative effects.
The main findings suggest that consumers are willing to pay a Price Premium for smartphones with Branded ingredients and that the association of a smartphone with an high quality Brand increases its evaluation, giving strength to the theory of the positive spillover effects of ingredient branding when using high quality Brands, that have been studied over the years in different products and industries.
Keywords: Smartphone; Ingredient Branding, Co-Branding; Purchase Intention; Willingness
4
RESUMO
Título: Influência da estratégia de Ingredient Branding na Intenção de Compra e Disposição a
Pagar: Caso dos smartphones no mercado português.
Autor: Pedro Rodrigues Vaz.
A indústria dos smartphones tem sofrido uma revolução drástica. O desempenho dos smartphones mais recentes ultrapassa largamente o desempenho dos modelos mais antigos, oferecendo hoje novas funcionalidades. Contudo, a indústria que recentemente se encontrava em larga expansão enfrenta agora um abrandamento no crescimento, apesar do investimento contínuo e significativo em I&D.
Como consequência, até os grandes da indústria estão a perder quota de mercado e a lutar para se diferenciarem da competição num mercado feroz. Agora mais do que nunca, é extremamente importante perceber o que procuram os consumidores num smartphone, o que mais valorizam, e quais as características pelas quais estão dispostos a pagar
Este estudo tem como objetivo avaliar o potencial da estratégia Ingredient Branding, em smartphones bem como providenciar informação útil às marcas, relativamente às características mais valorizadas. Primeiro, os fatores que influenciam a Intenção de Compra de um smartphone são validados e, posteriormente, são comparados dois cenários, um telemóvel sem e com um branded ingredient, permitindo a análise das diferenças entre os cenários.
A metodologia usada consistiu em recolher dados qualitativos, através de 5 entrevistas profundas a utilizadores com perfis diferentes, e quantitativos, através da análise de um questionário que contou com 240 respostas válidas. Toda a análise efetuada teve como suporte a literatura existente tanto sobre os fatores que afetam a intenção de compra de smartphones bem como dos estudos passados sobre os efeitos positivos e negativos da estratégia de Ingredient Branding.
As principais conclusões do estudo são que a maioria dos consumidores demonstrou recetividade e intenção de pagar um montante superior pela versão do smartphone com um branded ingredient bem como as avaliações das duas alternativas foram significativamente superiores no segundo cenário (com o branded ingredient), comprovando que os efeitos de associação positivos revelados em estudos anteriores se estendem ao mercado dos smartphones.
Palavras-Chave: Smartphone; Ingredient Branding, Co-Branding; Intenção de Compra;
Vontade de Pagar; Confiança; Imagem da Marca; Valor Funcional; Valor Emocional; Valor Social
5
ACKNOWLEDGEMENTS
First of all, I would like to thank my parents and friends, as well as my incredible sister Sofia, for all the talks, patience and never-ending support. A special thank you to my friends João Francisco, Ricardo Peixoto, Paulo Véstia, Maria Maximiano and Bernardo Rainha for keeping me focused and motivated.
Secondly, I would like to express my gratitude to my advisor, Professor Nuno Crispim, who never gave up on me during this challenging journey and was present and supportive when I needed the most.
Lastly, I would like to thank all those who contributed to the outcome of this dissertation, especially the interviewees and all the ones who answered the survey. Thank you for your time. You are part of it.
6 TABLE OF CONTENTS ABSTRACT ... 3 RESUMO ... 4 ACKNOWLEDGEMENTS ... 5 TABLE OF CONTENTS ... 6 1. INTRODUCTION ... 10 1.1. Background ... 10 1.2. Problem Statement ... 10
1.3. Aim of the Research ... 11
1.4. Research Method ... 11
1.5. Academic and Managerial Relevance ... 12
1.6. Dissertation Outline ... 12
2 LITERATURE REVIEW ... 13
1. SMARTPHONES ... 13
1.1 Mobile Growth ... 14
1.2 Main Players ... 15
1.3 Smartphone market in Portugal ... 16
1.4 “What the Internet is Saying” – Internet Review Complement ... 17
2. INGREDIENT BRANDING ... 17
2.1 Brand Equity... 18
2.2 Branding & Co-Branding ... 18
2.3 Ingredient Branding ... 20
2.3.1 Ingredient Branding Effects ... 20
2.3.2 Ingredient Branding Examples ... 23
2.3.3 Ingredient Branding Precautions ... 23
3. FACTORS AFFECTING SMARTPHONE PURCHASE INTENTION ... 24
3.1 Purchase Intention ... 24 3.2 Functional Value ... 25 3.3 Emotional Value ... 25 3.4 Social Value ... 26 3.5 Trust 27 3.6 Brand Image ... 28 3.7 Willingness to Pay ... 29
7
3 METHODOLOGY ... 30
1. Research Approach and Design... 30
1.1. Literature Review: Exploratory Research ... 31
1.2. In-Depth Interviews: Exploratory and Descriptive Research ... 31
1.3. Online Survey – Descriptive and Explanatory Research ... 32
2. Conceptual Model ... 33 4. RESULT ANALYSIS ... 35 4.1. Literature Review ... 35 4.2. Qualitative Research ... 36 4.2.1. In Depth Interviews ... 36 4.3. Quantitative Research ... 37 4.3.1. Preliminary Analysis ... 37 4.3.2. Sample Characterization ... 37 4.3.3. Data Reliability ... 39 4.3.4. In-Depth Analysis ... 39 4.3.4.1. RQ 1 - Features ... 40
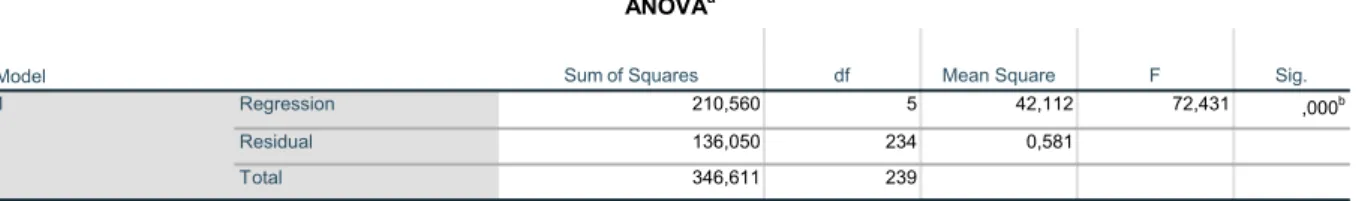
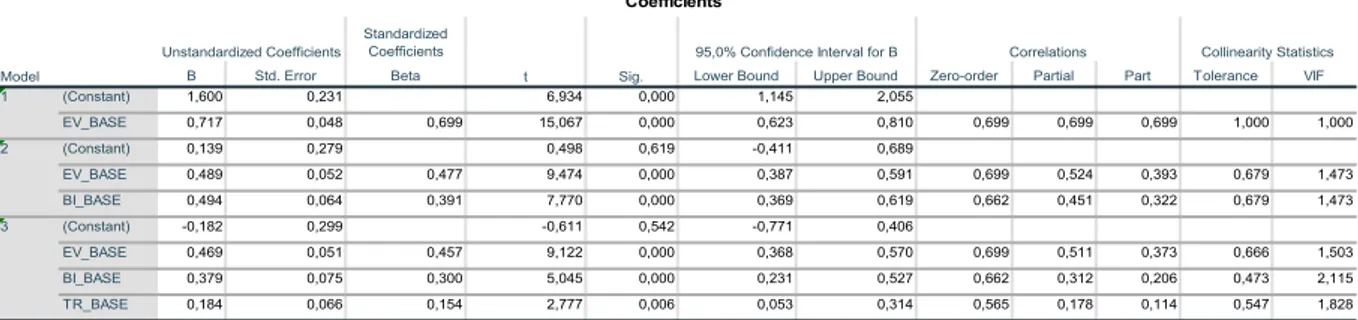
4.3.4.2. RQ 2 - Step 1 - Explanation of Purchase Intention ... 40
4.3.4.3. RQ 3 - Step 2 - Explanation of Willingness to Pay ... 42
4.3.4.4. RQ 4 - Ingredient Branding Effect on Purchase Intention ... 43
4.3.4.5. RQ 5 - Ingredient Branding Effect on Willingness to Pay ... 44
5 CONCLUSIONS ... 49
5.1 Main Conclusions ... 49
5.2 Limitations ... 50
5.3 Future Research ... 51
APPENDICES ... 52
APPENDIX I - Brand Equity Definitions and Components ... 52
1. Brand Equity Definitions ... 52
2. Brand Equity Components according to Aaker (1991) ... 52
2.1. Brand Awareness ... 52
2.2. Perceived Quality ... 53
2.3. Brand Loyalty ... 53
2.4. Brand Associations ... 54
APPENDIX II – “What the Internet is Saying” ... 55
Status on Technology Blogs / Online Newspapers ... 55
APPENDIX III – Types of Research ... 59
8
Interview Guidelines ... 59
In-Depth Interview Gonçalo Simões ... 60
In-Depth Interview Fernanda Antunes ... 61
In-Depth Interview Diogo Dias ... 62
In-Depth Interview Ricardo Peixoto ... 63
In-Depth Interviews Margarida Tomé ... 63
APPENDIX V – Survey ... 64
APPENDIX VI – Measures ... 76
APPENDIX VII – RQ1 - Evaluation of Characteristics / Features ... 77
APPENDIX VIII – RQ 2 - Explanation of Purchase Intention ... 77
APPENDIX IX – RQ 3 - Explanation of Willingness to Pay ... 79
APPENDIX X – RQ 4 and 5 – Ingredient Branding Effect ... 80
APPENDIX XI – Summary of Conclusions ... 80
9
LIST OF FIGURES
Figure 1 – Evolution of Mobile Phones ... 14
Figure 2 – Conceptual Model created for Dissertation... 34
Figure 3 – Application of Conceptual Model ... 43
LIST OF GRAPHICS Graphic 1 - Active Smartphone Users Globally per Region ... 14
Graphic 2 - Global market share held by smartphone vendors worldwide ... 15
Graphic 3 - Forecast of Smartphone User Numbers in Portugal from 2015 to 2022 ... 16
Graphic 4 - Smartphone versus Feature Phone in Portugal (in percentage) ... 17
LIST OF TABLES Table 1 - Definitions of Brand Equity ... 52
Table 2 - Summary of Survey Paths ... 66
Table 3 - Measures/Constructs ... 76
Table 4 - Evaluation of Characteristics / Features (1) ... 77
Table 5 - Evaluation of Characteristics / Features (2) ... 77
Table 6 - SPSS Outputs Regression on Purchase Intention (1) ... 77
Table 7 - SPSS Outputs Regression on Purchase Intention (2) ... 78
Table 8 - SPSS Outputs Regression on Willingness to Pay ... 79
10
1. INTRODUCTION 1.1. Background
The smartphone industry has been through a drastic revolution. Recent smartphones greatly outperform outdated models, offering a wide range of new functionalities. However, the once fast-growing industry is now facing a slower growth, despite continuous significant investment in R&D.
This can be translated into one phenomenon: fierce competition. Companies strive to differentiate and offer more value to their customers. Due to economies of scale and aggressive competition, the margins are pushed to the limit and companies are fighting each other on a daily basis. It is very important to understand what exactly are consumers looking for, which attributes, and how much they value each attribute.
Whilst companies might be fighting this battle on their own, there is one considerably unexplored option which might be the key for success: Ingredient Branding.
1.2. Problem Statement
The main objective of this dissertation is to understand to what extent Smartphone Brands can differentiate themselves using an Ingredient Branding strategy on one of their components. Although for instance in computers it is common, in smartphones the reality is different and it seems to be a strategy that is only now starting to be considered by some manufacturers (an example is the somewhat recent partnership of Huawei with Leica).
Hence, it is necessary to first find out if consumers will value the strategy and lastly if they will actually pay a Price Premium for it. Therefore, the following problem statement was defined for this study:
“Does Ingredient Branding positively influence perceptions of consumers and consequently willingness to pay a Price Premium?”
11
1.3. Aim of the Research
The aim of this Research is to individually assess the most representative Factors in previously studied smartphone purchase intention models and, after validating that they are indeed relevant, verify if and how sensitive these Factors are to an Ingredient Branding strategy.
The objective is to show consumers two products, one with a Branded characteristic that is valued by consumers and one without, and compare the evaluation between those two products. Potential spillover effects will then be examined. To perform this test the following Research Questions will be addressed on this Study:
RQ1: Which Smartphone Features/Characteristics are consumers valuing at the moment? RQ2: Which Factors influence purchase intention of Smartphones?
RQ3: Does Purchase Intention influence willingness to pay?
RQ4: Does Ingredient Branding enhance the evaluations of the Factors that influence Purchase
Intention as well as Purchase Intention?
RQ5: Does Ingredient Branding increase Willingness to Pay for a smartphone?
1.4. Research Method
In this study both exploratory, explanatory and descriptive research was conducted. The study focuses in the Portuguese population so primary data was collected both from in-depth interviews form five Portuguese people, of different ages and gender and from a quantitative Online Survey.
To better assess this information, the secondary data collected previously in the Literature Review was used as a support, enabling a comparison between previous findings on the effects of the Ingredient Branding strategy.
12
1.5. Academic and Managerial Relevance
Although many scholars have identified the potential of the strategy of Ingredient Branding there are not actual and up-to-date studies on it, especially on specific and applied cases, as for example the smartphone industry.
Additionally, Ingredient Branding Literature usually focus on the evaluation of perception and does not quantify its impact. Therefore, in this study, the objective was to go further and not only reach a conclusion of whether the strategy seemed to be beneficial but actually verify if consumers would reflect that on their willingness to pay. As mentioned before, in such a competitive market as the Smartphone one, where not even the market leaders can afford to stay idle, it is extremely relevant to continue improving and showing more value to consumers, especially because that is what they got used to over the last years: constant innovation.
1.6. Dissertation Outline
Five Chapters comprise this Dissertation. The first elaborates on the problem statement and research question that will be the main focus during the whole study. The second presents an overview of the existing Literature on the effects identified to date of Ingredient Branding and Factors that affect Smartphone Purchase Intention. Chapter three introduces the methodology and concept behind the study as well as a Conceptual Model. Next, in Chapter four several statistical and non-statistical analyzes take place that intend to answer the Research Questions. In the end, Chapter five summarizes the main conclusions, identifying the limitations of the study and pointing towards potential next research on the field.
13
2 LITERATURE REVIEW
1. SMARTPHONES
“We have all gotten so used to having these appendages, these devices that are almost like our other limb, that when they’re not there we start to panic.”
Lori Leibovich (HuffPost’s Executive Lifestyle Editor) Smartphones have revolutionized our lives. And they did it in such a smooth and gradual way that most of us did not even realize it. It just feels like the smartphones were always part of our lives. Going back to 2012, a study made by Google in 40 of the main markets found that in every three people, one had a smartphone. Just four years later this number rocketed to 70%. Although it started with the younger generations, it is now spreading to the older generations as well (Google Consumer Barometer, 2016).
Smartphones are mobile devices whose spectrum of functionalities comprises more than just making and receiving calls, text messages and voice mails. Core features of a Smartphone are its capacity to access the Internet as well as digital media such as pictures, videos and music. Additionally, smartphones require the ability to run small computer programs, usually referred to as applications or merely apps (Weinberg, 2012).
Since its creation in the first half of the 2000s to bring some innovation to an industry whose sales were decreasing annually (Giachetti, C and Marchi, G, 2010), the way they have been growing in the last few years, mainly this decade, is notorious. Not only the increase in the units sold, but also the way in which it is spreading around the whole world. Nowadays, almost every person has a smartphone, with instant access to the internet and the social networks, such as Facebook, Instagram, Snapchat, Twitter, etc as well as many other functionalities.
The Google Report previously mentioned, “The Internet in Numbers”, presents very interesting and surprising statistics which show a new reality. Conclusions range from the fact that the smartphone is the main and favorite camera for all age groups, that between 2012 and 2016 smartphone adoption has doubled, that for 6 in 10 people the first thing done in the morning is to reach their smartphone and that 63% of users under 25 years claim their smartphone is the primary way to listen to music. Additionally, that they are used for a plethora
14
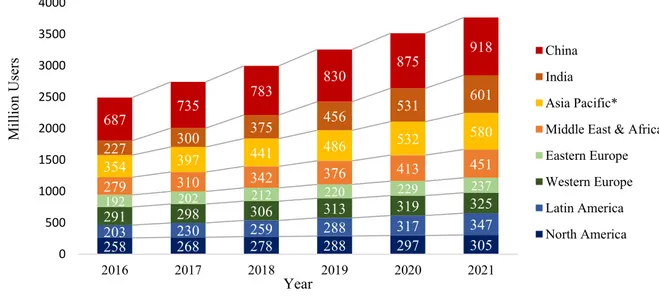
*Excludes India and China
Source: Global mobile market report, Sep. 2018 - newzoo.com/global-mobile-report
of tasks such as checking the news and the weather, playing games, tracking health and diets, travelling (orientation and maps), agenda, to-do lists, shopping and much more.
1.1 Mobile Growth
Although the first smartphone was created back in 1993 with the IBM Simmon, first attempt from the industry to create an all-in-one device that could join together the mobile telephony with the PDA functionality (Personal Digital Assistant) only in 2002 smartphones started having browsing functionalities and built-in cameras. Color screens
arrived the following year in 2003. In 2007 after significant improvements and advancements, three companies controlled the market, namely Microsoft, Palm and Blackberry, until a big disruption in the market: the arrival of the Apple iPhone which quickly became dominant in the upcoming years (Rothman et al, 2017).
As of today, after considerable and constant improvements, as Rothman et al (2017) stated, the market is focusing on “storage capacity, battery technology, processing power, screen enhancements, wireless technology, miniaturization, and to an extent, the operating systems as they are maturing”. Below, it is possible to see the evolution of Smartphone Users from 2016 to 2021 across the different regions. For most, the tendency is to grow.
Figure 1 – Evolution of Mobile Phones
258 268 278 288 297 305 203 230 259 288 317 347 291192 298 306 313 319 325 202 212 220 229 237 279 310 342 376 413 451 354 397 441 486 532 580 227 300 375 456 531 601 687 735 783 830 875 918 0 500 1000 1500 2000 2500 3000 3500 4000 2016 2017 2018 2019 2020 2021 Millio n User s Year China India Asia Pacific* Middle East & Africa Eastern Europe Western Europe Latin America North America Source: www.cashify.in/blog/the-last-decade-evolution-of-smartphones/
15
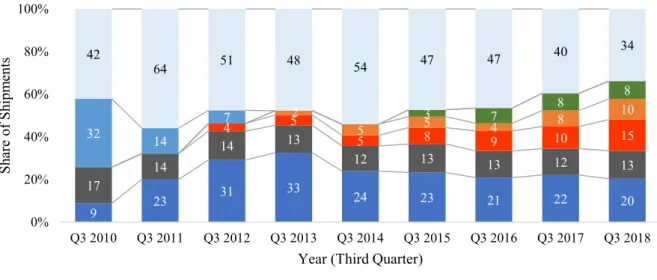
Source: https://www.statista.com/statistics/271496/global-market-share-held-by-smartphone-vendors-since-4th-quarter-2009/ 1.2 Main Players
The most recent data places the south Korean brand Samsung as the current leader in terms of market share (20,3% in Q3 of 2018), despite the recent expansion of Chinese brands such as Huawei, Xiaomi and Oppo (third, fourth and fifth placed in the world ranking, with 14,6 %, 9,7 % and 8,4%, respectively, only behind the previously mentioned Samsung and Apple (13,2%)).
This shows the gigantic growth of Chinese brands over this last few years, in some cases doubling their share comparing to the previous year. They have plans to expand its dominance in the European and Latin America markets, which will certainly increase their market share in the next couple of years and, who knows, give them the smartphone market dominance in the short term.
In the graph above is evidenced how dynamic and competitive the smartphone market is. Samsung and Apple are the two vendors that have been fightinging for the leadership of the market since 2011. In this fight, not all smartphones makers have survived. An example is the surprising case of Nokia. In Q3 of 2010 Nokia was positioned in the 1st position with 32% market share. In Q3 of 2011 it saw its marketing share decrease to 13,6% and just two years later is sales were marginal. Other vendors such as LG, Lenovo, ZTE, Sony have also been very important in the industry but never managed to differentiate and grow at the same level as the Chinese Brands already mentioned.
Graphic 2 - Global market share held by smartphone vendors worldwide.
(Data is from the 3rd Quarter of each year)
9 23 31 33 24 23 21 22 20 17 14 14 13 12 13 13 12 13 4 5 5 8 9 10 15 2 5 5 4 8 10 3 7 8 8 32 14 7 42 64 51 48 54 47 47 40 34 0% 20% 40% 60% 80% 100% Q3 2010 Q3 2011 Q3 2012 Q3 2013 Q3 2014 Q3 2015 Q3 2016 Q3 2017 Q3 2018 Sh ar e of Sh ip m en ts
Year (Third Quarter)
16
*Forecast
Source: https://www.statista.com/statistics/566177/predicted-number-of-smartphone-users-in-portugal/
Samsung is worthy of further attention, as the global market leader and it is also present in several other markets, from financial services, to entertainment systems and chemicals, among others.
Focusing on smartphones, the number one product of Samsung is the Galaxy series, firstly released into the market in April 2009. A look at the increase in smartphone’s shipments by Samsung is enough to realize the dimension of its achievements: from 2,4 million shipments in the first quarter of 2010 to 74,1 million shipments in the fourth quarter of 2017. (Statista, 2018).
1.3 Smartphone market in Portugal
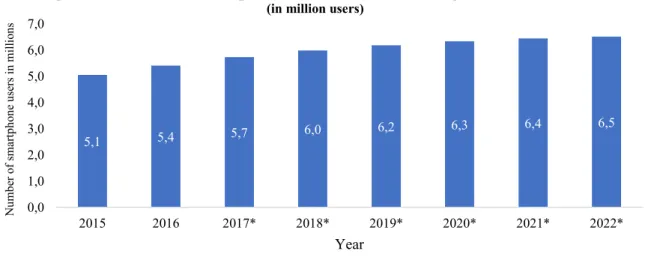
On a brief reference to the Portuguese market, it is expected a rise in the number of smartphone users, meaning it is a market that still presents growth potential as shown in the graph below. An IDC analysis found that in the Portuguese market three Brands only comprised 64% of the total market sales in the first quarter of 2018. This quarter was also the first time in the history of Portugal that Huawei surpassed Samsung in a tight fight becoming the leader of the market with 152 000 smartphones sold and a market share of 25%, opposing to Samsung’s 147 000 units and 25% equal share. In the third place comes Apple, with 84 000 smartphones sold and a market share of 14%.
Marktest annually evaluates the smartphone penetration in the Portuguese market. Examining the information on Graphic 4, it is possible to conclude that by the end of 2013 Portuguese started using and owning more smartphones than feature phones and also that there
5,1 5,4 5,7 6,0 6,2 6,3 6,4 6,5 0,0 1,0 2,0 3,0 4,0 5,0 6,0 7,0 2015 2016 2017* 2018* 2019* 2020* 2021* 2022* N umb er o f smar tp ho ne u se rs i n mi lli on s Year
Graphic 3 - Forecast of Smartphone User Numbers in Portugal from 2015 to 2022
17
Source: BTC Mobile Phone – Marktest (information privately shared for the dissertation)
are still many Portuguese who have a feature phone and therefore are potential smartphone users.
Graphic 4 - Smartphone versus Feature Phone in Portugal (in percentage)
1.4 “What the Internet is Saying” – Internet Review Complement
A general research was conducted on the internet over some of the most renowned and well-known Online Newspapers, Forums and Tech Blogs, named for the purpose of this dissertation “What the Internet is Saying”. A summary and overview of this research with the main insights from each piece considered can be seen on Appendix II. It was extremely relevant as it helped in consolidating the information on the Smartphone market.
2. INGREDIENT BRANDING
“Your premium brand had better be delivering something special, or it’s not going to get the business.”
Warren Buffet (CEO of Berkshire Hathaway) In the fast changing market which globalization and technology have created, it is more important than ever for companies to use Marketing to create value and develop Brands fully to their potential. A major marketing strategy which is attracting more and more companies is Ingredient Branding and the results are speaking for themselves (Desai and Keller, 2002). To better understand this strategy, first a deep look was given to Brand Equity, followed by an analysis of Branding and Co-Branding, ending with its analyzed variant, Ingredient Branding.
40 50 65 72 74 54 46 32 27 25 0 20 40 60 80 2013 2014 2015 2016 2017
18 2.1 Brand Equity
“Products are made in the factory, but Brands are created in the mind.”
Walter Landor (Acclaimed Brand Designer) First, it is important to understand what a Brand is. Farquhar (1989) defines it as “a name, symbol, design or mark that enhances the value of a product beyond its functional purpose”. Brand Equity, on the other hand, is a more complex concept. It is in truth one of the most discussed and studied topics in Marketing. From the several definitions scholars have used over time, some have a consumer based perspective, some a more financial approach, and others take both perspectives in consideration.
From all the definitions, the two core studies that are most relevant still to this day as they are the foundation of a vast set of empirical and conceptual studies on Brand Equity are those of Aaker (1991,1996) and Keller (1993). In this dissertation we will focus on the Model of the first and its four components on Brand Equity: Brand Awareness, Perceived Quality, Brand Loyalty and Brand Associations. Further definitions of Brand Equity and the explanation of each of these components can be found on Appendix I.
Favorable and robust Brand Equity gives Brands the openings to explore brand extensions, resilience and defense from other Brands and their promotions and campaigns as well creating barriers to competitive entry (Farquhar, 1989). Below, a more deep insight into the four components of Brand Equity as defined by Aaker (1991).
2.2 Branding & Co-Branding
“Marketing is no longer just about the stuff you make… It’s about the story you tell.” Seth Godin (Writer and Business Executive) After introducing Brand Equity, it is essential to understand how to develop it in such a complex and global market. One of the ways, which for many companies is the number one priority and has a major role in doing so is Branding (Kapferer, 2005; Burnaz et al.,2011). Focusing on Branding and working towards a solid and efficient Brand strategy is very important and when executed properly likely to be a success factor (Rooney, 1995) because it
19
has been found that Brands do indeed have a high influence in the consumers decision making process (Bendixen et al., 2004).
In a context of fierce competition, differentiation is key to achieve success. Branding gives companies the capacity to distinguish themselves from competitors, even more in markets with high competition and where the prices and tangible attributes of products do not differ greatly (Leuthesser et al. 2003). Branding efforts result in the creation of a long lasting intangible value and this added value derives from all the marketing investments that have been done over the years (Keller, 2009).
The natural evolution and expansion of Branding led to new strategies as for example Co-branding which has been defended and praised for increasing companies competitiveness (Kalafatis et al. 2012) and at the same time decreasing risk by partnering two or more Brands together (Leuthesser et al. 2003).
Definitions of Co-Branding are not consensual and this is a topic where there has been dispute. Two examples of the existing definitions are the one of Park et al. which back in 1996 introduced Co-Branding as the pairing of two or more products with their corresponding Brands having the goal of creating a product that is more unique and the one of Helmig et al which later in 2008 defined it in a more conceptual way as a strategy with a long-term focus, where two Brands ally together in order to create one branded product that is identified at the same time by two Brands. The common stand point among all definitions is the creation of a new product, originated from the gathering of two different Brands.
The most direct advantage of this strategy is that by advertising together a new bundled product it is achieved more value not only for the consumers but also for the companies (Leuthesser et al.,2003). This is a strategy that helps consumer’s evaluation of the product through the use of the past experiences with both Brands (Abratt et al., 2002).
One of the most cited studies of Co-Branding is the one of Park et al. (1996) whose research consisted of joining two Brands together, both fictional and both with high quality attributes, and arrived to the conclusion that just the combination itself of the two Brands resulted in an increase in the perceived attributes of each other, and the Product benefitted from the associations of both Brands, absorbing the high quality attributes.
One question that can come to mind is if the gathering of two Brands will make sense independently of the Brands chosen. Park et al. (1996) defended that a vital requirement for the
20
success of a co-branding strategy was the logical relation amongst the two Brands. However, Rao et al. (1999) found the opposite claiming that is it only relevant to a certain extent, not mandatory and that it is possible to see successful and recompensing co-branding strategies since the two Brands can gain value from each other’s attributes. In the study of the later, it was also found that in the presence of a co-branding strategy and a familiar Brand, the unknown Brand would see its quality perception increase significantly. With the mentioned outcome, the achieved conclusion is that Co-Branding should be seen as a win-win strategy since low equity brands will benefit from the association with a Brand with higher equity and, very important, the Brand with the higher value will not be harmed by the association with the lower value or unknown brand (Washburn et al., 2004).
2.3 Ingredient Branding
“Content is King.”
Bill Gates (Co-founder of Microsoft)
One variation of the mentioned co-branding strategy is Ingredient Branding, main focus of this dissertation. Ingredient branding is a strategy that has been for a long time in the market, in fact started being conceptualized in the late 80’s (Kotler et al., 2010) yet recently has seen its popularity rise. Desai et al. (2002) objectively defined it as “the incorporation of the key attributes of one brand into another brand as ingredients”.
2.3.1 Ingredient Branding Effects
Through this incorporation, the positive associations will pass into the host brand, also termed as the “spillover effect” (Simonin et al., 1998). The later researchers looked into the spillover effects on consumer brand attitudes originated by brand alliances and concluded that ingredient branding is a strategy able to modify the attributes of the partner brand.
Ingredient branding can also foment a relationship between the two Brands (typically a manufacturer and a supplier) that can create value in terms of knowledge sharing and risk management (Erevelles et al., 2008). The use of a branded ingredient or component facilitates the identification and builds a perception of high quality this way helping differentiate the final product (Desai et al., 2002).
21
One of the core concepts of Ingredient Branding strategy is the push & pull strategy (Kotler et al., 2010), since both marketing efforts are present at the same time.
Generally speaking, an ingredient branding strategy shares the following objectives: Firstly, to differentiate and create a preference in a specific target group for a specific product. Secondly, to develop loyalty and commitment towards the ingredient Brand. Thirdly, and the most important objective of ingredient branding: increasing sales and market penetration. If a manufacturer uses an ingredient branding strategy and manages to successfully improve its market position as it’s the goal and most times result of ingredient branding then it will be possible to charge a premium for the branded attribute and increase the value of both the company and the product (Kotler et al., 2010).
On the supplier level, there are additional advantages such as getting access to new markets, creating barriers for competitors, sharings costs and risks and acquiring new sources of revenues (Pfoertsch et al.,2011).
Ingredient brands are usually specialized in a specific product category improving the competence of the final product on that specific characteristic(Blacket et al., 1999) and provide a significant strategic advantage for the two involved Brands as the ingredient Brand is capable of increasing the perceived value by making a component that would possibly be invisible to the average consumer, visible and branded (Blacket et al., 1999).
Several studies have concluded on the benefits of this strategy (Erevelles et al. 2007; Rao et al., 1994; Park et al., 1996). Research found that high quality ingredient brands can improve host brand equity.
Keller (1993) found brand equity can be increased when the evaluation of a product with a branded component outperforms the same product without the branded component. Studies have concluded that this strategy is more beneficial for lower or middle quality competitors since the potential to gain value from the spillover effects of the high quality ingredient brands are higher. Despite this, it is equally relevant for high quality brands to consider ingredient branding in order to keep their competitive advantages over middle quality brands (Uggla et al., 2008). Also, Desai and Keller (2002) concluded that just the act of adding a branded ingredient could increase both the perceived value and usage of the host brands.
Further empirical studies investigated if following an ingredient branding strategy could influence consumer’s reactions, namely their attitudes, perceptions and behavioral intentions.
22
Concerning increasing the perception of quality of the products, one of the main objectives of ingredient branding, results validated the correlation since consumers claimed the ingredient brand made the final product look more reliable and valuable and passed positive associations towards the host brand. Additionally the perceived trust of the host brand also increased with the inclusion of the ingredient brand (Tiwari et al., 2012). The functional value quality perception of the products also was considered to be higher due to the branded ingredient (Vaidyanathan and Aggarwal, 2000).
In terms of attitudes, Desai and Keller (2002) found that when facing an ingredient branding scenario, consumer attitudes showed more favorable comparing to a scenario with a self-brand. In the same line, spillover effects also showed to be present. An example of this is it was found that depending on how the consumer evaluates the brands and the consequent attitudes they generate will pass to the brands in the partnership (Desai et al., 2002). One important theory not yet mentioned but part of the ingredient branding scenario is the “informational integration theory”. Basically, it describes “the process in which two stimuli, or in this case brands, are combined to form consumers’ attitudes toward a product” (Luczak et al., 2007).
Additionally, ingredient branding can also impact behavioral intentions as for instance Willingness to pay. In 2010 Kotler suggested that ingredient branding would make consumers be willing to pay a higher price. An example, was a study which concluded that 67% of the respondents would pay more to have their garments made with Lycra fabric, since they associated quality and value to the component. In the same way, also the purchase intention was found to be higher. A similar study also concluded that the purchase intention of a middle quality brand rose significantly after the inclusion of a branded ingredient and the reservation prices of consumers for a product were higher in the scenario with ingredient branding (McCarthy et al., 1999). Lastly, it is also relevant to refer that it was found that using a high quality ingredient brand implicitly increases the performance expectations from the consumers (Luczak et al., 2007).
Parallel to these studies, the use of ingredient branding in the smartphone industry could achieve similar benefic results with even deeper repercussions.
23
2.3.2 Ingredient Branding Examples
An ingredient brand strategy can be communicated and executed in different ways, such as the use of the logo (whether on the box, the product or the point of sale display) or the promotion in online advertising and communication channels of the inclusion of the Ingredient Brand in the Host Brand. A quick reflection or browse over some products will be sufficient to find several examples.
Intel, Dolby, Bosch, Gore-Text have been some of the most iconic ingredient branding examples over the years (Kotler et al., 2006).
However, Ingredient Branding is present in a vast set of products from cars (Bose Speakers in Audis or BMW Engines in Rolls-Royce cars), to food (Milka chocolate with Oreo/Daim or McFlurries in McDonalds with Maltesers), clothing (North Face jackets with Gore-Tex or Timberland shoes with Vibram technology), house hold goods (Tide with Febreze), consumer electronics (Toshiba computers with Intel processors or Huawei’s smartphones with Leica’s cameras) and many more cases.
Electronic devices are one of the sectors where this strategy is more evidenced. Just by looking at computers it is possible to see a set of branded ingredients, from the motherboard, to the CPU, the monitor and so on.
2.3.3 Ingredient Branding Precautions
Several studies that highlight the advantages of Ingredient Branding have been mentioned. However, it is important to consider also the necessary precautions and requirements for a successful strategy. Before manufacturers consider or accept an ingredient branding strategy they must first reflect on whether the component will increase value and if so, if this value is expected to be more significant than the cost of the investment. There is a high chance that the ingredient brand will be exposed and play a significant role in the final product. Due to this, the host brand should ensure both brands objectives are aligned and correlated in order that there’s a rise in sales and benefits both sides (Blackett et al., 1999).
24
Another important aspect to consider is the competitive landscape. If competition is adopting ingredient branding strategies then it might be especially relevant to do the same.
One big risk is that the ingredient brand can overshadow the host brand or carry more importance in the decision making process than the host brand. It is important to analyze and study how the relationship will evolve. Ideally, there should be an initial long term alignment so that the potential of the alliance is reached (Blackett et al., 1999). With this said, manufacturers should be selective and consider only brands that are central to leveraging the host brand.
Lastly, one big danger of the strategy is that the consumers already have in their minds negative associations towards the ingredient brand and will pass them to the host brand or the match between the products together harms both products (Desai et al., 2002).
3. FACTORS AFFECTING SMARTPHONE PURCHASE INTENTION
To understand Purchase Intention it is necessary to comprehend what is responsible and capable of influencing consumer’s decisions. Several variables collected from previous Purchase Intention Models and studies with the potential to influence smartphone purchase intention are examined in this section.
3.1 Purchase Intention
“You have to want it enough to buy it.”
Lailah Akita (Inspirational Writer)
Purchase Intention is introduced by Dodds et al. (1991) as the possibility and will of consumers to buy a product. It is therefore uncertain and subjective, as it focus on future behavior. Engel et al. (2001) went further and classified it as a key indicator of what will be the real purchase behavior. In what concerns smartphone purchase intention, Factors that have been considered in previous literature will be presented and detailed next.
25
Studies have also shown that Ingredient Branding positively influences Purchase Intention (Rodrigue et al., 2004). An example is the study conducted by the same mentioned authors where Doritos with and without Kraft cheese were compared. Purchase Intention increased significantly in the second scenario.
3.2 Functional Value
“Great companies are built on great products.”
Elon Musk (CEO of Tesla) Sheth et al. (1991) define Functional Value as “the perceived utility acquired from an alternative’s capacity for functional, utilitarian, or physical performance”. He further stated that the way to increase functional value is by enhancing and improving utilitarian, functional or physical attributes and the best way the measure this value is by a "profile of choice attributes”. This is a particularly relevant Value as it has long been considered as the main driver of consumer choice, from the early economic utility theory presented by Marshall (1890) and Stigler (1950) to the more recent definition of functional value as the characteristics and attributes, such as reliability, price, durability and others (Ferber, 1973). An example provided by Sheth to illustrate the scope of attributes in functional value is the purchase of a car. Two functional attributes that are important are the consumption and the average maintenance cost. Technology wise, functional value is the belief that the performance in one’s daily life will improve derived from the specific improvement by technology (Davis, 1989).
Vigneron and Johnson (2004) introduced functional value as the attributes that differentiate products from competition, ranging from consumer perceived superiority, ability to function or perform at a higher level, or underlying craftsmanship. It is a concept that shadows economic utility theory and is related with rationalism as consumer decisions will be based on the attributes of the products and services and the extent to which they match and satisfy needs.
3.3 Emotional Value
26
Howard Schultz (CEO of Starbucks) Sheth et al. (1991) define Emotional value as “the perceived utility from an alternative’s capacity to arouse feelings or affective states”. This value creates value for alternatives through the generation of specific feelings and is usually measured based on a “profile of feelings associated with the alternative”.
Humans are constantly evidencing emotions and it is normal that often products and services are associated with emotional responses. Emotional value is associated with different affective states, whether positive such as excitement and confidence, whether negative such as anger and fear (Fernández and Bonillo, 2007). Although it is more common to associate emotional value with aesthetic, art, beauty or nature and cases such as sports associations, religion and others it also exists in more utilitarian scenarios and products (Sheth et al., 1991). For instance, when buying a book made with 100% recycled paper or buying a product that reminds family and friends. A more extreme example but accurate, is the so-called “love affairs” that some people have with their cars.
Noncognitive and unconscious motives reveal themselves determinant in some purchases (Dichter, 1947) and research in advertising showed that an objective of promotions and marketing is to make the consumer feel certain emotions so that it associates them later with the product or service (Kotler, 1974; Park and Young 1986).
3.4 Social Value
“Your brand is what other people say about you when you’re not in the room.”
Jeff Bezos (Founder of Amazon) Sheth et al. (1991) defines Social value as “the perceived utility acquired from an alternative’s association with one or more specific social groups”. Whether it is a demographic, socioeconomic, ethnic or cultural group, positive and negative stereotypes add or take value from different alternatives. Therefore, the most suitable way of measuring this Social value is on a “profile of choice imagery”. This value is especially relevant in highly visible products, such as jewelry or clothing and in products and services that are shared or used in group contexts, such as gifts, products used for entertainment and others. Social value influences other
27
products though. Even more utilitarian and functional products such as mobile devices, kitchen appliances and others are often preferred based on social value.
Back in 1942, Hyman, a pioneer in the research of reference groups, stated that the way people react and purchase goods is influenced by belonging to a specific group.
Another useful insight from Rogers (1962) and Robertson (1967) who studied opinion leadership and diffusion of innovations is that social values are important and influence when buying a product or service and that indeed this is originated by the way information is differently processed and communication interpreted considering different social values.
Firat et al. (1993) approached social value with a slightly different perspective. His idea is that the act of consumption of products and services can itself be a social act where individuals express themselves and their identity, therefore highly valuing symbolic meanings, social codes and relationships, reflected in the social value. On the same line, Kotler and Armstrong (2010) stated that consumers are influenced by their groups, friends, parents, social role or even status. In conclusion, social value comes from the symbolic relevance of a product or service.
Bodker et al. (2011) defends that a considerable amount of people purchases their smartphones with the objective of gaining acceptance from a social group.
3.5 Trust
“A Brand is simply trust”
Steve Jobs (Former Apple CEO) Hiscock in 2001 claimed “…the ultimate goal of marketing is to generate an intense bond between the consumer and the brand, and the main ingredient of this bond is trust”. Looking at the current most valuable Brands gives support to this statement as generally speaking the majority of these Brands gives high importance to building Trust with their consumers.
In a more humanized approach, Trust is one’s generalized expectation in the promise of another and its reliability. In other words, it is the expected match between what people or associations say, and what they actually do or is true. (Rotter, 1967; McAllister, 1995).
28
Similarly, in 1997 Saunders introduced Trust as the ‘‘confidence that the behavior of another will conform to one’s expectations and in the goodwill of another’’.
Consumers consider Brand Trust as expectancy, grounding their assessment of a Brand with specific qualities such as competency, durability, honesty, sustainability, and others, in line with the previous research on Trust (Andaleeb, 1992; Doney and Cannon, 1997; Larzelere and Huston, 1980; Uggla, and Filipsson, 2008). Following the same standpoint, Chaudhuri and Holbrook (2001) narrowed their definition focusing on the brand promise and the judgement of consumers. Basically, whether the majority of people believe and are willing to rely on the brand promise, in the ability of the brand to perform what it promises with its products or services.
Brand trust has an enormous potential as a mediator, enabling Brands to transfer direct and indirect involvements and past evaluations to the next contact and purchase decision and can therefore be a critical and important way to engage in fruitful agency-client relationships (Labahn and Kohli, 1997).
3.6 Brand Image
“A brand is a reason to choose.”
Cheryl Burgess (CEO of Blue Focus Marketing) Brand Image is the opinion consumers have of a Brand, the views and associations, which pass to its products and services. As soon as consumers are exposed to a Brand they start creating understandings, beliefs and perceptions that will be pointed towards the Brand. All in all, Brand Image is the overall impression of a Brand in the consumers’ minds (Daye et al., 2007).
Many scholars have stressed the relevance of Brand Image. In a highly competitive market, Brand Image is a privileged path to create identity and exclusivity towards a product or service. Brand Image creates value in a vast amount of ways such as: generating positive feelings, supporting the processing of information, highlighting a Brand, creating new motives for purchase and more (Aaker, 1991). Keller (1993) defined Brand Image as “perceptions about a brand as reflected by the brand associations held in consumer memory”. Other scholars such as Newman (1957), Dichter (1985), Aaker (1991); Engel et al. (1995) have definitions in line
29
with the ones presented. Dodds et al. (1991) highlights one of the main aspects of Brand Image, which is that it goes beyond functional attributes to actually consider symbolic features. Feelings and expectations.
On a different perspective, of the consumer, Chu and Keh (2006) state that the Brand affects positively the behavior of consumers, in which is included purchase intention. This is in line with the conclusions of Norazah (2013), that Brand has significant impact on smartphone purchase intention.
Brand Image allows Brands to reach consumers and move them towards wanting that specific Brand. Lin et al (2011) reached the conclusion that more positive Brand Image is directly associated to increased purchase intention. Another conclusion reached by Hwa et al. (2011) is that consumers have preference towards buying Branded products or services. The reason for this is that knowing Brands makes the decision process easier for consumers and assures a known level of quality. Following those conclusions, Hwa states that when considering Smartphones the Brand has a positive relation with purchase intention among the studied population (students).
3.7 Willingness to Pay
“If you pay peanuts, you get monkeys.”
James Goldsmith (French Ex-Politician) Willingness to pay is a commonly used and tested concept. The definition, widely accepted among scholars, is “the maximum price a given consumer accepts to pay for a product or service” (Gall-Ely, 2009). In other words, the optimal pricing for a product or service that can be asked to the consumers (Masiero et al., 2015). Comparing the willingness to pay in two scenarios it is possible, after the measure of the differences, to reach the Price Premium.
The concept of Willingness to Pay started appearing in the Economics literature already over 100 years ago (Davenport, 1902) and it has grown to be vastly adopted in Marketing Literature in order to evaluate consumer reactions to prices. The reason behind this is that considering the price perception process, Willingness to pay is on one hand proximate to price judgments, such as the acceptable price and the reference price, and on the other hand connected
30
to variables that are important and essential when considering decision making, such as satisfaction, loyalty or even culture. (Gall-Ely, 2009).
Two price concepts important to distinguish are Willingness to pay and Value. As already mentioned, the first focus on the maximum monetary sacrifice that a consumer is willing to spend to get all the benefits associated with the product or service, the second, according to Aurier et. Al. (2004), is about the “evaluation of experiences with an object or class of objects (usage value), based on all the sacrifices and benefits associated with it (exchange value)”. In terms of the approach to judge them, both are periodic estimations but willingness to pay focus on the acquisition moment and its utility and value focus more on the evaluation after the consumption (Gall-Ely, 2009).
3 METHODOLOGY
1. Research Approach and Design
According to Saunders et al. (2009) there are three main types of Research which are the most recurrent, namely Exploratory, Descriptive and Explanatory Research, described in detail in Appendix III.
In this research, the three methods were applied, with the objective of reducing uncertainty and enriching the study, which focus on a vast and fast changing market in Portugal, the smartphone market. To conduct these researches several methods were used, in the order that follows: Literature Review, In-Depth Interviews and Online Survey.
Online Survey (Quantitative Primary Data - I) In-Depth Interviews (Qualitative Primary Data - I) Literature Review (Qualitative Secondary Data - I) Exploratory Research
Exploratory and Descriptive Research
Descriptive and Explanatory Research
31
1.1. Literature Review: Exploratory Research
The first step of the analysis was the Literature review, which according to Saunders et al. (2009) supports and helps the conception of the research goals while at the same time providing a critical review on the referred matter.
There are three chapters in the Literature Review which summarize the main topics:
1. Smartphones: Information about the creation and current state of the
smartphone market both globally and in Portugal. Additionally, a complement on the Literature was performed with an Internet Review.
2. Ingredient Branding: An overview over some of the most acclaimed
literature starting on Brand Equity, core concept of Branding to Co-Branding and culminating on Ingredient Branding.
3. Factors affecting Smartphone Purchase Intention: From the existing
literature, where Smartphone Purchase Intention is heavily reviewed, a set of Factors, that were more recurrent in most Frameworks and previous studies, were selected and analyzed in detail. This part ends with the presentation of a Conceptual Framework that was elaborated and is going to be used and tested in this study, aiming to answers the Research Questions.
Articles and data from respected and top Journals were given priority especially at an initial phase being complemented with additional online publications from scholars.
Internet Review: Due to the lack of actual information on what concerns recent
smartphones, natural to its recent and fast paced evolution, a small complement on the Literature Review took place, namely an online analysis of some of the most acclaimed online newspapers and technology blogs which can be seen in Appendix II.
This examination named “What the Internet is saying” had the goal to see what technology and smartphone experts are saying and what consumers are, right now, requiring on a smartphone.
1.2. In-Depth Interviews: Exploratory and Descriptive Research
The next step taken was to conduct some In-Depth Interviews. According to Saunders et al. (2009), when aiming for exploratory research, these interviews in particular have the potential to be extremely helpful in finding what is happening and reaching new insights that
32
were not yet considered or identified yet might be very relevant. Five In-Depth Interviews took place.
The selection of the interviewees was well thought and with criteria, in order to cover the scenarios that were going to be studied in the following quantitative part of the study. It was assured there was at least one interviewee for each of the different scenarios going to be considered, namely Characteristic Preference (Camera, Processor and Design), Willingness to Spend (up to 200€, between 200€ and 400€ and over 400€) as well as different operating systems, smartphones owned, age and professional background.
The interviews, whose complete guidelines and insights can be found on Appendix IV, comprised four main parts: 1) Profile Definition (Individual and Smartphone User Profile); 2) Buying Process; 3) Smartphone Features Desired and Requirements 4) Ingredient Branding Strategy and discussion of examples.
1.3. Online Survey – Descriptive and Explanatory Research
Lastly, the third and final analysis consisted of an online Survey on the survey platform Qualtrics. This tool allowed to reach a vast amount of people from different locations in Portugal and collect answers relatively fast. However, there are some limitations associated to it, namely that it is not possible to guarantee that respondents are concentrated and answering honestly and also that representativeness of the population is not assured (Malhotra, 2006). Below, additional information on the survey:
1.3.1. Population and Sample of the Study
The Population of the Research in this dissertation includes every Portuguese, with no concern of age, income or gender, only excluding non-smartphone users that were not considered fit to answer the survey properly.
The Sample of the Study consists of the elements of the population chosen and elected to participate in the study. According to Saunders et al. (2009) considering a population of 10 Million (approximately the population of Portugal) and a confidence level of 95% the recommended sample size is close to 384 participants. The number of Smartphone Users in Portugal is inferior to the total population. However, especially considering a non-probabilistic convenience sample, this was the objective in mind.
33
1.3.2. Construction of the Survey
An online and self-managed survey, distributed through Qualtrics was the chosen data collection method. It is a user-friendly platform which allows, free of cost, to create a survey that can then be easily shared and spread over one’s networks.
Malhotra (2006) recommends pre-testing surveys so that immediate problems and difficulties can be identified and corrected. Several individuals were asked to fill the survey and provide a critical review of it in the end. From these reviews, where mostly some questions that were not completely clear were identified, several corrections aroused. Only after these corrections the survey was launched and shared over social networks such as LinkedIn and Facebook as well as e-mail and Whatsapp.
NOTE: In the survey there were 15 different Paths. Depending on the respondents
answer on three initial Conditions, a specific Path was chosen and presented. A detailed explanation of the Composition of the Survey can be seen on Appendix V as well as the representation of the 15 and one example.
1.3.3. The Measures
Previously the evaluation of a Smartphone in two different scenarios was mentioned. This evaluation comprised different constructs which were all based and extracted from identical constructs that have been developed and utilized in previous studies and literature. While some were replicated, for others it was necessary to adapt them in order to fit the study. The measures used can be consulted on Appendix VI.
2. Conceptual Model
To help research, it is useful to link together the variables that were identified as relevant (based on the previous analysis of literature and qualitative research) and represent them in a logic that helps answering the problem being studied (Sekaran et al., 2009). Therefore, a Conceptual Model was created to help conduct this study.
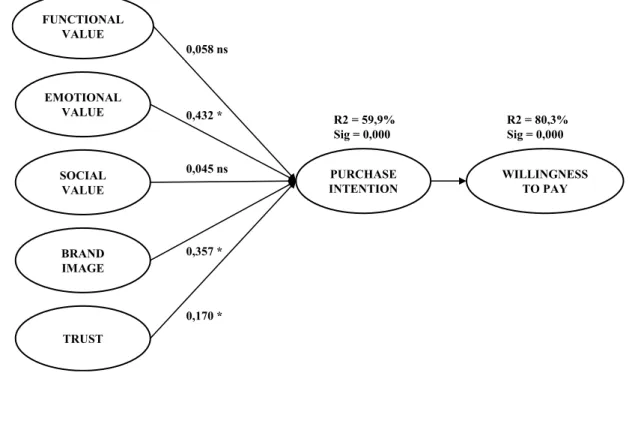
34 Figure 2 – Conceptual Model created for Dissertation
The examination of previous Literature culminated in the Conceptual Model above. Together with the initial Research Questions, specific Hypotheses are created and represented in the Model and detailed below.
RQ1: Which Smartphone Features/Characteristics are consumers valuing at the
moment?
RQ2: Which Factors influence purchase intention of Smartphones?
H2a: Functional Value positively influences purchase intention of Smartphones. H2b: Emotional Value positively influences purchase intention of Smartphones. H2c: Social Value positively influences purchase intention of Smartphones. H2d: Brand Image positively influences purchase intention of Smartphones. H2e: Trust positively influences purchase intention of Smartphones.
RQ3: Does Purchase Intention influence willingness to Pay?
H3: Purchase Intention positively influences willingness to pay for a smartphone. EMOTIONAL VALUE SOCIAL VALUE BRAND IMAGE TRUST FUNCTIONAL VALUE PURCHASE INTENTION WILLINGNESS TO PAY INGREDIENT BRANDING H2a H2b H2c H2d H2e H4a H3 H4b H4c H4d H4e H4f H5
35
RQ4: Does Ingredient Branding enhance the evaluations of the Factors that influence
Purchase Intention as well as Purchase Intention?
H4a: Functional Value is positively influenced by the Ingredient Branding Strategy. H4b: Emotional Value is positively influenced by the Ingredient Branding Strategy. H4c: Social Value is positively influenced by the Ingredient Branding Strategy. H4d: Brand Image is positively influenced by the Ingredient Branding Strategy. H4e: Trust is positively influenced by the Ingredient Branding Strategy.
H4f: Purchase Intention is positively influenced by the Ingredient Branding Strategy.
RQ5: Does Ingredient Branding increase Willingness to Pay for a smartphone?
H5: Ingredient Branding positively influences consumers’ Willingness to Pay.
The main goal of this Model is to evaluate and confirm the relation between the selected Factors and Purchase Intention, and then between Purchase Intention and Willingness to Pay for a Smartphone. It is a representation of previous studies, with Factors that have been shown to influence Smartphone Purchase Intention and if proven valid will be important in order to address the Problem Statement.
4. RESULT ANALYSIS 4.1. Literature Review
From the Internet Review, introduced in point 1.5, two main insights were taken in special consideration for the preparation of the following Survey, namely:
Main Insight 1 – Minimum Current Requirements: Smartphones are way more
evolved than they used to be and consumers are aware of that. There were several articles that determined that consumers are not settling for some lower characteristics. Consequently, special attention was given to the chosen Characteristics presented in the survey so that the respondent would not feel that the Smartphone did not have the minimum necessary characteristics. Also, the respondent was explicitly told to consider that, considering the remaining non presented characteristics, the smartphone had all the features that were expected from a smartphone of that Price.
36
Main Insight 2 – Valued Features: One surprising conclusion of this information
collection was that consumers are starting to value significantly new features such as Fingerprint Scanner, Dual-Camera, Battery Duration, Dual-SIM among others. Brands should be careful not to stay behind. Despite this, this study confirmed that the Camera, Processor and Design are constantly referred as in the most important features of a Smartphone, validating its choice for this study.
4.2. Qualitative Research 4.2.1. In Depth Interviews
Five In-Depth Interviews were conducted with the criteria mentioned in the Methodology. Insights from these interviews can be consulted on Appendix IV. However, below are evidenced the three most relevant insights that were not yet being taken in consideration and resulted in an adaptation of the study.
Main Insight 1 – The high loyalty and appreciation of APPLE: Two of the
interviews were with iOS users and it was clear their strong preference and desire to continue using APPLE. Margarida Tomé stated “If I cannot see myself being more happy with a phone than I am now, why would I change?”, Gonçalo Simões that “Since I got my first IPhone I did not want anything else.”. These are examples of the insight that led to a change in the plan of the survey. Initially, the plan was for all respondents to be shown two Samsung smartphones in the survey. However, due to the mentioned it was decided to incorporate two versions in terms of Brand in the survey. Respondents who said they wanted a smartphone from APPLE as their next smartphone were shown iPhones instead.
Main Insight 2 - Evidence of the Ingredient Brand on the Product: Gonçalo Simões
defended that in his opinion a turning point towards the success of such a strategy would be whether the ingredient Brand was visible or not on the Final Product. Consequently, since the goal was to maximize the efficiency of the strategy, the logos of Canon and Intel were visible on the back of the products and the Design Armani people were told to assume that they were satisfied with the design and it felt exclusive.
Main Insight 3 - Difficulty on evaluating different Price Segments: In the discussion
part, in the end, interviewees were asked if they thought the Strategy would be more efficient in smartphones of different price segments and the difficulty in positioning themselves in those scenarios was clear. In fact, Diogo Dias even claimed “I do now know because I would never
37
pay more than 150€ for a smartphone” and Fernanda Rodrigues defended “Would my opinion on this be reliable? I only know how I will react in my case”. Consequently, it was decided that respondents were going to be shown only phones of their previously chosen price range.
4.3. Quantitative Research 4.3.1. Preliminary Analysis
The survey conducted gathered a total amount of 352 responses and was live from late November to early December of 2018. In the survey there were four control questions in order to detect and select only honest respondents. From the total responses mentioned, three sets of responses were excluded from the analysis, namely:
1. Non-smartphone users (respondents that in the first question claimed they were not smartphone users had their survey terminated at that point);
2. Respondents who did not pass the control questions; 3. Respondents who did not finish the survey.
In the end, 240 responses were eligible for the analysis and the basis of this dissertation, which were analyzed with the statistical software IBM SPSS Statistics 22.
4.3.2. Sample Characterization
It is important to characterize the respondents in this Sample and get some information about the people who are behind this study. To do so, a range of socio-demographic questions were asked.
In terms of gender, from the 240 respondents, 57,1% are women and 42,9% are men. The majority is aged between [18 to 24] (57,5%), followed by [25 to 34] with 30,8% and [45 to 54] with 8,3%. In what concerns occupation the vast majority, 72,6%, is currently employed followed by students, 22,9%. Regarding education, 49,6% have obtained a Masters Degree, 45,4% a Bachelors degree and the remaining 5% a high school diploma or equivalent. Considering monthly net income, the intervals more represented are between [400€ and 800€[ (30,8%) and between [800€ and 1200€] with 22,9%.
Shifting the approach now to the smartphone profiles of the respondents, most users are actually satisfied with their current smartphones 47,1% stated they are satisfied and 43,3% that they are very satisfied. When asked what Brand they had and later which brand they are most
38
likely to purchase it was possible to see that 43,8% actually want to keep the same Brand and the remaining 56,3% want to change.
In line with the stated, 9,2% of respondents stated they would consider only buying their desired Brand, 66,9% that they would look up to the market but have a preference for the desired Brand and only 24,3% have no preference and will evaluate the different alternatives in the market.
Above, a comparison between the currently owned and most desired Brands (considering next purchase).
The Rank order stays the same yet there is a slight decrease among most Brands. The exceptions are APPLE and XIAOMI, with the later showing the biggest gap (4%).
The three pie charts above reflect respondents intention towards next purchase, namely between acquiring a smartphone from a Retail Store vs Online Store and also how important are others in this process.
Rank TOP 5 OWNED BRANDS TOP 5 DESIRED BRANDS Dif:
Brand % Brand %
1 APPLE 30% APPLE 31% 1%
2 HUAWEI 25% HUAWEI 23% -2%
3 SAMSUNG 23% SAMSUNG 22% -1%
4 XIAOMI 7% XIAOMI 12% 4%
5 ONE PLUS 5% ONE PLUS 5% 0%
- OTHERS 9% OTHERS 7% -2% 28% 36% 18% 13% 5%
Likelihood of buying next Phone from a Retail Store
Extremely likely Somewhat likely Neither likely nor unlikely Somewhat unlikely Extremely unlikely
15%
22%
18% 24%
21%
Likelihood of buying next Phone from an Online Store
12%
49% 22%
13%
3%
Likelihood of being influenced by recommendations of Others