Cryogel composites for cadmium removal:
evaluating combinations and adsorption by
molecularly imprinted polymers
Master thesis
developed in the course of
Dissertation
Mariana Sofia Nogueira Duarte
Department of Chemical
Engineering
Department of Biotechnology
Examiner: Bo Mattiasson Supervisor: Harald Kirsebom
Co-supervisor: Linda Önnby
Acknowledgments
I would like to express my gratitude to those who contributed for my success during my stay in Lund while developing this Master thesis:
Lund University, my supervisors Linda Önnby and Harald Kirsebom and my examiner Bo Mattiasson, for giving me the opportunity of developing this project in the Biotechnology department and for their help and teaching.
All the people in the Biotechnology department, for the good work environment and the amusing times spent during lunch time and coffee breaks.
Mafalda Madureira, for having me in her house in Lund and for being always so nice to me, helping me with everything I needed and giving me a lot of support. Thank you for all the good moments.
The friends I made in Lund, whom I spent unforgettable moments with, it was a pleasure getting to know you.
My family and my friends in Portugal, thank you for your constant support and motivation.
Abstract
Waste water contamination is a major concern regarding environmental and human health issues. Heavy metals play a dangerous role, given that they are very toxic even at low concentrations. Cadmium carries toxicity to living organisms in the range of 0.001-1 mg/l. The presence of these pollutants is an issue concerning the difficulty in removing heavy metals present in waste streams at trace concentrations with feasible cost. In this study, combinations of a non-expensive cadmium selective (molecularly imprinted) chelating resin and polymeric matrices obtained by cryogelation were produced and investigated in order to confirm their potential to remove cadmium from water at low concentration (0-10 mg/l).
Adsorbent materials based on cryogel composites of poly vinyl alcohol and chitosan embedded with molecularly imprinted polymer (MIP) particles showed up to 90% of Cd removal from a solution of initial cadmium concentration of 10 mg/l at pH 5.
The matrices behaved as highly hygroscopic materials, showing swelling ratios up to 70% and proved to have large pores (> 100 µm).
Adsorption on the studied MIPs seems to follow a second order kinetic behaviour with a rate constant of 0.085 g mg-1 min-1, an initial uptake rate of 0.145 mg g-1 min-1 and a
maximum adsorption capacity in this range of concentrations of approximately 9 mg/g. However, further experimental data and statistical analyses are required to confirm these values.
This study showed promising results regarding the removal of cadmium in water. Yet, further investigation is necessary to validate the suitability of the material for the process. Furthermore, a deeper knowledge of the mechanisms behind the process of adsorption by molecularly imprinted polymers would be of much help in order to improve their specific characteristics and thus their sorption behaviour.
Keywords: heavy metals, cadmium, wastewater treatment, adsorption, molecularly imprinted polymers, cryogels
Declaration
The author declares, under oath, that this work is original and that all non-original contributions were properly referenced with identification of the source.
Table of contents
Table of contents ... i Notation ... iii Figures ... iv Tables ... v 1 Introduction ... 1 1.1 Project presentation ... 11.2 Heavy metals: environmental and human health issues... 2
1.2.1 Existing methods for heavy metals treatment ...4
1.2.2 Cadmium: physical properties and applications ...5
1.3 Molecularly Imprinted Polymers (MIPs) ... 6
1.4 Cryogels ... 8
2 Materials and methods ... 11
2.1 Materials ... 11
2.2 Cadmium molecularly imprinted polymers (MIPs) ... 11
2.2.1 Synthesis of MIPs ... 11
2.2.2 Material characteristics ... 12
2.3 Gels and composites ... 13
2.3.1 Preparation of chitosan composites and plain gels ... 13
2.3.2 Preparation of poly vinyl alcohol composites and plain gels ... 14
2.3.3 Material characteristics ... 14
2.3.4 Scanning electron microscope images ... 15
2.4 Adsorption studies ... 15
2.4.1 Preparation of cadmium solutions ... 16
2.4.2 pH dependence ... 17
2.4.3 Kinetic study ... 17
3 Results and discussion ... 21
3.1 Characterization of cadmium molecularly imprinted polymers (MIPs) ... 21
3.1.1 FTIR spectra ... 22
3.1.2 Particle size and polymerization yield ... 23
3.2 Characterization of gels and composites ... 24
3.3 Adsorption study ... 27 3.3.1 pH dependence ... 27 3.3.2 Kinetic study ... 28 3.3.3 Capacity determination ... 32 4 Conclusions... 37 5 Project evaluation ... 39 5.1 Objectives achieved ... 39
5.2 Limitations and future work ... 39
6 References ... 41
7 Appendix A: Kinetic modelling of Cd adsorption in MIP1 ... 45
Notation
Volume Mass Time Particle diameter Molecular weightConcentration of the adsorbate in the solid phase at time t Concentration of the adsorbate in the solid phase at equilibrium Maximum adsorption capacity of the monolayer
Figures
Figure 1 Cadmium metal in solid state. ...5
Figure 2 Basic principle of non-covalent molecular imprinting (Christine Widstrand, 2006). ...7
Figure 3 Chemical structures of chitosan (left) and PVA (right). ...9
Figure 4 Chemical structure of glutaraldehyde. ...9
Figure 5 FTIR spectroscope used for analyses. ... 13
Figure 6 Batch adsorption experiments: particles in free suspension in batch adsorption on a rocking table (left) and PVA cryogel in batch adsorption (right). ... 15
Figure 7 Atomic absorption spectrophotometer used for analyses. ... 16
Figure 8 FTIR spectra of MIP1 and MIP2. ... 22
Figure 9 MIP particles: MIP2 (left) and MIP1 (right). ... 24
Figure 10 Chitosan (left) and PVA (right) cryogels. ... 24
Figure 11 SEM images of chitosan-MIP composite. ... 25
Figure 12 SEM images of PVA-MIP composite. ... 25
Figure 13 Removal of cadmium by both composites at different pH values. ... 27
Figure 14 Cadmium uptake by MIP1 particles in free suspension and in chitosan and PVA matrices at different time points. ... 28
Figure 15 Linearization of the kinetic behaviour of adsorption of cadmium on chitosan-MIP (left) and PVA-MIP (right) cryogels by the first-order Lagergren equation. ... 29
Figure 16 Linearization of the kinetic behaviour of adsorption of cadmium on MIP1 in free suspension by the second order rate equation. ... 30
Figure 17 Cadmium uptake by PVA and chitosan cryogels and MIP2 particles in free suspension at different time points. ... 31
Figure 18 Adsorption isotherm for Cd in MIP1. ... 32
Figure 19 Adsorption isotherm for Cd in MIP1 (lower range of concentrations). ... 33
Figure 20 Linear fitting of the data values present in Figure 19 by the Langmuir model. ... 34
Figure 21 Comparison between experimental data and Langmuir model for low Cd concentrations. .. 35
Figure 22 Linear fitting of the kinetic data relative to MIP1 in free suspension to the intraparticle diffusion models: Urano and Tachikawa’s (left) and Weber and Morris (right). ... 45
Tables
Table 1 Heavy metals in industrial effluents: adapted from (Volesky et al., 1999). ...2
Table 2 Concentration limits of heavy metals in water: adapted from (EPA, 2009) ...3
Table 3 Advantages and disadvantages of heavy metals treatment methods: adapted from (Vieira, 2009). ...4
Table 4 Physical properties of cadmium: adapted from (Lenntech, 2012). ...5
Table 5 Reagents used for the preparation of cadmium molecularly imprinted polymers (MIP2). ... 12
Table 6 Summary of experiments presented in R&D section. ... 16
Table 7 Particle size distribution: results of sieving test. ... 23
Table 8 Physical properties of cryogel-MIP composites. ... 26
Table 9 Variation of pH during the pH screening test on PVA-MIP cryogel. ... 28
Table 10 Kinetic parameters of Cd adsorption in MIP1 and cryogel-MIP composites. ... 30
Table 11 Langmuir parameters for adsorption equilibrium at low concentrations. ... 34
Table 12 Constant parameters obtained from the linear regression equations present in Figure 23. .. 48
Table 13 Values of initial and equilibrium concentration in the liquid and solid phase for Cd adsorption in MIP1. ... 48
Table 14 Values of initial and equilibrium concentration in the liquid and solid phase for Cd adsorption in MIP1 (low concentrations range). ... 48
1 Introduction
Water has always been an essential element for life on Earth. However, at a certain point in the history of humankind, it also became an essential utility for all industrial activities. Regardless of non-anthropogenic sources of contaminants, water pollution from waste streams is both an environmental and a human health threat. Fortunately, a civic consciousness towards the environment has been built and led to the creation of regulations concerning the effluents that are discharged into water courses. In response to these stricter rules, the development of new methods and materials for water purification gains more and more room to grow.
1.1 Project presentation
This project enrolls the issue of water contamination, focused on heavy metals removal. Among these, cadmium represents one of the most toxic compounds. When present at trace concentration, available technologies are either inefficient or can be implemented at a very high cost. Therefore, the development of new adsorbent materials able to remove cadmium at low concentrations seems opportune.
Many authors have been focusing on the use of biosorbents (Adamis et al., 2003, Aksu, 2001, Benguella, 2002, Davis et al., 2000, Freitas et al., 2008, Ibrahim et al., 2006, Malik, 2004, Vilar et al., 2008, Volesky et al., 1993) which usually offer a cheap option. Biosorption is defined as the accumulation of pollutants onto biological materials and is appointed as a very suitable alternative for treating high volumes of low concentration wastewaters (Freitas et al., 2008). Materials such as bark (Blazquez et al., 2011, Reddy et al., 2011, Tofan et al., 2012), marine algae (Freitas et al., 2008, Ofer et al., 2003, Vilar et al., 2008), chitosan (Liu et al., 2011), chitin (Benguella, 2002), sargassum (Davis et al., 2000) and microorganisms (Adamis et al., 2003, Volesky et al., 1993, Volesky and Mayphillips, 1995) are among a long list of biological materials used in the removal of heavy metals. The most common biosorption mechanisms are ion exchange, adsorption, chelation and ion entrapment in the polysaccharide structure of cell walls (Volesky and Mayphillips, 1995, Davis et al., 2000). Nevertheless, the process of biosorption of metals is based on several mechanisms, often hard to predict, that depend on the type of biomass, on its origin and also on the processing that it is submitted to (Davis et al., 2000, Vilar et al., 2010).
On the other hand, chelating and ion-exchange resins are well known and often cheap materials (Mueller, 2011). In this project, a cadmium selective polymeric resin is studied.
Furthermore, the combination of this material with a biopolymer is assessed. The fields of molecularly imprinting technology and cryogelation are the routes to obtain the designed adsorbent.
The purpose and objective of this study is to produce a composite material which will have potential to adsorb cadmium in water. The aim here is to produce a cryogel with high macroporosity incorporated with molecularly imprinted particles in a homogenous way.
1.2 Heavy metals: environmental and human health issues
Heavy metals are often described as chemical elements of density higher than 5 g/cm3.
Regardless of this fact, heavy metals are known by their noxious effects in the environment and in human health. When present in effluents, Pb, Ag, Hg, Cu, Ni, Cr, Zn, Cd and Sn are elements that must be removed to a certain extent in order to proceed with discharge (Ayres, 1994).
The major source of heavy metal contamination is commonly industrial activity (Mueller, 2011), thus the growing concerns in the removal of compounds containing heavy metals. Metal mining and metal processing are responsible for the presence of toxic heavy metals in the environment to a great extent (Davis et al., 2000). However, the natural sources of heavy metals are not negligible. For example, cadmium is released into the environment, namely into rivers, through weathering of rocks. It is also released by volcanoes and forest fires. These sources represent about 25 000 tons of cadmium a year (Lenntech, 2012). The anthropogenic sources of cadmium can be of a wide variety of industries. Metal plating, metallurgical alloying and mining play a major role. Also ceramics, pigments, plastic, battery and refining processes are in the list of activities that release considerable amounts of cadmium in their waste streams (Benguella, 2002, Freitas et al., 2008, Davis et al., 2000).
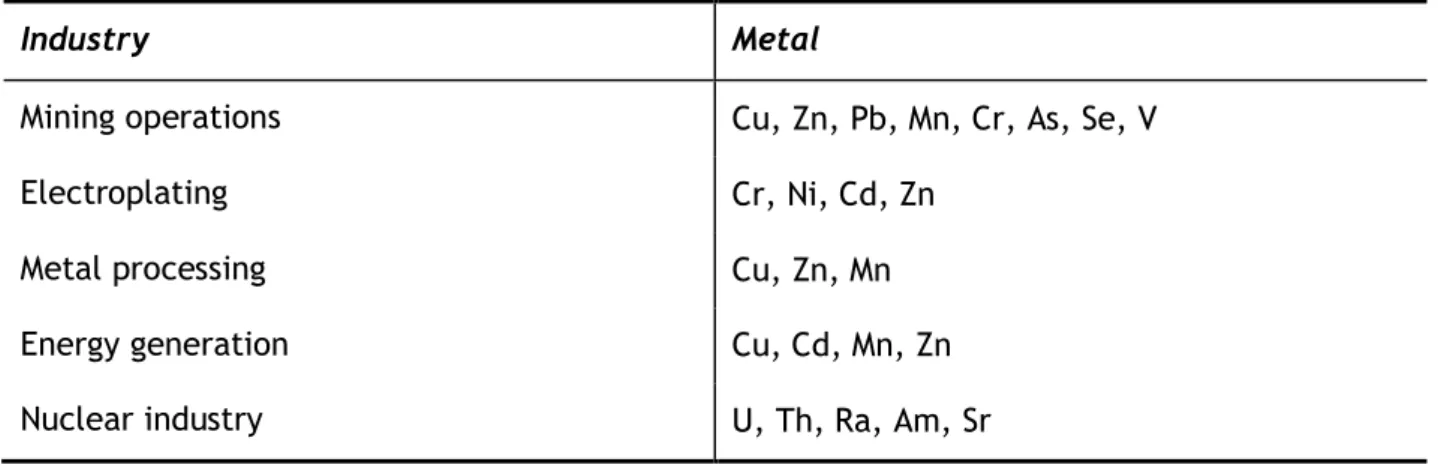
In Table 1 the presence of heavy metals in different industrial effluents is shown.
Table 1 Heavy metals in industrial effluents: adapted from (Volesky et al., 1999).
Industry Metal
Mining operations Cu, Zn, Pb, Mn, Cr, As, Se, V
Electroplating Cr, Ni, Cd, Zn
Metal processing Cu, Zn, Mn
Energy generation Cu, Cd, Mn, Zn
As the presence of these toxic elements in the environment grows evident, also does the priority to apply stricter legislation. The United States Environmental Protection Agency regulates the concentration of heavy metals in drinking water accordingly to Table 2.
In general, heavy metals are toxic even at low concentrations (1-10 mg/l). Cadmium carries toxicity to living organisms at a range of concentrations as low as 0.001-1 mg/l (Alkorta et al., 2004, Volesky et al., 1999). This element is a cumulative toxin (Benguella, 2002, Asir et al., 2005) due to its long biological half-life and human exposure to cadmium might result in chronic toxicity health problems such as kidney damage (Asir et al., 2005) and several types of cancer (lung, endometrium, bladder and breast). The International Agency for Research on Cancer has classified cadmium as a human carcinogen (group I) (World Health Organization, 2010). When the exposure to cadmium is unavoidable (e.g., industry occupations) the limit value of cadmium in blood should be no higher than 50 pg/l (Asir et al., 2005).
In Table 2, the limit concentrations of some metals in drinking water according to EPA are presented. This value is an indicator of the toxicity of the element. Cadmium concentration in drinking water for human health safety should be below 5 µg/l.
Table 2 Concentration limits of heavy metals in water: adapted from (EPA, 2009)
Metal Limit (mg/l) Hg 0.002 Cd 0.005 Ni 0.007 As 0.01 Pb 0.015 Zn 0.5 Cu 1.3
1.2.1 Existing methods for heavy metals treatment
There are a few well established methods for heavy metals treatment. Among them are chemical precipitation followed by filtration/sedimentation of the insoluble particles, ion exchange, reverse osmosis, electrochemical treatment and evaporation. These technologies offer good results in certain cases but also carry significant disadvantages, namely the inability to remove metals in the range of 10-100 mg/l of initial concentration at a feasible cost (Freitas et al., 2008).
A short assessment to the advantages and drawbacks of the use of these existing technologies is presented in Table 3.
Table 3 Advantages and disadvantages of heavy metals treatment methods: adapted from (Vieira, 2009).
Method Advantages Disadvantages
Chemical precipitation Simple and easy to operate. Cheap. Low maintenance costs.
Efficiency affected by pH or presence of other salts or solvents. Formation of large
volume of muds. Ion exchange High efficacy. Non-selective. pH dependent. Not suitable for large
concentrations.
Reverse osmosis Simple. Suitable for small flows. temperature conditions might Expensive equipment. pH or affect the membrane. Electrochemical treatment Allows removal of large amounts of metal. Suitable only for high concentrations.
Evaporation Easy recovery of the metal. All non-volatile compounds remain. High energy consumption.
Adsorption or biosorption are omitted due to the fact that they are less implemented technologies for heavy metal treatment at industrial level. However, as mentioned before, they are good alternatives for the removal of small amounts of metals.
Nonetheless, and regardless of all the methods stated above, heavy metals share the common characteristic of being non-degradable, i.e., existing methods are only efficient in transferring the metals from one medium to another.
1.2.2 Cadmium: physical properties and applications
Cadmium was discovered in 1817 by Fredrich Stromeyer. It is a silver, brilliant, soft and ductile metal. Cadmium in solid state can be seen in Figure 1.
Figure 1 Cadmium metal in solid state1.
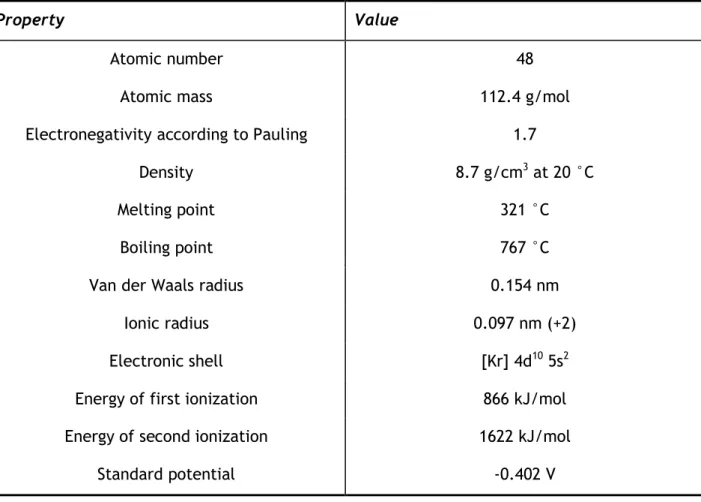
Cadmium is found in the earth’s surface always in combination with zinc. It is soluble in acids but not in alkalis. Table 4 summarizes the physical properties of cadmium.
Table 4 Physical properties of cadmium: adapted from (Lenntech, 2012).
Property Value
Atomic number 48
Atomic mass 112.4 g/mol
Electronegativity according to Pauling 1.7
Density 8.7 g/cm3 at 20 °C
Melting point 321 °C
Boiling point 767 °C
Van der Waals radius 0.154 nm
Ionic radius 0.097 nm (+2)
Electronic shell [Kr] 4d10 5s2
Energy of first ionization 866 kJ/mol
Energy of second ionization 1622 kJ/mol
Standard potential -0.402 V
Cadmium is a very common component of batteries and specialized electronics. The most widely spread use of cadmium occurs in Ni-Cd batteries. This alone represents three-fourths of cadmium usage. It is also part of pigments, coatings and stabilizers for plastics.
1.3 Molecularly Imprinted Polymers (MIPs)
Molecularly imprinted polymerization is a technique that induces molecular recognition properties in synthetic polymers, providing adsorption selectivity for the target molecule when present in mixtures (Asir et al., 2005, Le Noir, 2007a). Molecularly imprinting technology relies on the creation of recognition sites in a matrix using a molecular template (Asir et al., 2005).
In basic terms, when a co-polymerization between functional and crosslinking monomers takes place in the presence of the target molecule, the functional monomers will interact with the template that is afterwards removed, leaving its specific shape in the resulting polymer.
MIPs have been successfully used in several fields such as pollutants removal, biosensors, catalysis, solid-phase extraction for pharmaceuticals, environmental and food analysis, chiral separation, recognition and binding of proteins, biomedical applications (drug delivery) etc. (Bruggemann et al., 2000, Batlokwa et al., 2011, Francesco Puoci and Ortensia Ilaria Parisi, Pradeep K. Dhal, 2000, Christine Widstrand, 2006, Zorita et al., 2008).
The production of MIPs can follow different approaches, mainly regarding the type of interaction between the monomers and the template molecule. The template–monomer interaction, which constitutes the imprinting step, can be of different nature, following three different approaches:
i. non-covalent interactions (Batlokwa et al., 2011, Le Noir, 2007a) ii. reversible covalent bonds (Batlokwa et al., 2011, Le Noir, 2007a)
iii. mixed combinations of the two bonding methods (Batlokwa et al., 2011, da Silva et al., 2012)
The methods cited above are respectively named non-covalent imprinting, covalent imprinting and semi-covalent imprinting.
The first concept of MIPs started with Wulff and co-workers in 1977 and used the covalent approach (Le Noir, 2007a). Later the non-covalent imprinting proved to be efficient in forming the bond between the template and the functional monomer, relying on the
formation of a pre-polymerization complex (Mosbach, 1994). In this method, the monomer should carry suitable functional groups to bond with the template through ionic interactions or hydrogen bonding.
Figure 2 Basic principle of non-covalent molecular imprinting (Christine Widstrand, 2006).
In Figure 2, the steps of non-covalent molecular imprinting are illustrated. They can be described as follows (Asir et al., 2005):
i. Complexation of template to a polymerizable ligand ii. Polymerization of this complex
iii. Removal of template after polymerization
Nowadays, non-covalent imprinting is widely used mainly due to the simplicity of the process, for example, the removal of the template after polymerization is easy and the steps of template-binding and template-release are fast (Le Noir, 2007a). Concerning the removal of the template, in non-covalent interaction this might be done by simple elution with a solvent, but to cleave the covalent bonds present in the covalent imprinting technique, methods such as soxhlet extraction, ultrasonic extraction or pressurized hot water extraction are usually necessary. The soxhlet extraction is the most common method (Batlokwa et al., 2011, Francesco Puoci and Ortensia Ilaria Parisi, 2000).
The picking and removal of the template is a critical point in the synthesis of MIPs. To be aware of the latest techniques and to choose the template properly is of major importance. One simple starting point is that, when using MIPs for analyses purposes, the analyte is the less desirable template (Christine Widstrand, 2006). Instead, a similar molecule should be exploited for the presence of the significant functional groups in common. When
wrong methods are applied, bleeding of template is a major problem/drawback to the use of MIPs.
Also, the polymerization technique and the solvent used (that will act as the porogen) are determinant for the success of the imprinting step and the shape of the particles. Bulk polymerization, while simple to implement, often lead to huge loss of material (20% polymer yield) and to irregularly shaped particles (Bruggemann et al., 2000). On the other hand, suspension and precipitation polymerization proved to be efficient techniques to produce well defined MIP microspheres (Yoshimatsu et al., 2010, Wang et al., 2006).
Although MIPs are often imprinted with organic molecules, in this project a metal-ion imprinted polymer will be used for targeting cadmium. In its synthesis, the non-covalent approach is assessed. The complexation of metal-ions to a polymerizable ligand might be done by the addition of a chelating agent, such as ethylene-di-amine-tetra-acetic acid (EDTA). However, another strategy is to choose a functional monomer in which a chelating functional group is present. Polymers imprinted with metal-ions are also often named Ion Imprinted Polymers (IIP) (Buhani et al., 2010, Singh and Mishra, 2009).
1.4 Cryogels
Hydrogels are highly crosslinked polymeric materials which have the capacity of absorbing large quantities of water (Byrne et al., 2002). These might be produced by several procedures, including cryogelation.
Cryogelation occurs by freezing a solution at a certain temperature that will induce the separation between a liquid and a solid phase. Regarding the example of an aqueous solution, ice crystals will grow as a solid phase and the solutes will accumulate in a non-frozen one. The gel is formed through the reaction that takes place in the non-non-frozen phase where the reactant compounds are present, but the ice crystals create a constraint to the volume where the reaction can occur and thus shape the resulting gel. When the gel is thawed the ice crystals melt and an interconnected network of pores is formed. These pores are often large (> 100 µm) and thus referred to as macropores. This characteristic of cryogels makes them attractive to a wide range of applications, given their improved mass transfer properties (Kirsebom, 2010).
The synthesis of cryogels always require the formation of a non-frozen phase and therefore the temperature at which the solution is submitted must be at the same time sufficient to freeze the system but not below its eutectic point (Kirsebom, 2010).
Various techniques are available for the production of cryogels. They might be produced through free radical polymerization, chemical crosslinking of polymers or noncovalent structuring of polymers. In this project, the chemical crosslinking of polymers approach will be used.
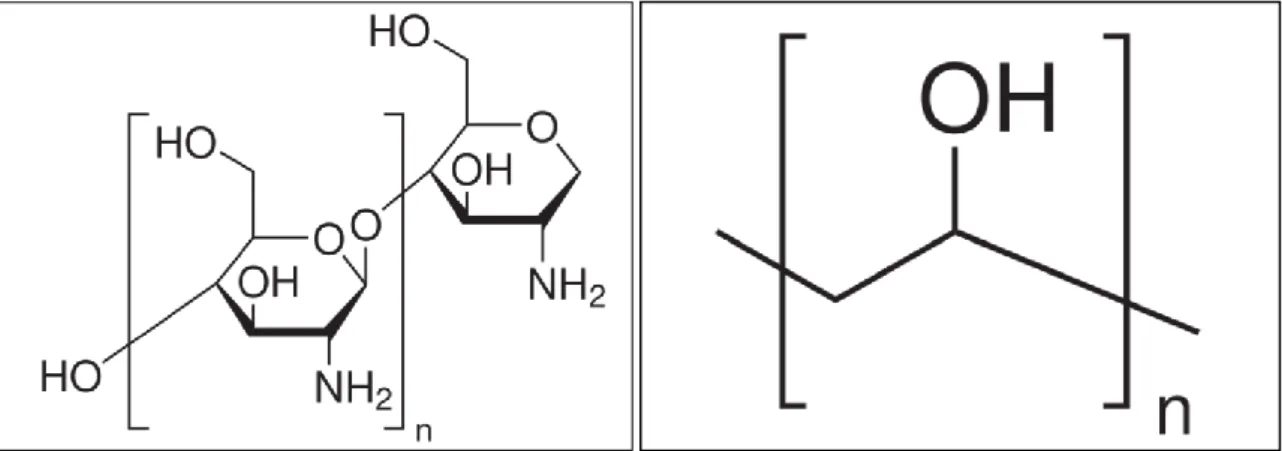
In order to synthesize two different cryogels, different polymeric materials will be used: chitosan and poly vinyl alcohol. In both cases glutaraldehyde will be used as the crosslinker. Glutaraldehyde is one of the most widely used polymer crosslinkers, due to its high reactivity and low cost. At approximately neutral pH, the aldehyde groups of glutaraldehyde react with amine groups in a fast and more efficient way than other aldehydes (Migneault et al., 2004). Chitosan is a biopolymer which results from the deacetylation of chitin, a constituent of shrimp shells (Kildeeva et al., 2009, Monteiro and Airoldi, 1999). Poly vinyl alcohol is a synthetic, biocompatible and water-soluble polymer (Vrana, 2009).
The chemical structures of the materials used can be seen in Figure 3 and Figure 4.
Figure 3 Chemical structures of chitosan (left) and PVA (right)2.
Figure 4 Chemical structure of glutaraldehyde3.
2Source: Sigma-Aldrich
http://www.sigmaaldrich.com/catalog/product/aldrich/448869?lang=en®ion=SE and http://www.sigmaaldrich.com/catalog/product/aldrich/341584?lang=en®ion=SE
Cryogels have been used in several fields: separation, purification, drug release, medical applications and tissue engineering (Andac, 2012, Kirsebom et al., 2007, Hajizadeh et al., 2010, Le Noir et al., 2007, Önnby, 2010, Yun et al., 2009).
However, rather than being directly applied to a process, cryogels are often used as matrices where the active particles (adsorbents, drugs, cells, proteins) are incorporated. In this project, cryogels will be mainly used as a matrix to incorporate MIP particles. This will enable the adsorbent to be handled easily and suitable for a larger range of processes, such as its integration in a column set up for continuous flow purposes.
2 Materials and methods
2.1 Materials
Cadmium chloride ≥ 99.99%, chitosan (from crab shell minimum 85% deacetylated), glutaraldehyde 50%, methyl methacrylate 99%, ethylene glycol dimethacrylate (EDMA) 98% and 2,2-azobis(2-methylpropionamidine) dihydrochloride (AAPD) 97% were purchased from Sigma-Aldrich (Steinheim, Germany). Hydrochloridric acid 37% and acetic acid 100% were from Merck (Hoenbrunn, Germany). Sodium hydroxide (pellets) was from Acros (Geel, Belgium). Methacrylamide ≥ 98% was obtained from Fluka (Steinheim, Germany). Poly vinyl alcohol (MW=27000 g/mol) was purchased from Clariant GmbH (Frankfurt, Germany).
Cadmium molecularly imprinted polymers were provided by Anja Mueller, Central Michigan University, Department of Chemistry. Membrane filtered deionized water was collected using a Millipore system (Molsheim, France).
2.2 Cadmium molecularly imprinted polymers (MIPs)
In this work, two different MIPs will be referred to: MIPs provided from an external source and MIPs that were produced during the experimental work. Hereafter, these two materials will be designated as MIP1 and MIP2, respectively.
MIP1 were used as received and MIP2 were prepared as stated in the section here below.
2.2.1 Synthesis of MIPs
MIP2 were produced according to Mueller et al. (2011) with some modifications. Methacrylamide and methyl methacrylate were chosen as functional monomers at a concentration of 3.11% (w/v) and a molar ratio of 3:7. Ethylene glycol dimethacrylate (EGDMA) and 2,2-azobis(2-methylpropionamidine) dihydrochloride (AAPD) were used as the crosslinker and the initiator, respectively.
In a 250 ml round-bottom flask, 150 ml of water, 1.28 g of methacrylamide, 3.74 ml of methyl methacrylate, 77.77 µl of EGDMA and 183.32 mg of cadmium chloride were mixed. The mixture was then purged with N2 to remove oxygen. Before exposing the reaction mixture
to UV light, 271.19 mg of AAPD were added. The reaction took place under UV light and vigorous stirring during 1 hour.
The protocol information is summarized in Table 5.
Table 5 Reagents used for the preparation of cadmium molecularly imprinted polymers (MIP2).
Component Function Original protocol (MIP1)(Mueller, 2011) Adapted protocol (MIP2) Water Solvent 150 ml 150 ml Methacrylamide Functional monomer 0.30 mol 15 mmol Methyl methacrylate Functional monomer 0 35 mmol
Methacrylic acid Functional monomer
0.70 mol 0
Cadmium chloride Template 1 mmol 1 mmol
EGDMA Cross-linker 0.5 mmol 0.5 mmol
AAPD Initiator 1 mmol 1 mmol
After the reaction, the mixture was left to sediment overnight and then centrifuged. The polymer was washed with deionized water to remove all the non-reacted components. Unlike the production of MIP1, MIP2 were hereafter washed with 4M HCl to extract the template (in the original protocol the elution of the template is made by dialysis in water). This step took place in batch (20 ml of HCl) during at least 6 hours and was repeated until the concentration of cadmium in the washing solution was negligible (< 1 µg/l). The product was then dried in the oven at 60 °C. After the drying step, the MIP particles were ground using a regular, manual grinder.
2.2.2 Material characteristics
MIP1 and MIP2 were evaluated for particle size and subject to FTIR analysis.
For particle size characterization, the particles were submitted to sieving tests. Three different sieving clothes were used: 106 µm, 38 µm and 25 µm. Approximately 100 mg of MIP1 and MIP2 were tested.
FTIR analyses were run in a Thermo Scientific Nicolet iS5 (Figure 5).
Figure 5 FTIR spectroscope used for analyses.
The yield of polymerization of MIP2 was calculated as described in Eq. 1, where is the weight of the resulting polymer after all steps of preparation.
Eq. 1
2.3 Gels and composites
Plain cryogels and composites were produced from chitosan and PVA solutions using, in both cases, glutaraldehyde as the crosslinker agent.
The production of composites implied the incorporation of MIP particles in the gels. The protocols are summarized below. It is important to highlight that only MIP1 particles were subject to incorporation in the gels.
2.3.1 Preparation of chitosan composites and plain gels
Cryogels of 0.5 ml were produced from a solution of chitosan (1%) and glutaraldehyde (0.125%) where 2% (w/v) of MIP1 particles were incorporated. The particles were added to the suspension before the crosslinker. The mixture was transferred to glass tubes and frozen at -12 °C. The gels were kept at this temperature overnight and then thawed and washed with deionized water at room temperature. The resulting material is a 2% (w/v) MIP1-cryogel composite. Control chitosan cryogels were produced as described earlier but without the incorporation of MIP1.
2.3.2 Preparation of poly vinyl alcohol composites and plain gels
Gel monoliths of 0.5 ml were produced from a solution of poly vinyl alcohol (PVA) (3%) and glutaraldehyde (0.25%) where 2% (w/v) of MIP1 particles were incorporated, following the same protocol described in the sub-section above. The pH of the PVA solution was set to pH 1 in order to facilitate the reaction.
2.3.3 Material characteristics
In order to determine the polymerization yield4 of the produced composites, 0.5 ml of
material was freeze-dried and the dry weight was measured.
The yield was calculated accordingly to the following equation:
Eq. 2
The porosity was roughly estimated by measuring the weight of the gels while in the swollen state and after being squeezed in order to remove the water in the pores (Andac, 2012). This implies the assumption that 100% of the water is squeezed out and that the density of the gel is comparable to the density of the water. The porosity is thus calculated by Eq. 3.
Eq. 3
Also, the swelling ratio of the gels was investigated accordingly to Eq. 4 (Kirsebom, 2010). This was done by measuring the weight of a wet gel in water and after being freeze-dried. Eq. 4
4 Accurately, the reaction that takes place in the cryogelation is a chemical crossliking of polymers.
Thus, the yield represents the extent at which the crosslinking occurred and not the monomer-monomer interaction as in a polymerization reaction. The term “polymerization yield” is used as a simplification.
2.3.4 Scanning electron microscope images
Composites and plain gels were subject to scanning electron microscope (SEM) analysis. SEM images were obtained from a JEOL JSM-5000LV microscope. The samples were prepared by cutting the gels into small discs which were first dehydrated in ethanol (0, 25, 50, 75 and 99.5%) and then critical-point dried. The samples were then sputter-coated with gold/palladium (40:60) prior to examination in the microscope.
2.4 Adsorption studies
Molecularly imprinted polymers (MIP1 and MIP2), chitosan and PVA gels and gel-MIP composites were subject to adsorption studies in order to determine the sorption behaviour in cadmium solutions. The adsorption study of all the selected materials was made by a set of batch experiments. These experiments took place at room temperature (≈ 20 °C) on a rocking table (Figure 6). The concentration of adsorbent in solution remained constant and equal to 1 g/l throughout all the experiments.
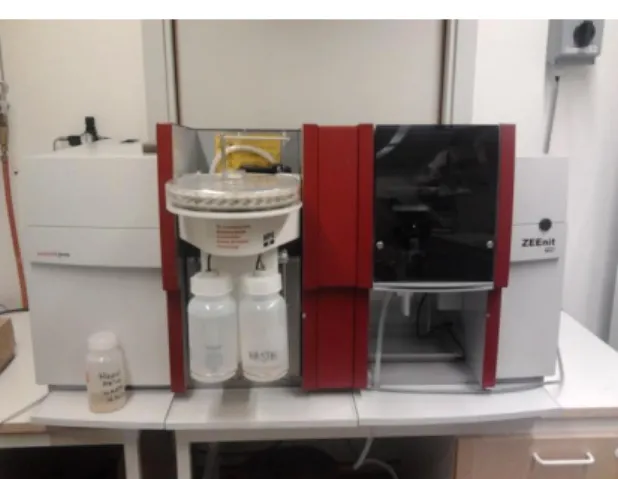
The preferred analytical method to analyze cadmium samples was atomic absorption spectrometry. The instrument used is an Analytik Jena ZEEnit 700 model (Figure 7). Analyses were performed using two different techniques: flame atomic absorption spectrometry and graphite furnace AAS. The instrument was calibrated at every initialization. For GFAAS, a standard cadmium solution of 5 µg/l was prepared and the calibration curve was obtained by five sequential and automatic dilutions. For FAAS, standards were prepared in the range of 0-2 mg/l.
All results presented in the following sections of this report are an average of duplicates, unless otherwise stated.
Figure 6 Batch adsorption experiments: particles in free suspension in batch adsorption on a rocking table (left) and PVA cryogel in batch adsorption (right).
Figure 7 Atomic absorption spectrophotometer used for analyses.
The summary of the experiments is presented in Table 6.
Table 6 Summary of experiments presented in R&D section.
Adsorbent pH dependence Kinetic study Capacity determination MIP1 x x MIP2 x Chitosan-MIP x x PVA-MIP x x Chitosan x PVA x
2.4.1 Preparation of cadmium solutions
Cadmium solutions that were used in the adsorption experiments were prepared from cadmium chloride. Stocks of 10 mg/l and 400 mg/l have been prepared using membrane filtered deionized water.
2.4.2 pH dependence
Chitosan and PVA-based composites were subject to a pH screening in order to determine the ideal pH conditions for the adsorption experiments. pH measurements were performed with a laboratory pH meter purchased from Schott.
Batch adsorption experiments were carried out for a range of pH values (from pH 2 to pH 7) in 10 ml Cd solution of initial cadmium concentration of 10 mg/l. pH values were adjusted by adding small drops of 0.1 M HCl or 0.1 M NaOH. Samples were taken at 24h and 48h.
2.4.3 Kinetic study
For the kinetic sorption experiments, 5 mg/l of Cdsolution was chosen and the pH was set accordingly to the results of the pH screening. Both composites and controls were analyzed in 10 ml batch, using 0.5 ml monoliths.
Molecularly imprinted polymers particles in free suspension were also subject to the same approach with a slight modification concerning the batch volume which was increased to 40 ml and with an adsorbent concentration still intact (1 g/l).
The kinetic modeling of the experimental data was made by the Lagergren equation (pseudo first-order )(Ho, 2004) and the second-order rate equation (Benguella, 2002, Freitas et al., 2008). The equations are presented in Eq. 5 and Eq. 6, respectively.
Eq. 5
Eq. 6
where and are the amounts of metal ion sorbed (mg/g) at equilibrium and time , respectively; is the Lagergren rate constant of adsorption (min-1) and is the second
According to these models, the initial uptake rate is calculated by Eq. 7 and Eq. 8, respectively.
Eq. 7
Eq. 8
where and (mg g-1 min-1) are the initial uptake rates for pseudo-first order and for
second order, respectively.
Two models are proposed to investigate intraparticle diffusion control.
The linear fitting of a long-time response to the Weber and Morris equation (Eq. 9) indicates that the rate of adsorption is controlled by intraparticle diffusion (Ho et al., 2000, Freitas et al., 2008).
Eq. 9
where (mg g-1 min-0.5) is the Weber and Morris intraparticle diffusion rate.
The diffusion coefficient can be calculated by Eq. 10.
Eq. 10
where (m2 min-1) is the diffusion coefficient in the solid and (m) is the mean particle
diameter.
Another usual model is Urano and Tachikawa’s (Urano and Tachikawa, 1991). The linear form of its equation is present in
Eq. 11
.
Eq. 11
Throughout all data analyses, the amount of cadmium adsorbed at equilibrium was calculated accordingly to Eq. 12.
Eq. 12
where is the batch volume (ml), is the initial concentration of cadmium in solution (mg/l), is the concentration of cadmium in solution at equilibrium (mg/l) and is the mass of adsorbent (mg).
2.4.4 Capacity evaluation
In order to determine the maximum capacity of MIP1 particles, the batch method for isotherm determination was applied with varied initial concentrations (5, 10, 20, 50, 75, 100, 150, 200, 300 and 400 mg/l of cadmium). Sorption experiments (10 ml/batch) took place in contact with 10 mg of MIPs for 24h on a rocking table.
Linear models of Langmuir and Freundlich isotherms were used to fit experimental data. For Langmuir, Hanes-Woolf and Lineweaver-Burke models (respectively, Eq. 13 and Eq. 14) were used (Bolster and Hornberger, 2008, Subramanyam and Das, 2009). The linearization of Freundlich equation is presented in Eq. 15.
Eq. 13 Eq. 14 Eq. 15
where is the amount of cadmium in the solid phase in the equilibrium, is the cadmium concentration in solution in the equilibrium, is the maximum capacity of the monolayer and , and are constants.
Also, an attempt to model the results with a non-linear model was made. The BET isotherm was used as presented in Eq. 16.
Eq. 16
where , and have the same meaning as in Eq. 13 and Eq. 14. is the concentration of the adsorbate in the saturation of all layers and is a constant.
However, this model has three degrees of freedom and thus its linearization is only possible if one of the parameters is constrained. Also, its correct use for modelling liquid phase adsorption is not well established in the scientific society (Ebadi et al., 2009). In this project, the method applied took as an adjustable parameter. The concentration of cadmium in the liquid phase at saturation was used as the first estimative of and this value was then adjusted to obtain the best regression of the data values.
3 Results and discussion
Accordingly to the experimental plan and following the objective of this project, relevant results are presented in this section.
The investigation of material characteristics is seen as a primary requirement for the understanding of the sorption behaviour and thus this is first discussed in the first two sub-sections, where molecularly imprinted polymers and cryogels were characterised as extensively as possible.
Finally, the experimental data and results obtained in order to study the adsorption behaviour of Cd in molecularly imprinted polymers and cryogels is showed and discussed in sub-section 3.3.
3.1 Characterization of cadmium molecularly imprinted polymers
(MIPs)
Molecularly imprinted polymers are selective materials regularly used for adsorption purposes. The presence of specifically shaped binding sites allows the recognition of a target molecule and improves the selectivity towards that compound when other molecules are present. However, the polymer must have characteristics that provide affinity between the surface of the material and the target molecule, so that adsorption can occur.
Adsorption is a surface phenomenon in which a component of a liquid or gas accumulates onto a solid surface. In the case of physisorption, the type of forces responsible for the process is weak and non-specific, namely Van der Waals forces. In the case of chemisorption, there must be active centres in the adsorbent which form chemical bonds with the adsorbate. Given that an ion is implied in the process, electrostatic attraction should be given special attention. The existence of a charged surface is likely to be responsible for the retention of Cd onto the polymer surface. In order to investigate the possibility of this to occur, a deep knowledge of the composition of the polymer is required.
Furthermore, two different polymers were subject to investigation and a comparison between them is also desirable. Thus, FTIR was performed in both cases as well as the sieving tests.
3.1.1 FTIR spectra
Fourier transform infrared spectroscopy was used to compare MIP1 and MIP2. The
spectra are visible in Figure 8.
Figure 8 FTIR spectra of MIP1 and MIP2.
Figure 8 shows that MIP1 match a FTIR spectrum with considerable absorbance values in the following ranges: 3600–2500, 2954, 1707, 1486, 1383, 1244, 1170, 920, 768 and 584 cm-1. The values fall in the same ranges as stated by Mueller et. al (2011).
MIP2 has relevant absorbance values at: 2954, 1724, 1677, 1481, 1382, 1244, 1149, 969, 842 and 750 cm-1.
This analysis shows that the polymers are undoubtedly similar with special attention to the presence of C=O bonds present in the range of 1630-1695 cm-1 that are characteristic of
amides and confirm the presence of methacrylamide, the common monomer present in the preparations of both polymers.
3524.8 2570.6 1707.2 1652.7 1481.5 1170.1 1148.9 1244.3 1724.5 2954.4 0 0.05 0.1 0.15 0.2 0.25 0.3 0.35 525 1025 1525 2025 2525 3025 3525 A b so rb an ce Wavenumbers (cm-1) MIP1 MIP2
MIP1 and MIP2 also share common values of absorbance in the range of 1710-1735 cm-1
which indicate the presence of C=O bonds in esters and carboxylic acids.
The major difference relies on the presence of a very broad band in the range of 3600-2500 in MIP1 spectrum, which reveals the presence of an O-H bond of a carboxylic acid. This band is not visible in MIP2 spectrum, confirming the changes made in the protocol where methyl methacylate was used instead of methacrylic acid.
This fact implies a major compromise of the results presented hereafter. As mentioned in the Molecularly Imprinted Polymers sub-section in the Introduction of this report, the success of ion-imprinting polymerization is dependent on the presence of a chelating agent. Methacrylic acid is easily deprotonated, originating methacrylate, whereas methyl methacrylate is very unlikely to dissociate. Thus, the presence of the chelating group (carboxylate) will only be noticed in MIP1. Not only is this mandatory for the imprinting step to happen, it is also a requirement for the polymer to be a chelating resin. As a conclusion, MIP2 do not fall into the category of chelating resins and given that no other chelating agent was added during the polymerization reaction, this polymer i) is not an ion-imprinted polymer ii) is considerably more hydrophobic than MIP1 iii) is expected to show rather low values of binding to Cd cations.
3.1.2 Particle size and polymerization yield
Sieving tests allowed estimating the diameter of MIP particles. The smallest particles had diameters in the range of 25-38 µm in MIP1 case and 38-106 µm in MIP2.
Table 7 Particle size distribution: results of sieving test.
MIP1 MIP2
0 58.4%
59.9% 41.6%
40.1% 0
The particle size was determined and evaluated as a measure of the surface area available for adsorption, i.e., the smaller the particles the higher the surface area. Accordingly to Mueller et. al (2011) the BET surface area of MIP1 is 0.54 m2/g. This value
surface of the particles is mainly where the adsorption occurs. The BET surface area was not measured for MIP2.
The physical appearance of the particles is illustrated in Figure 9.
Figure 9 MIP particles: MIP2 (left) and MIP1 (right).
The obtained dry weight of MIP2 was 1.586 g and the polymerization yield was 32%, which accounts due to the loss of material during drying and grinding processes. The value of the polymerization yield in the case of MIP1 is unknown and thus a comparison between the extents of both reactions is impossible to obtain.
3.2 Characterization of gels and composites
Two different polymers were the object of study: chitosan and poly vinyl alcohol. The physical appearance of both gels is visible in Figure 10.
Figure 10 Chitosan (left) and PVA (right) cryogels.
The pictures shown in Figure 10 are plain gels. The physical appearance of the composite at this scale is roughly the same.
SEM images are present in Figure 11 and Figure 12 for a visualization of the surface of the composites. Pore diameters > 100 µm are visible in both gels. At higher resolution, it is intended to inspect the surface of the particles. However, SEM images show what seems to be an agglomeration of the particles rather than single, well-defined particles. These agglomerates show a highly heterogeneous and strong indented pattern. Similar patterns are present in SEM images of molecularly imprinted polymers seen in other similar works (Buhani et al., 2010, Le Noir, 2007b).
During the experimental part it was visible that the embedding of the cryogels with MIP1 particles was not as effective in the PVA gels as it was in the chitosan gels, with PVA gels showing sedimentation of the particles in the bottom of the composite; this is a consequence of the lower viscosity of the PVA solution from which the cryogels were produced, compared to the chitosan preparation. Therefore, the presence of the particles in the greater upper volume of the gel is expected to be very rare. Figure 11 and Figure 12 clarify this fact, proving the existence of more visible particles in the chitosan gel.
Figure 11 SEM images of chitosan-MIP composite.
The values of the physical properties of cryogel-MIP composites are shown in Table 8.
Table 8 Physical properties of cryogel-MIP composites. Gel Yield of polymerization
(%)
Swelling (%) Porosity (%)
Chitosan-MIP 93.47 ± 4.2 72.85 ± 3.9 33.01 ± 1.8
PVA-MIP 90.09 ± 2.1 60.75 ± 3.0 25.40 ± 0.08
In both cases the crosslinking reaction occurs up to a high extent, confirming that the reaction conditions are well established.
Regarding the porosity, the values are smaller when compared to other authors (Andac, 2012, Kirsebom et al., 2010), who have achieved values in the range of 60-90%. However, this factor is highly dependent on the type of material and more specifically on the conditions at which the cryogelation takes place, such as the concentration of monomers present in the aqueous solution, the temperature at which the cryogelation occurs and the time for the solidification of the ice crystals.
Kirsebom et al. (2010) used another method for the evaluation of the porosity of cryogels which implies the dry weight of the gel and the wet weight of the gel after being filled with cyclohexane, accordingly to Eq. 17.
Eq. 17
This is considered to be a more accurate estimation in relation to the fact that it is assured that 100% of the water is expelled out of the gel. Regarding the use of cyclohexane, it is understood that the choice of the immersing liquid should rely on the similarity between the density of the liquid and the density of the gel in question. In order to validate these results, the density of the cryogels should be assessed.
The materials in question show high values of swelling in water. The swelling concerns the amount of water that the cryogels are able to uptake and thus determines its final volume. It can be seen as a measure of the efficiency of the matrix, i.e., the higher the swelling the less the mass of gel that is necessary to achieve a certain final volume. High swelling ratios are usually desirable for these matrices because it implies that they can be handled and transported in the dry state with a low weight.
3.3 Adsorption study
In this section the results from the adsorption experimental work are presented. It is divided in three parts: pH dependence, kinetic behaviour and capacity determination.
The pH dependence is first assessed in order to determine the ideal acidic or basic conditions at which all the following experiments will take place.
The kinetic behaviour is meant to be analysed and to provide the time limit at which the equilibrium is reached.
The capacity determination shall provide the value of the maximum uptake of cadmium by MIP1. Furthermore, an interpretation of the isotherm might be helpful to understand the mechanism of adsorption.
3.3.1 pH dependence
Figure 13 shows the pH dependence of cadmium removal by cryogel-MIP composites. The accuracy of the pH values is ± 0.5.
In both cases it is clear that adsorption is favored by higher pH. This is an expected result, since the basic conditions promote the deprotonation of the carboxylic acid present in MIP1, originating a carboxylate (negatively charged) that will attract cadmium cations.
Nonetheless, cadmium in water solution may precipitate in the hydroxide form at pH ≥ 8 (Ayres, 1994). Thus, given the similarity of the results from pH 5 to pH 7, it was preferred to work in the more acidic condition. Hereafter all the adsorption batch experiments are run at pH 5, unless otherwise stated.
Figure 13 Removal of cadmium by both composites at different pH values.
0 10 20 30 40 50 60 70 80 90 100 2 3 4 5 6 7 R e m o va l (% ) pH
Chitosan-MIP
PVA-MIP
At pH 2 and pH 3, values of negative adsorption are within the standard deviation range of the results (absence of data values for chitosan-MIP composite at pH 2 indicates that the average removal percentage was negative as well). This was attributed to experimental and analysis errors such as serial sample dilutions or inaccuracy in the calibration of the analytical method. However, further investigation also highlighted the fact that such low pH values might be a suitable condition for Cd desorption to a certain extent. Here it is likely that template bleeding occurred. Washing of MIP1 with HCl 1M showed elution of 1.10 ± 0.05 mgCd/gMIP1.
The absence of removal data for PVA-MIP cryogel at pH 6 and pH 7 is explained by the fact that there was a change in pH during the adsorption test of 24h. The pH changes can be seen in Table 9. This is attributed not to the adsorption phenomenon itself, but most likely to the release of acid from the PVA gels that were produced from a solution of pH 1.
Table 9 Variation of pH during the pH screening test on PVA-MIP cryogel. Initial pH 2 3 4 5 6 7 Final pH 2 3 4 4 4 5
3.3.2 Kinetic study
All the combinations of adsorbents were evaluated during the kinetic study. Figure 14 shows the behaviour of MIP1 in free suspension and chitosan/PVA-MIP composites.
Figure 14 Cadmium uptake by MIP1 particles in free suspension and in chitosan and PVA matrices at different time points.
0 0.5 1 1.5 2 2.5 0 100 200 300 q (mg Cd /g M IP s ) Time (min)
While in suspension, MIP1 particles prove to bind to Cd2+ ions quite fast – equilibrium is
reached in less than 5 minutes. While incorporated in the cryogels, the necessary time to reach equilibrium increased up to approximately 3 hours. The differences in the kinetic behaviour of composites might indicate i) the prevalence of other mechanisms of adsorption that occur on the surface of the cryogels ii) mass transfer limitations in the pores network of the cryogels and due to agglomeration of particles.
It is also visible that the PVA-MIP composite did not achieve the same value of Cd uptake as MIP1 and chitosan-MIP. As mentioned in the characterization of the materials sub-section, these composites showed sedimentation of the particles instead of a homogenous distribution. Therefore, it might be that the adsorption sites are inaccessible, i.e., the mass transfer resistance in the bulk is so strong that the adsorption becomes immeasurably slow and in fact equilibrium is not reached in 3 hours’ time.
The linear fitting to the models presented earlier in this report is shown in Figure 15 and Figure 16. MIP1 in free suspension proved to be well correlated to the second order rate, while adsorption in the composites follows better the Lagergren model. However, in this last case the correlation between the model and the experimental data is not so satisfactory, which is more evident in PVA-MIP case. This might indicate that the model fails to predict the kinetic behaviour in the entire range of the time domain until equilibrium is reached, which has been appointed as a limitation of the Lagergren model (Aksu, 2001). In PVA-MIP it is also likely that the amount of cadmium on the solid phase at equilibrium is not well estimated, as mentioned in the previous paragraph.
Figure 15 Linearization of the kinetic behaviour of adsorption of cadmium on chitosan-MIP (left) and PVA-MIP (right) cryogels by the first-order Lagergren equation.
y = -0.0167x R² = 0.9488 -4 -3 -2 -1 0 0 50 100 150 200 lo g[ (q e -q t)/ q e ] t (min)
Lagergren first order: chitosan-MIP
y = -0.0113x R² = 0.4194 -2.5 -2 -1.5 -1 -0.5 0 0 50 100 150 200 lo g[ (q e -q t)/ q e ] t (min)
Figure 16 Linearization of the kinetic behaviour of adsorption of cadmium on MIP1 in free suspension by the second order rate equation.
MIP1 experimental data was studied regarding the possibility of intraparticle diffusion control (see Appendix A: Kinetic modelling of Cd adsorption in MIP1). Figure 22 illustrates the linear relation between the experimental values and the two selected models. In both cases, a linear fitting was not achieved. This indicates that intraparticle diffusion is not the controlling step of the process, which is in agreement with the fact that the MIP particles are practically non-porous. Mass transfer resistance in the bulk was neglected due to the fact that the particles formed a suspension in water and thus all adsorption sites on the surface of the particles should be available for cadmium uptake (Freitas et al., 2008).
A summary of the parameters obtained through the modelling of the results is presented in Table 10.
Table 10 Kinetic parameters of Cd adsorption in MIP1 and cryogel-MIP composites.
Adsorbent MIP1 - 0.0845 1.72 ± 0.07 - 0.145 0.999 Chitosan-MIP 0.0384 - 2.00 ± 0.08 0.0768 - 0.945 PVA-MIP 0.0304 - 0.675 ± 0.01 0.0205 - 0.419 y = 0.5648x + 0.3577 R² = 0.9998 0 20 40 60 80 100 120 0 50 100 150 200 t/q t t (min) Pseudo-second order: MIP1
The kinetic behaviour of plain gels and MIP2 was also assessed and can be visualized in Figure 17.
Figure 17 Cadmium uptake by PVA and chitosan cryogels and MIP2 particles in free suspension at different time points.
Here it is seen that the materials used as the matrices for the incorporation of MIP particles also show some binding to Cd ions. This indicates that, even though MIP1 are seen as the active adsorbent material, the surface of the gels is also capable of binding Cd ions. Coincidently, MIP2 achieve a metal uptake similar to plain gels and much lower than MIP1. This result supports the fact that the presence of a chelating group is essential for adsorption purposes in the case of study and that the imprinting step is unlikely to have occurred.
0 0.1 0.2 0.3 0.4 0.5 0.6 0.7 0.8 0.9 1 0 50 100 150 q (m g Cd /g ads orbe nt ) Time (min)
3.3.3 Capacity determination
MIP1 were investigated in order to determine the maximum capacity for Cd uptake. Figure 18 shows the experimental data obtained for capacity determination.
Figure 18 Adsorption isotherm for Cd in MIP1.
Accordingly to these results, saturation should be reached at equilibrium concentration of approximately 200 mg/l with a maximum adsorption capacity of 160 mgCd/gMIPs. The value appears to be very high. The data values also show increased
uncertainty as the equilibrium concentration goes higher (see Appendix B). Other authors have found adsorption capacity values considerably lower in different but comparable materials. Adsorption of Cd in chitin achieved 14 mg/g (Benguella, 2002); sugarcane bagasse adsorbed Cd up to 6.79 mg/g (Ibrahim et al., 2006); a closer, but still much lower result, was found using a Cd-imprinted chitosan resin, with a maximum capacity of 89.37 mg/g (Liu et al., 2011).
For a validation of the capacity value, the models mentioned before were applied (see Appendix B). The modelling of the isotherm curve in its all extent is presented in Figure 23. However, the correlation of the experimental data to the models was unsuccessful, which is a limitation for further interpretation of the adsorption mechanisms.
The Langmuir isotherm model, widely used for its simplicity, is usually suitable to correlate the data values and enables the determination of the monolayer capacity. The literature strongly supports its use in metal adsorption studies by different kinds of
0 20 40 60 80 100 120 140 160 180 0 50 100 150 200 250 300 q (m gCd /gM IP s ) Ce (mg/l)
adsorbents, given that it usually provides a good fitting. The most evident reason for this fact is that the experimental data has not reached saturation of the adsorbent and thus several data points at higher concentrations would be needed. To investigate the formation of multilayers, Freundlich and BET models were also addressed, but they still show a low correlation factor.
Nonetheless, the values of the constants were calculated accordingly to the linear regression of the data points (see Appendix B). In the case of Langmuir and Freundlich models the values are statistically inconsistent; in the case of BET model, numerical values were calculated but have no physical meaning (negative values).
However, given the interest in the application of these particles in low concentration media, a careful look at the first part of the isotherm should be given. Here, extra experimental data was obtained to confirm the assumption that there’s an apparent maximum capacity of approximately 9 mg/g when MIP2 are present in low concentration Cd solutions.
Figure 19 shows the equilibrium data in the range of liquid phase concentration from 0-10 mg/l.
Figure 19 Adsorption isotherm for Cd in MIP1 (lower range of concentrations).
The Langmuir isotherm model provided a good fitting in this case, as can be seen in Figure 20. 0 2 4 6 8 10 12 0 2 4 6 8 10 qe (m gCd /gM IP s ) Ce (mg/l)
Figure 20 Linear fitting of the data values present in Figure 19 by the Langmuir model.
The linear regression equation allowed the calculation of the Langmuir parameters, present in Table 11.
Table 11 Langmuir parameters for adsorption equilibrium at low concentrations.
Model
Langmuir (H-W) 35.97 8.969
Given this analysis, this value could be interpreted as the monolayer capacity and the formation of multilayers would explain the behaviour of the isotherm at higher concentrations. The adsorption equilibrium at low concentrations (0-10 mg/l) of Cd can be described by Eq. 18. A comparison between the model and the experimental data is made in Figure 21. Eq. 18 y = 0.1115x + 0.0031 R² = 0.9994 0 0.2 0.4 0.6 0.8 1 1.2 0 2 4 6 8 10 12 Ce /q e Ce Langmuir - Hanes-Woolf
Figure 21 Comparison between experimental data and Langmuir model for low Cd concentrations.
Thus, as a conclusion, the Langmuir model seems to describe the adsorption equilibrium at low concentrations. 0.0 1.0 2.0 3.0 4.0 5.0 6.0 7.0 8.0 9.0 10.0 0.0 2.0 4.0 6.0 8.0 10.0 qe (m gCd /gM IP s ) Ce (mg/l)
4 Conclusions
A few combinations of materials for cadmium removal from water solutions were produced and evaluated within the scope of this work.
Cadmium imprinted polymer particles in free suspension or incorporated in cryogels are able to remove cadmium from water solutions to a high extent. However, the efficiency of the adsorption process relies on the existence of chelating groups in the polymeric material. These MIP particles are practically non-porous and the process is controlled by the adsorption on the surface of the particles.
Cryogelation is an effective method to produce hydrogels with large interconnected pores and swelling behaviour. The embedding of cryogels with MIPs is possible without compromising the cadmium uptake. Nonetheless, the matrix carries along a considerably mass transfer resistance, making the process slower.
Finally, the capacity of the adsorbent (MIP1) seems to be considerably high, but further investigation and experimental data would be needed to validate this conclusion.
5 Project evaluation
In this section, a short evaluation of the project is made. The achievements of the proposed objectives as well as the project limitations are assessed. The need and possibility of future work are also discussed.
5.1 Objectives achieved
The development of this project had as a primary objective the production of a composite which would have potential to remove cadmium from water solutions. This composite should be made of an active adsorbent material (MIPs) and a cryogel matrix.
The main objective was achieved and was supported by the high removal percentages showed at the optimum pH conditions and by similar adsorption results obtained by MIPs in free suspension and particle-embedded cryogels.
As an implied objective were both the characterisation of the material and the study of the adsorption process, as extensively as possible. An effort was made during the discussion of the results to clarify the aspects that were successfully characterised.
5.2 Limitations and future work
The most considerable limitation of this work was the inability to clarify the adsorption equilibrium in the complete range of concentrations. An alternative method to find the saturation capacity can be to decrease the concentration of adsorbent in each batch with constant initial cadmium concentrations; this should lower the initial concentration of cadmium needed to reach saturation and avoid the contact with high concentrated cadmium solutions.
One of the biggest claims of molecularly imprinted polymerisation is its high selectivity. Within the scope of this work, MIP1 were only used in single solute solutions. Therefore, the selectivity was not determined. The most evident future work is to evaluate the behaviour of MIP1 in mixtures containing different heavy metals.
In this study cryogels were used as matrices for the incorporation of small (< 100 µm) MIP particles. However, this seems to have resulted in the creation of mass transfer limitations to a high extent. Studies report the imprinting technique in the polymeric material of the cryogel itself (Bereli et al., 2008) for other purposes other than heavy metal removal. Yet, this could be an inspiration for further work in regard to overcoming mass transfer limitations in the bulk.