Controlling the Workforce for the Delivery Support Team in
a Luxury E-commerce Industry
Miguel Ângelo Teixeira Duarte
Master’s Thesis
Supervisor at FEUP: Prof. Dr. Gonçalo Figueira Company’s Supervisor: Eng. Nuno Carvalho
Master in Industrial Engineering and Management
“Numbers have an important story to tell. They rely on you to give them a clear and convincing voice”.
Abstract
The present dissertation has the main objective of developing tools for the measurement and control of the tasks performed by a team responsible for the Delivery Support services. Due to the fact that luxury e-commerce companies have been growing at a fast pace over the years, the quality of the services provided become more and more demanding. With the number of orders increasing continuously, there is also an increase on the number of issues related with the delivery of goods. Hence, this project was created to build new reporting tools that can help Farfetch’s Delivery Support team improve performance.
After a quick analysis of the previous reporting, many doubts arose concerning the veracity and consistency of the data. Hence, some of the old KPIs were redefined and combined with new ones in order to create a set of new dashboards able to offer the team better performance reports. These reports are able to cover the performance of all the agents, individually and collectively, offering multiple visualization features and different time-perspectives: weekly, daily and hourly. With the new tools, it is possible to offer quality insights for agents, supervisors and managers, enabling players to make decisions on both operational and strategic levels based on the numbers provided by the dashboards. All the reports developed during this dissertation have automatic refresh scheduling and are available for all the members of the team working on four different countries: Portugal, United States, Japan and China.
With the implementation of this project, the team was able to improve results in just three weeks. The Service Level Agreement and Response Rate increased, by 11.7% and 9.5% respectively, and the percentage of tickets reopened decreased from 12.5% to 11.0%. The main achievements of this dissertation were not only these metrics improvements but also the dashboards developed that represent a strong basis for present and future needs. On top of that, there was also the opportunity to start developing the foundations for planning and forecasting, the next step in terms of workforce management.
Controlo da equipa de apoio às entregas numa indústria de luxo
online.
Resumo
A presente dissertação tem como principal objetivo o desenvolvimento de ferramentas para a medição e controlo das tarefas realizadas por uma equipa de trabalho responsável pelos serviços de suporte de entrega. Devido ao facto das empresa de luxo eletrónico terem vindo a crescer a um ritmo acelerado ao longo dos anos, a qualidade dos serviços oferecidos tornam-se cada vez mais exigente. Com o número de encomendas a crescer continuamente, também há um aumento no número de problemas relacionados com a entrega dos bens. Assim, este projeto foi criado para construir novos relatórios capazes de ajudar a equipa de suporte de entrega da Farfetch a melhorar o seu desempenho.
Após uma rápida análise aos relatórios antigos, muitas dúvidas surgiram no que diz respeito à veracidade e consistência dos dados. Assim, alguns dos indicadores de performance chave foram redefinidos e combinados com novos indicadores de maneira a criar um conjunto de novas dashboards capazes de oferecer à equipa melhores relatórios de performance. Estes relatórios são capazes de cobrir a performance de todos os agentes, de maneira individual e coletiva, oferecendo várias opções de visualização e diferentes perspetivas temporais: semanal, diária e horária. Com as novas ferramentas, é possível oferecer informação de qualidade para agentes, supervisores e diretores, permitindo aos elementos da equipa tomar decisões tanto a nível operacional como estratégico com base nos números provenientes das dashboards. Todos os relatórios desenvolvidos durante esta dissertação possuem atualizações automáticas e estão disponíveis para todos os elementos da equipa que trabalham em quatro países: Portugal, Estados Unidos, Japão e China.
Com a implementação deste projeto, a equipa foi capaz de melhorar os seus resultados em apenas três semanas. O Nível de Serviço Acordado e a Taxa de Resposta aumentaram, em 11.7% e 9.5%, respetivamente, e a percentagem de tickets reabertos diminuiu de 12.5% para 11.0%. As conquistas mais importantes desta dissertação não foram apenas as melhorias nestas métricas, mas também as dashboards desenvolvidas que representam uma base forte para as necessidades presentes e futuras. Para além disso, houve também a oportunidade de começar o desenvolvimento das bases para o planeamento e previsão, o próximo passo no que toca à gestão da equipa de trabalho.
Acknowledgments
Firstly, I would like to thank to everyone at Farfetch whom I had the pleasure to work with. In particular, I owe my gratitude to all the Workforce Management and Delivery Support team members who helped me a lot during the entire project. A special note of thankfulness goes to my supervisor Nuno Carvalho for his companionship, technical input and persistent feedback. I would also like to thank my supervisor at FEUP, Gonçalo Figueira, for the time, patience and valuable input throughout this project. A special mention to all my professors at FEUP for helping me grow and become the person I am today.
Last, but not least, I would like to thank my parents, without whom I would never be able to engage on this amazing adventure. I can certainty say that if it wasn’t for them I would not be where I am today.
Table of Contents
1 Introduction ... 1
1.1 Workforce Management at Farfetch ... 1
1.1.1 Workforce Management Team ... 2
1.1.2 Delivery Support Team ... 3
1.2 Project scope, methodology and structure ... 4
2 State of Art ... 6
2.1 Workforce Management ... 6
2.2 Luxury E-commerce ... 7
2.2.1 Luxury customers ... 8
2.2.2 Logistics and delivery support ... 8
2.3 Kaizen – Continuous Improvement ... 9
2.3.1 Daily Kaizen ...10
2.4 Dashboards ...11
2.4.1 Key Performance Indicators ...11
3 Delivery Support Team Situation ... 13
3.1 Delivery Support Tasks and Channels ...13
3.1.1 Internal and External Communication ...13
3.1.2 Step 4 Stops ...15
3.2 Previous Reporting ...17
3.2.1 Tickets – Former Metrics ...19
3.2.2 Step 4 Stops – Former Metrics ...20
3.3 Final Overview ...21 4 Project Implementation... 22 4.1 Requirements Gathering ...22 4.2 Daily Reporting ...23 4.2.1 New Metrics ...23 4.2.2 Tableau Dashboard ...26 4.2.3 Visualization Features...29
4.3 Executive Weekly Reporting ...32
4.3.1 New Metrics ...32
4.3.2 Tableau Dashboard ...34
4.4 Individual Reporting ...39
4.4.1 Hourly Workload Dashboard ...39
4.4.2 Individual Performance Dashboard ...41
4.5 Main Achievements ...42
4.5.1 Improved Results ...43
4.5.2 Workforce Planning Foundations ...45
5 Conclusions and Future Work ... 48
References ... 51
APPENDIX A: SQL Queries ... 54
APPENDIX B: Hourly Workload Dashboard ... 59
APPENDIX C: Individual Performance Dashboard ... 60
Acronyms
WFM – Workforce Management KPI – Key Performance Indicator SLA – Service Level Agreement RR – Response Rate
AVG – Average
CPO – Contacts per Order VPN – Virtual Private Network DS – Delivery Support
FF – Farfetch
List of Figures
Figure 1 - Farfetch's Structure ... 2
Figure 2 - WFM Cycle ... 3
Figure 3 - Delivery Support Team Structure ... 4
Figure 4 - (a) Composition of worker’s time. (b) Effect of an increase in working hours. (c) Effect of Kaizen on composition. ... 10
Figure 5 - Communication Tool: Ticket Interface ... 14
Figure 6 - Status Change Options ... 14
Figure 7 - Communications Tool: Main Area ... 15
Figure 8 - Farfetch Order Process ... 16
Figure 9 - Delivery Support Kaizen Board ... 17
Figure 10 - Source of Tickets' Insights ... 18
Figure 11 - Dashboard with Main KPIs ... 18
Figure 12 - Daily Dashboard ... 27
Figure 13 - Daily KPIs Table ... 28
Figure 14 - Evolution and Categorization of the KPIs ... 28
Figure 15 - Step 4 Stops Analysis ... 29
Figure 16 - Hierarchy Grouping Example ... 30
Figure 17 - Data Parameter Example... 30
Figure 18 - Last Update Date ... 31
Figure 19 - View Data Example... 31
Figure 20 - Executive Weekly Dashboard ... 35
Figure 21 - Exceptions Weekly Evolution ... 37
Figure 22 - CPO Weekly Evolution... 37
Figure 23 - Sales value in terms of tickets ... 38
Figure 24 - Step 4 Stops Workload ... 39
Figure 25 - Oldest Ticket Example ... 40
Figure 26 - Agent's Oldest Tickers ... 41
Figure 27 - Individual Performance Table ... 42
Figure 28 - SLA / RR Improvements ... 44
Figure 29 - Improvement on the % of Tickets Reopened ... 44
Figure 30 - Hourly Evolution of the Workload ... 46
Figure 31 - Monthly Evolution of the main Metrics ... 46
List of Tables
Table 1 - Project Schedule ... 5 Table 2 - KPIs Summary ... 43
1 Introduction
Buying clothes online represents today more than a simple commodity. This kind of practice is starting to become a must-have service for any luxury client. The popularity of e-commerce is growing due to the emergence of the Internet, which allowed online selling companies to create a wide set of potential customers.
Merging the traditional habits of luxury boutiques with the new technologies is not an easy task, especially when the physical interaction between the customer and the selling item is no longer present. However, companies like Farfetch have been very successful joining these two different realities: luxurious clothing and online virtual shopping.
Given the high impact that the support teams currently have on the luxury e-commerce companies, measuring and controlling the human capital represents a critical task. Hence, the Workforce Management has to face today tough challenges in order to efficiently improve the quality of the work of these teams.
This dissertation was developed within the Workforce Management team of Farfetch and aims to develop a model for the measurement and control of the Delivery Support team activities. Companies working on this business area need to ensure a good service level concerning the delivery of the goods. Hence, managing the workforce is a must in order to achieve the desired results.
1.1 Workforce Management at Farfetch
Farfetch is one of the most successful e-commerce companies in the world, connecting over 400 luxury boutiques with a wide range of customers spread around the planet. The company is on the market since 2008 and keeps growing year after year, mainly because of the high level of differentiation and market competitivity.
The revolutionary business model of Farfetch is the reason for all the success: creating one single online channel to connect autonomous boutiques with luxury-driven customers. This offers a unique way of selling items with zero inventory risk. In this business model, both end customers and boutiques are Farfetch’s customers, and the key strategy is, at the same time, to capture the maximum number of clients to buy the products online and to create partnerships with new boutiques that can bring more value to the company.
All the products sold through Farfetch website are owned by the boutiques. These items, when purchased online, will be collected by a specific courier and delivered to the customer in a given location: at the customer’s home or at a pick-up point.
The company’s profit comes from a commission per sale, providing the boutiques with a complete e-commerce service and brand recognition. Farfetch offers a full set of solutions, including the purchasing process, fraud check and customer support service.
At the moment, Farfetch operates in seven different countries: Portugal, United States, United Kingdom, Russia, Japan, China and Brazil. The Porto office, where this dissertation was developed, employees more than 600 people at the moment, and is divided in the following departments: Account Management, Black & White, Business Development, Customer Service, Finance, Marketing, Merchandising, Office Management, Operations, Partner Services, Human Resources, Technology, Production and Store of the Future.
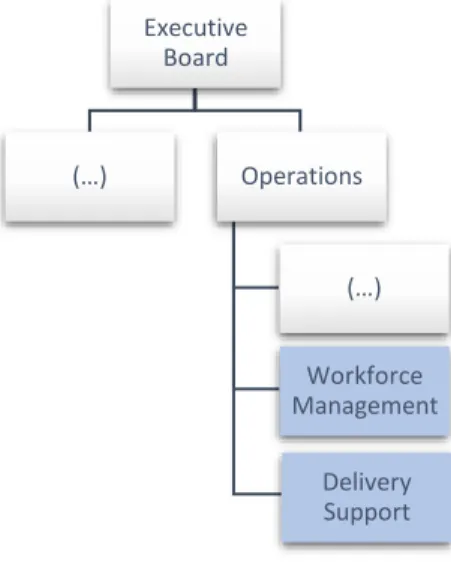
During the development of this project, two teams were involved: Workforce Management and Delivery Support. Both teams belong to the Operations department of Farfetch, as illustrated in the following diagram:
Figure 1 - Farfetch's Structure
Every day, Farfetch agents need to solve problems related with delayed deliveries and many other issues associated with the transportation of the luxury items between boutiques and customers. Hence, the Delivery Support team represents a key part of the entire communication process, directly with the couriers and indirectly with the clients (through the department of customer service). Every decision made by these agents and the way they execute their tasks have a huge impact on the service level, affecting the company global performance.
Taking into account all the effects that the work of these agents may have, it becomes a top priority to help control their work and measure their collective and individual performance. With the previous objective in mind, this project puts both Workforce Management and Delivery Support teams working together to achieve better service level results. The WFM team represents the best choice for this task due to the vast experience in supporting other teams, in particular the customer service and partner service departments.
At the beginning of the project, the numbers used to measure the performance of the agents came from a daily report extracted directly from the tool used for internal and external communication. The methodology used to calculate these numbers is not clear, which generates a lot of doubts regarding the use of these reports as a reliable source. Furthermore, many tasks performed by the team are executed outside the integrated communication tool, and some of them are not even being properly measured. These two difficulties represent the main improvement opportunities in an initial phase of the project, whose concrete objectives are: replicate some of current Key Performance Indicators and create new ones, using a truthful source and known criteria; find a way to measure the performance of the tasks that currently do not have any kind of tracking and translate it into numbers.
Mixing the best tools with the right decisions makes the mission for this project become clearer: start from scratch and build a new framework to help the Delivery Support team, taking advantage of some of the main standard metrics of the WFM team and building new ways to measure specific tasks that have a great impact on the service quality.
1.1.1 Workforce Management Team
The Workforce Management at Farfetch represents a support to other teams within the organization. At the beginning of this project, the WFM team was mainly working with the customer service and partner services departments. Hence, the development of this dissertation represents a new connection and development area for WFM, in this case with the Delivery Support team. Executive Board (…) Operations (…) Workforce Management Delivery Support
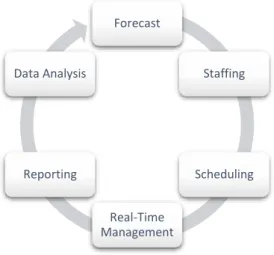
The WFM team is responsible for multiple tasks, as it is possible to observe in the next figure. A more developed analysis on this topic is made in the literature review (section 2).
Figure 2 - WFM Cycle
The tasks presented on the WFM cycle are the following:
• Forecasting: the first step is to analyse historical data, which normally comes from the data analysis, and try to find trends and patterns that can be helpful to build the forecasting model;
• Staffing: based on the forecasting model, it is necessary to build a staffing plan, specifying the recruitment needs for the different positions;
• Scheduling: after selecting the right agents and locations to execute the work, arises the need to allocate each one of them to specific tasks and create the most efficient working agenda;
• Real Time Management: supervising the agents in real time allows the identification of possible scheduling gaps and offers quick solutions to solve them. This represents an opportunity to create a balance between workload and staffing, in a short-term viewpoint; • Reporting: the reporting allows the creation of awareness over all the metrics and
organization objectives;
• Data Analysis: the cycle ends with the analysis of the relevant data. This is also the task that feeds the forecasting and builds a bridge between the end of a cycle and the beginning of a new one.
The WFM team structure in Farfetch is composed by: the global director, head of global WFM, tools admin expert, data analysts, forecasting expert and real-time supervisors. The majority of the team members are currently working in the Porto office, with the exception of three: two of them in the United States and one in China.
1.1.2 Delivery Support Team
The Delivery Support team is responsible for all the communication between Farfetch and the courier companies that deliver the goods to the customers. The main tasks performed by the team help to create communication channels between Farfetch and the couriers in order to solve every kind of shipping-related issue.
Delivery Support works closely with the Delivery Development team, a different section of the operations Delivery department. While the Delivery Support team deals with shipping issues,
Forecast Staffing Scheduling Real-Time Management Reporting Data Analysis
the Delivery Development team is responsible for studding new routes and choosing the best couriers to deliver Farfetch’s items.
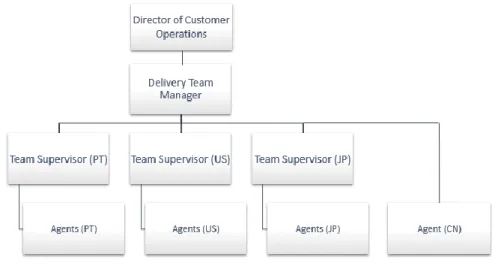
Currently, Delivery Support agents are distributed by four countries: ten agents in Portugal, four in the United States, three in Japan and one in China. This division is shown in the diagram below:
Figure 3 - Delivery Support Team Structure
A deeper analysis into this department shows that all the activities performed in cooperation with the other departments can be translated into the following mission: solving delivery issues and providing 24-hour support worldwide. Many issues may occur in the transportation process: lost shipments, wrong addresses, missing documents and delayed shipments are some of the main difficulties that need to be handled by the agents every day, in order to offer the best possible service to the client. Regarding the main services provided, the team is responsible for guaranteeing same day delivery, collect in store, overnight delivery, yatch delivery services and other kind of services.
The current number of agents working in the Japanese and Chinese offices is low but it is expected to increase over the next months, due to the fact that these two markets have been growing in sales over 100% per year, and forecast indicates that this growth will continue in the future. Besides this, Russia is another country that has been showing an increased order volume, which indicates that it is very likely for the team to have agents working there in the near future.
1.2 Project scope, methodology and structure
The main purpose of this project is to provide the Delivery Support team with the appropriate reporting structure to help measure the team performance. The project contains three major objectives:
• Build a framework in order to measure the performance on a daily basis, to support the agents and give feedback about their work;
• Create dashboards that display results by week of work, to be used mostly by supervisors and managers, and help to manage the team in a more strategic way; • Build tools to evaluate and give feedback about every agent’s individual performance. This project represents the first interaction between the WFM team and the Delivery Support team, and represents at the same time the initial step for the long-term connection among them. Therefore, Farfetch aims to use this project as an opportunity to create a strong connection
between teams and keep the partnership with future works related not only with controlling but also with planning of the workforce for the Delivery Support team.
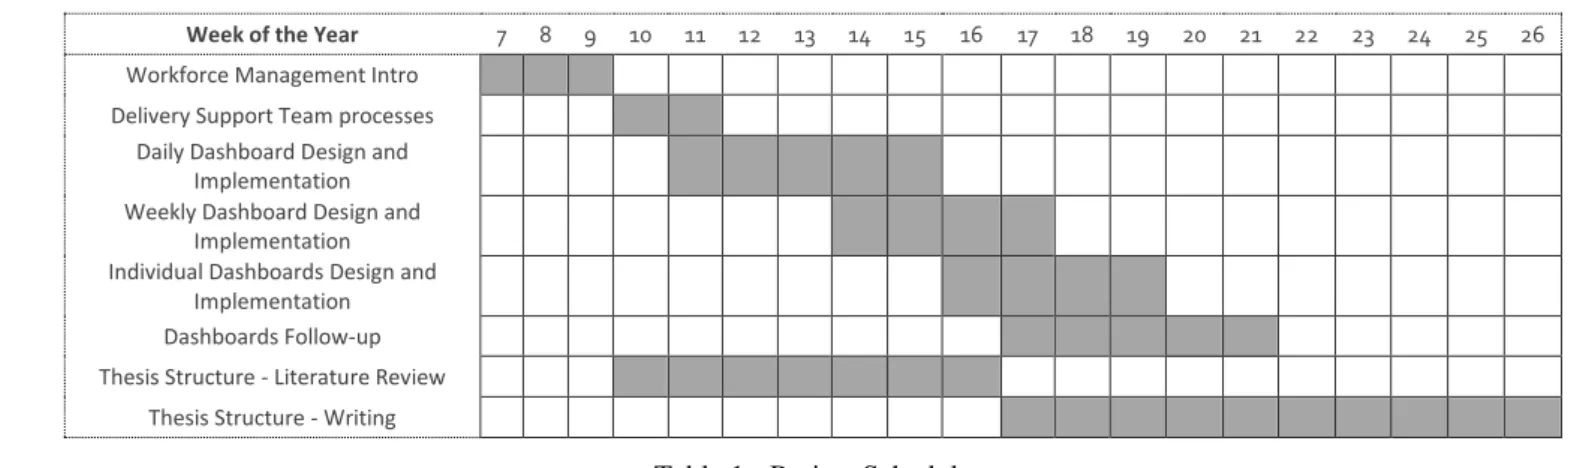
Chronologically, the first step for this project starts with the necessity to learn how both Workforce Management and Delivery Support teams currently work. For the WFM team, it was critical to start understanding the main processes and metrics used in the daily support that were already implemented to other teams (exploring the most recent work and replicating some of the existing dashboards to get used with the tools). Regarding the Delivery Support team, gathering information and learning about the processes was only possible with the help of every agent that spared some time to describe their main tasks during a normal working day. This introduction allowed a better understanding regarding the way everything works and was essential to come up with the best solutions to efficiently measure the work being done. After gathering the necessary information about all the practices and processes, the second step was to start building the dashboards, extracting the data from the databases and organizing the numbers based on the design established. In the end, the last step was to validate the structure and metrics used, receiving important feedback from multiple team members that helped improve the quality of the final work. The project’s schedule is illustrated in the following diagram:
Week of the Year 7 8 9 10 11 12 13 14 15 16 17 18 19 20 21 22 23 24 25 26
Workforce Management Intro
Delivery Support Team processes
Daily Dashboard Design and
Implementation Weekly Dashboard Design and
Implementation Individual Dashboards Design and
Implementation
Dashboards Follow-up
Thesis Structure - Literature Review
Thesis Structure - Writing
Table 1 - Project Schedule
In terms of report structure, this dissertation is divided in the following way:
Chapter 2 presents a literature review that supports this report with important research information, useful for the implementation of the project. The main topics explored were: Workforce Management, Luxury E-commerce, Kaizen, Dashboards and KPIs.
Chapter 3 identifies the current situation of the Delivery Support team, mainly in terms of old reporting and KPIs, putting together all the problems found and describing how the action plan for this project was built.
Chapter 4 shows in detail every tool developed during the project, describing step by step how they were built and how they can add value to the company. This chapter also clarifies the necessities that these tools were able to support and how they were used.
Finally, chapter 5 finishes the report with the conclusion of the project, providing the main results obtained and comparing them with the initial objectives of the company. Also, it is mentioned the necessity for future work, because the project represents only the first phase of a long-term partnership between both teams.
2 State of Art
Service-orientated companies now-a-days occupy a large slice of the international market, forcing managers and other senior management leaders to develop new strategies in order to obtain efficient and sustainable businesses. While capital-intensive companies rely on cost and time reduction strategies due to the high volume on machinery used in production, labour-intensive companies have to bet on a more complex and sensitive policy due to the fact that the majority of the working hours have a big dependency on human labour (Kianto, Hurmelinna-Laukkanen, and Ritala 2010).
The Workforce Management represents a crucial department inside any labour-intensive company that seeks good results, because the main focus of this team is to efficiently achieve the objectives while fulfilling all the restricted requirements and needs of a human labour based company (Kassem et al. 2012). The emerging e-commerce businesses are one good example of this type of company, whose main processes rely on human labour that have a big impact on the performance.
Measuring the way people work is not an easy task due to the complexity of translating each person’s actions into numbers. Building some good visual tools to display this kind of information, like for example dashboards, is indeed critical, as well as choosing the right KPIs to measure the performance (Bauer 2004). Adding to this, it is also important to know how to share this information, improve the communication and connect personal goals with company’s objective. To fulfil this last principle, Kaizen methodology appears as a major instrument that contains all the tools needed to connect people inside teams and improve communication between departments (da Costa 2014).
This chapter addresses some of the main topics presented in the previous description, namely: Workforce Management, Luxury E-commerce, Kaizen, Dashboards and KPIs.
2.1 Workforce Management
Any company that seeks to deliver a high quality service to its customers’ needs to know how to manage the human capital, choosing which available employee gets assigned to a specific task (Kassem et al. 2012). Workforce Management is a procedure aligned with the company’s mission, goals and objectives that allows the analysis of the present workforce and helps determine the future requirements (An et al. 2007). WFM represents an important factor to all the operational and decision making activities that are necessary to keep a productive workforce and to handle the available resources in an efficient way (Cimitile et al. 2012).
Many of the daily human resources actions are directly influenced by WFM, including recruitment, compensations, training and performance administration (An et al. 2007). These human resources are the ones that deliver the company’s services and represent the workforce. In a first approach, the processes handled by WFM are divided in two distinct stages: workforce planning, in charge of predicting the demand and building a forecast for a specific period of time; workforce scheduling, which assigns the available human capital to the existing jobs based on the previous plan (Kassem et al. 2012). The WFM cycle is only complete with the addition of an intermediate phase that stays between the planning and the scheduling: data analysis. In order to attend to the necessity of quick and efficient decision-making, WFM can use database information to build well-defined tools that help the company manage different areas of performance (Cimitile et al. 2012).
In order to optimize the usage of the available workforce and achieve high levels of service, planning is a crucial phase for any organization that should always rely on a well-structured forecast model. Human hours represent one of the parameters with the most impact in the performance of a company that delivers services to its clients. Hence, the forecasting should
take into account absenteeism and other types of unpredictable events related with human workforce, in order to avoid workload spill over and low customer service levels (Shah et al. 2007).
The scheduling and staffing phase for WFM represents a multi-dimensional problem that includes employees’ skill and allows space for lunch breaks, short rest breaks and other minor stops (Kuo, Leung, and Yano 2014). During the scheduling stage the team is able to create an agenda that displays when each employee works over the scheduling horizon. Following this schedule there is a real-time adjustment phase that is responsible for taking actions based on actual demand (Wright, Bretthauer, and Cote 2006).
Quantitative methods are being used to capture information directly from databases and allow agents and team managers to identify and analyse key performance indicators. These powerful insights are valuable to keep track of employees’ performance, and can be used either to improve their current training courses or to help choosing the right people during the employment process. Taking advantage of analytics in WFM allows companies to learn how to invest money on human capital (Nienaber and Sewdass 2016).
One of the major difficulties for organizations emerges with the need to hire and dismiss workers, in order to keep following the main goals and objectives. Hence, it becomes crucial to use human capital metrics to measure the effects that the investment on the companies’ workforce has and how it influences the organizations performance (Nienaber and Sewdass 2016).
Companies that are service-oriented see labour expenses as a major cost due to the type of business in which they operate. Adding to this cost concern, there is also the need for a competitive edge: in order to obtain a competitive advantage, it is critical to maintain a well-skilled workforce, and at the same time to keep the costs low with the maximal profit margin possible (An et al. 2007). However, working towards a more effective workforce model may add additional costs in other areas. This justifies the need to always examine the impact that multiple objectives may have in the decision-making, concerning the resources (Smilowitz, Nowak, and Jiang 2013).
Therefore, Workforce Management represents a critical instrument for any service-oriented business that seeks success. Luxury e-commerce is an example of this kind of business, whose main focus is the human capital: selling expensive and luxurious clothes online requires a high-quality service level, concerning both customer and order support. This specific type of company is addressed in the following topic.
2.2 Luxury E-commerce
Luxury is a concept that means more than a simple product or service. The real definition of luxury includes having an identity, a philosophy and a culture. These attributes translate into challenges in the union between luxury brands and the digital platforms, requiring a unique relationship to obtain good results (Okonkwo 2009). The Internet became a vital channel for any organization to reach customers and luxury brands are no exception. Luxury goods and services are more accessible and the distance between the client and the product is now within a simple click (Radon 2012).
Some luxury brands keep finding barriers with the idea of exposing themselves online, arguing that retaining desire and exclusivity is a difficult task in a classless online world. This big world always brings a mass customer base, which creates another difficult task to luxury brands that are used to target specific niches of customers. Another big concern is related with the lack of physical contact with the products, which puts aside the effect that human senses like the vision, smell and touch have during the purchase. Despite this negative ideas, the reality is that luxury
brands have been successful with online selling platforms, which represent one of the fastest rising distribution channels (Okonkwo 2009).
E-commerce, as a theoretical definition, means the use of a web platform to sell products or services that offers clients the option to make the purchase and payment online. With this tool, the organization can easily arrange the product delivery: electronically, in case the product is digital; through substantial delivery methods using couriers, in case there is a physical product (Wilson and Abel 2002). The online platforms offer a very dynamic opportunity for companies to create new communication channels in order to access customers and deliver the goods (Ricker and Kalakota 1999).
Business-to-consumer (B2C) e-commerce has been growing in the last years due to the increasing number of people that have now-a-days access to the internet from their homes. Customers seek to find an online platform that allows them not only to find the right product in a fast and simple way but also to perform the payment in a secure and comfortable way. It is critical for any organization to deliver a service that fulfils these needs, building the web site thinking about the necessities of the target market and always providing the right amount of information about the products that are being sold (Oppenheim and Ward 2006).
2.2.1 Luxury customers
The Internet represents a path that companies with online platforms use to connect their products and services with the final consumer. This path can be used as advertising channels, ordering processes and customer support (Chaudhury, Mallick, and Rao 2001). Taking into account the big difference between an online and a conventional marketplace, the best option that today’s organizations have to capture clients is to create a strong relationship with them based on trust. Hence, it is imperative to reduce the levels of risk during the entire user’s web experience. Studies suggest money back policies, positive “word of mouth” and solid partnerships represent some of the top options tactics that organizations should use to increase the levels of perceived trust (Corbitt, Thanasankit, and Yi 2003).
Following the previous idea of customer trust in an Internet vendor, (Chen and Dhillon 2003) adds that organizations must keep the following dimensions: competence, integrity and benevolence. The first one translates the capacity that the organization has to deliver promises made to the customers. Integrity means honesty and reliability covering all the interactions with the final consumer. The last one indicates the capacity to keep customers’ expectations high and to show concern for their satisfaction, creating customer retention.
Luxury customers buy exclusive and expensive goods in order to distinguish themselves. Husic and Cicic (2009) says that these luxury consumers act the same way around the globe, and the decision to acquire luxury products happens because these rare and classy items indicate respect and prestige.
Given the distinct taste of luxury buyers and their preference for personalized service and tactile shopping, many people thought that luxury e-commerce would always be an unsuccessful business. This way of thinking changed a lot recently, and today’s studies show that consumers are keen on buying luxury items online. Digital tools are transforming the luxury-goods business and forcing almost every luxury organization to use online platforms in order to expand brand visibility and increase sales volume (Dauriz, Remy, and Sandri 2014).
2.2.2 Logistics and delivery support
The number of new opportunities for customer access raises with the presence of online platforms, but new challenges also appear for product fulfilment. Logistic questions related with the picking, packaging and shipping represent a core element of the delivery service and have a direct impact on the success of the supply chain (Ricker and Kalakota 1999). Discovering
the right supplier to fulfil the supply chain requirements is a tough task, demanding studies for product’s needs in terms of quality, price, and route tracing. E-commerce applications simplify this kind of research, sparing a lot of time and money and promoting online trades with the reduction of barriers that the traditional methods normally have (Terzi 2011).
The fast growth and big effect of e-commerce had a large impact on logistics that changed significantly compared to that of several decades ago. This modern logistics became an important tool to transform the efficiency of the material flow and reduce delivery costs, contributing to the expansion of the delivery market and promoting new technologies (Yu et al. 2016). Giving this fast growth and, at the same time, the tendency of the worldwide economic evolution, the supply chain becomes highly competitive, forcing organizations to create fast adaptation strategies (Ying and Dayong 2005).
The fast purchase and responsive order fulfilment required for e-commerce today forces companies to create a dynamic supply chain, capable of offering flexibility, due to the constant changes that may occur linked with suppliers, customers, trading partners and even competitors (Nissen 2000). For an organization surrounded by an e-commerce environment, third-party logistics represent an important key to connect customers with the company and deliver the goods. This third party is in charge of the entire logistics design, taking care of the storage, transportation and deliver of the products (Ying and Dayong 2005).
In terms of customer satisfaction and loyalty, there are a lot of factors related with logistics that can affect the feeling that the final consumer has in terms of service delivered. Following Lin et al. (2016), in an e-commerce context, logistics service and e-service quality have a high impact in customer satisfaction. When the delivery channel and the retailer are two distinct organizations, the effort to keep a high-quality service should always be made by the two entities at the same time in order for the customer to receive a full quality experience. In case one of the two fails, the quality of the service is automatically compromised.
Establishing strategic objectives and sharing information about individual and collective goals is not an easy task, requiring a good level and communications and tools that allow people to share information. Kaizen offers enough tools to create channels that fulfil these requirements and allow efficiency creation. Continuous improvement is a fundamental key for success.
2.3 Kaizen – Continuous Improvement
The Kaizen philosophy aims to increase the productivity of a company, always using the available resources in an efficient way. According to da Costa (2014), a Kaizen Management System uses the following main processes:
• KMS philosophy principles: the company should have a good process control and bear in mind a culture of continuous improvement;
• Types of waste: characterized by the Japanese word MUDA. The Kaizen philosophy stands for zero waste, eliminating everything that doesn’t bring value to the company; • 5S Methodology: the importance of having a good organization around every
workstation. Discipline helps to increase efficiency.
• Normalization: procedures that standardize the best way of handling specific jobs or tasks. Finding the best and quickest way of working creates more value for the company in every aspect.
• Visual Management: the use of images to share important information (security rules, performance indicators, etc.)
The interest in continuous improvement has been growing during the last years, and companies are keen on developing a strong culture around concepts like lean or TQM (total quality
management). Continuous improvement, as the designation suggests, stands for an approach that improves company’s performance, in an incremental way, with the main focus on the results for each one of the small steps along the way. A special attention should always be given to the company’s capacity for future improvements (Irani and Sharp 1997).
Implementing a continuous improvement philosophy is not an easy task, because everyone should imagine it as an attitude and a culture, not only as a simple tool. According to (Manos 2007), the implementation of lean in the daily jobs and company processes should be divided in three phases: (i) Lean leaner – understanding the simple tools (for example, lean, MUDA, 5S and visual management). (ii) Lean achiever: start using the previous instruments in the company and keep implementing more complex tools (for example, TPM – total productive maintenance). (iii) Lean thinker – start treating everyday situations from the lean perspective. Increasing the number of value-added activities inside an organization should be accomplished with the reduction of waste, and not with an increase of the working hours. Figure 4 explains the difference between these two approaches: increasing the working hours (Figure 1 (b)) represents a bad strategy, because the process of achieving the goal also increases the incidental work and MUDA; cut down the volume of incidental work and MUDA, improving processes by identifying and reducing the amount of waste (Chen, Li, and Shady 2010).
Figure 4 - (a) Composition of worker’s time. (b) Effect of an increase in working hours. (c) Effect of Kaizen on composition.
2.3.1 Daily Kaizen
Daily Kaizen is a very common practice inside Kaizen philosophy that is composed by a quick meeting near a white board where all the elements of the team have time to share information with the other colleagues. The information on the white board should include the most important performance indicators that are chosen depending on the areas where that team normally takes action (da Silva Afonso 2012). All these metrics are used to improve the team work and should be seen as a good opportunity to increase transparency and managing performance. The use of a better daily or weekly planning allows team projects not only to become more effective but also to acquire a high level of adaptability. In order to achieve these goals, the Daily Kaizen should be supported by different individual and/or collective steps, tasks and milestones (España, Tsao, and Hauser 2012).
All the members of the team should be present during a Kaizen meeting, including the managers that are essential to help analyse the indicators’ values and to identify the main problems and
accomplishments of that day. The focus of the meeting should always be identifying the value that every worker is delivering to the company and also what should be done collectively and individually to keep improving the results (Dias 2012). Concerning the team, this meeting improves communication between all the members and avoids incidents that sometimes occur due to the lack of organization. After the quick reunion, every element should understand all the tasks and objectives for the day and feel motivated to achieve the main goals (da Costa 2014).
In order to successfully implement Kaizen methodologies, an efficient way of showing information should be present. Thus, designing complete dashboards with key metrics is essential. These dashboards should be carefully built because they are responsible for showing to all members of the company the main numbers and performance results for a given period, and the message must always be objective and clear to everyone.
2.4 Dashboards
Dashboards represent a powerful tool that organizations can use to display information, with a high level of personalization and dynamism in terms of data visualization (Few 2006). The main purpose of this instrument is to respond to the high complexity of available data: trying to organize it and at the same time simplifying its analysis. Taking into account this key objective, dashboards can be defined as a small group of organized key performance indicators and performances drivers that translate either short or long term interests for the company or a specific team inside the company (Pauwels et al. 2009).
The information displayed in a dashboard is normally presented with a significant number of visual elements. Generally, this representation is supported by a combination of text and charts, but with a special focus on the latter: dashboards are notorious by the high graphical presence because the use of this kind of instrument, when done skilfully, offers a better efficiency in terms of communication and representation of the data (Few 2006).
Visualization tools like dashboards increase the span of control around a lot of business data. Through the analysis of this data, people can identify possible trends, patterns and irregularities, guiding them on the right way to find important decisions (Brath and Peters 2004). To achieve the goals and discover these decisions, sometimes it is necessary to put together data that comes from different sources that normally is not related. The versatility of dashboards allows analysts and data experts to join this non-related data and create instruments that can help anyone inside the company guide their work and achieve specific objectives (Few 2006).
The main focus of a well-build dashboard should always be the user. Every person, from a senior manager to an analyst, needs access to decent and well-organized information, and that’s why this tool must offer a solid design with the right metrics and right visual elements. Furthermore, all dashboards show a unique visual design because there is no secret formula to create the perfect project. It is very uncommon to find a dashboard profile that will answer perfectly to someone’s needs, since each particular situation needs specific requirements that in the end will contribute in an exclusive way of adding value to the company (Brath and Peters 2004).
2.4.1 Key Performance Indicators
Key performance indicators represent one of the most important elements present in a data dashboard. It is important to have this kind of measures for performance in order to identify gaps between current and desired performance and at the same time to show the development made to close those gaps (Weber and Thomas 2005). Choosing the right KPIs to use allows companies to measure the business health and guarantee that every member of the organization is well-guided towards the common objectives of the main strategy (Bauer 2004).
The process of building the dashboard and choosing the right metrics starts with the capture of all relevant data needed to calculate every KPI. Gathering data from different tables in a complex database requires a lot of technical SQL skills and detailed knowledge about the table’s structure. After choosing the best design for the dashboard and completing the query to retrieve the required data, it is necessary to schedule a refresh calendar, in order to ensure that the content of the dashboard is up-to-date (Orts 2004).
Taking a more strategic look at these metrics, choosing which KPIs should be used is not a simple task. According to (Bauer 2004), in order to select a good collection of metrics, it is important to take into consideration the following criteria: having the available data to calculate the KPI; be able to balance the short- and long-term objectives; guarantee that the selected KPIs are important business drivers; making sure that the chosen metrics help the organization create value as a whole and not only a local optimization.
In short, key performance indicators have to originate from the company goals and aim at improving the business performance in order to pursue excellence. (Shahin and Mahbod 2007) also adds that choosing the best KPIs involves using the “SMART” rule: every KPI should be Specific, Measurable, Attainable and aggressive, Realistic and result-oriented and also Time-sensitive.
3 Delivery Support Team Situation
The rapid growth observed in Farfetch over the last years is easily translated into an increase volume in the number of new clients, new boutique partnerships and order volume received every day. With the increase on sales volume and user interactions, there is also an increase in the number of order processing problems. Adding to this, the agents working for the Delivery Support team experience now a larger variety of transportation related problems, mainly due to the new services that have been implemented by the company in order to create differentiation and amaze customers.
With this increase on the volume and complexity of the work, it gets harder to maintain a high-quality service for the customer and at the same time achieve a good performance level, both collectively and individually. These difficulties justify the need for a more careful analysis and monitoring of the agents’ work in order to create process stability and better response to Farfetch fast pace growing and constant change.
All the difficulties explained before led the WFM team to create this project, in order to start building tools to help monitoring and controlling the performance of the Delivery Support team. The WFM team became responsible for full monitoring in terms of daily and weekly reporting and deep analysis on the team’s performance evolution. The insights provided are useful to efficiently allocate team agents to specific tasks and to create a future long-term planning for staffing needs.
At the start of the project, the team had a total of 18 agents: 10 of them in Portugal, including the supervisor; 4 in the United States, including the supervisor; 3 in Japan, including the supervisor; 1 in China. The main purpose of this strategic distribution is to try to cover all the different time-zones and deal with specific tasks that only agents in a given location are able to handle.
3.1 Delivery Support Tasks and Channels
The main tasks performed by the Delivery Support agents are always related with transportation issues, and all of the communication, both internal and external, is made through a cloud tool where each of the issues that are being dealt with represent a ticket. A ticket is very similar to an email: when the ticket is opened, all the interactions being performed take place in a small window, where the user can reply and/or see other replies for that same ticket and interact with some other specific fields. Hence, each one of these tickets represent a discussion between two agents from two different teams allowing them to share important information in order to solve the issue that generated the ticket creation.
Although the majority of the work is performed inside the communication tool represented by the tickets platform, there is another critical task done by the agents that is performed outside the platform. The issue that causes this task appears when some of the orders of the company unexpectedly stop in one of the steps of the normal order processing sequence. Due to this particularity, the way the data is extracted to calculate the metrics for these two types of tasks is completely different. Concerning the order stops, the name created to identify tasks related with this issue was Step 4 Stops. This denomination was implemented by members of the Delivery team because it allows a better and easier communication about the issue within and between departments.
3.1.1 Internal and External Communication
All the tickets created in the online communication tool are used to exchange information about an issue with both internal and external teams. The majority of the internal communication is performed with these two teams: customer service, which serves as a bridge between the
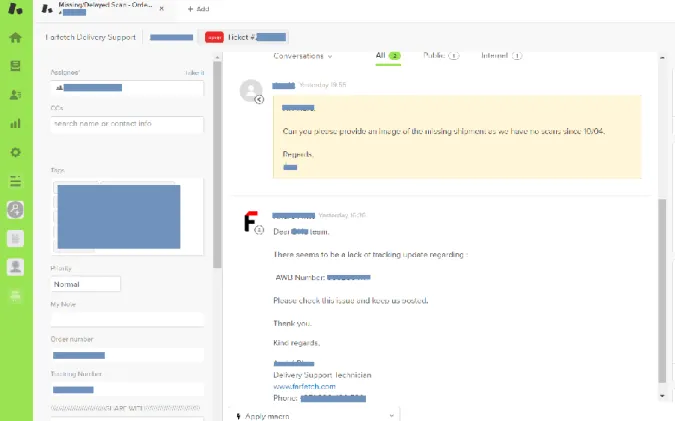
Delivery Support agents and Farfetch customers; partner services, which is responsible for the communication with the boutiques. Regarding the external communication, the Delivery Support agents keep interaction with all the courier companies that Farfetch works with and that are responsible for delivering the orders to the final client. An example of the tickets interface is shown on Figure 5.
Figure 5 - Communication Tool: Ticket Interface
When a new ticket is created, a new window pops us in order to exchange messages between the two entities involved. The main window’s area of the ticket contains the title, subject and all the replies, ordered by date. On the side, several fields related with the issue are presented, in particular the category of the ticket that helps to identify what kind of problem the agents have in hands. Some other important fields also presented are: the assignee, which represents the agent responsible for handling that issue; tags, helpful to categorize and group tickets for analytical purposes; order number, to identify which order originated the ticket.
A very important feature present on this platform is the ticket current status. This status allows agents to know if the ticket is completely new, if it was already solved or if is being handled by someone inside or outside the team. The different status change options are shown in the following figure:
Figure 6 - Status Change Options
The description of each one of the possible status is the following:
• New: this status represents a ticket that was just created and there is neither a first reply nor an assigned agent;
• Open: a ticket with an assigned agent and waiting for his/her attention;
• On-hold: a ticket assigned to an agent but that is waiting for an interaction from other member (internal answer), in order to proceed with the problem resolution;
• Pending: a ticket in a similar situation as the previous one, but in this case the assigned agent is waiting for an external answer;
• Solved: a ticket whose situation was resolved with success and the agent that solved the ticket does not expect any more interactions. This ticket can be reopened within 30 days after being solved, in case something new related with the previous problem arises and the agent’s attention is needed again;
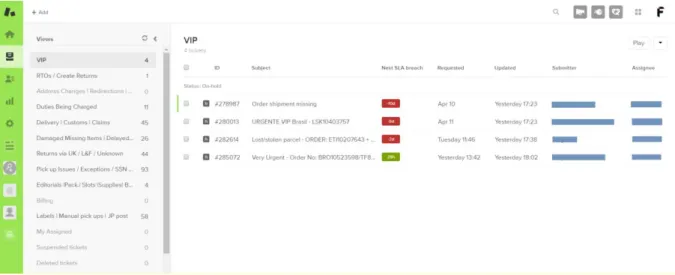
• Closed: in case the solved ticket stays 30 consecutive days without any kind of interaction, the status becomes closed and the ticket is no longer available to work on. In the eyes of an agent, the interface that they normally use to guide the work throughout the day is the main window shown in the tickets platform. This window shows all the tickets assigned to the Delivery Support team, which currently are divided by different views to help identify the type of the ticket and distribute the workload by the agents. Figure 7 shows the main area of the communication tool.
Figure 7 - Communications Tool: Main Area
With this distribution, each one of the agents can filter and select tickets that are assigned to them and keep track of the status and date of the tickets. More than that, they can select any of the present views and work with a specific type of ticket.
3.1.2 Step 4 Stops
As introduced in this chapter, in addition to the online communication tool, there are also other activities performed outside the platform that occupy a significant percentage of time in a normal working day.
The majority of these tasks, named internally as “Step 4 Stops” arise when some orders that normally are sent from Step 4 to Step 5 automatically, on the Farfetch order processor, unexpectedly stay locked in Step 4, requiring manual work.
Figure 8 - Farfetch Order Process
The steps from the moment the client places the order online to the moment it is delivered at the shipping address are:
Step 1: Check Stock – the boutique is responsible for checking if the requested items are available and ready to ship. In case the chosen boutique fails to have the items available, due to some delay or anomaly in the system, the algorithm automatically selects a second boutique to recheck the item’s availability. In case both boutiques fail to have the items in stock, the order is cancelled and the client is refunded.
Step 2: Approve Payment – Farfetch has a fraud team ready to filter the orders and make sure that all fraudulent orders are cancelled on time. A whitelist of customers represents a parcel of the orders that are automatically approved, due to all the previous successful orders. On the other hand, there is also a blacklist of fraudulent customers that have their orders automatically cancelled. In case a new client appears, the fraud team attempts to gather all the possible information about the customer (online, through phone calls or email) in order to decide either to approve or cancel the order.
Step 3: Decide Packaging – the boutique decides the package that should be used to send the items to the client, bearing in mind all the restrictions and advices given by Farfetch.
Step 4: Create Shipping Label – the label required to ship the item is created in this step. If everything is correct, the shipping label is created instantly and the order is moved to Step 5 by the system. In case there are some problems related with the shipping info or with legal restrictions, the order stops in this step until the agents from the Delivery Support team manually deal with the issues and send the order to Step 5.
Step 5: Send Parcel – the items are ready to be sent. During this step, in case there is some problem either with the boutique or the courier, an exception is created and the order needs to wait until it is ready to be sent.
Step 6: Parcel in Transit – during this step, the order is being shipped and expected to be delivered in a given location. Even with the parcel in transit, the order can be cancelled by the customer, fraud team or boutique, returning to origin.
Step 7 and 8: Collect in Store/ Ready to Collect – these steps represent the final stage of the order, when it is finally delivered to the customer.
With the previous description of the order process, it becomes even clearer the importance of measuring the performance of the agents when dealing with issues of Step 4 Stops that currently represent approximately 5% of the total Farfetch orders.
3.2 Previous Reporting
During the initial phase of the dissertation and throughout the analysis of the team’s daily routines, the conclusion about available reporting was that the only source of performance insights accessible and used by both supervisor and agents was the Kaizen Board and the two reports that support it. The Kaizen Board is displayed on Figure 9.
Figure 9 - Delivery Support Kaizen Board
Every day, before starting to work, the team meets during approximately 15 minutes near the Kaizen Board in order to debate about the KPIs from the previous day and discusses the main action plan and objectives for the day. This Kaizen Board that is located near the agents’ working area is fed by two different sources: reports directly extracted from the online communication tool; a Tableau dashboard containing some service level values related with Step 4 Stops and workload per agent.
The main KPIs for ticket-related tasks came directly from the communication tool reporting. The interface of this reporting is displayed on Figure 10.
Figure 10 - Source of Tickets' Insights
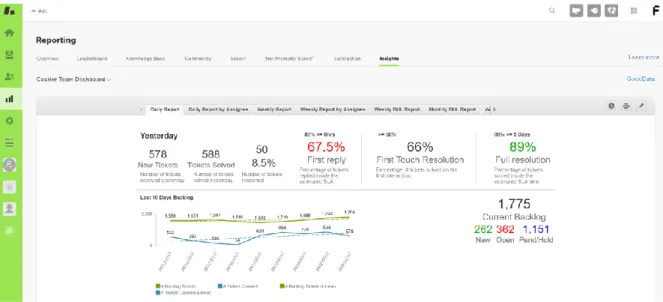
The first and only dashboard designed by a Farfetch analyst is shown on Figure 11. This was the only source of Step 4 Stops performance data, and contained also a few insights about the workload of the agents.
Figure 11 - Dashboard with Main KPIs
Regarding the above metrics, a lot of questions were raised concerning its veracity and consistency. Most of the KPIs present, especially for ticket tasks, were not being properly calculated and some of the formulas and main calculation criteria were not explicit. In terms of metrics for the Step 4 Stops, the dashboard used was built more than two years before this project started and since then no follow-up maintenance was made neither to correct previous errors nor to add new features to support team’s needs.
Another big issue was the inconsistency in terms of results shown on the two reports presented: some of the tickets KPIs are calculated on both communication tool reporting and Tableau dashboard that normally exhibit different results for the same metric. This problem may come from the formulas that are being used or from the moment the data is being extracted/refreshed. The fact that these results do not match led supervisors and managers to start using different sources to evaluate the same metrics, creating an inconsistent environment around the team performance.
On top of all the issues related with the data accuracy, some other needs emerged concerning the level of detail of the former reporting. Managers of the department and team’s supervisors felt the need to access new dashboards with higher level of detail in terms of KPIs and better insights in terms of individual performance of the agents. The available reporting was far from what was actually needed to manage the team efficiently and increase the service level provided.
3.2.1 Tickets – Former Metrics
All the available metrics for the main tickets KPIs that came from existing reports were analysed in order to understand how they were being calculated and the level of detail used on these calculations. The results of this search show that although it is possible to identify the underlying mathematical expressions, no one was able to put any kind of restrictions or filters in the data. Without this feature, it is impossible to extract the necessary information to properly find explanations for unexpected variations or other kind of issues on the performance. In the end, the available performance insights ended up being too generic, without being able to show the necessary depth.
Some of these metrics are relevant for the entire company and are also used by other departments besides the Delivery Support team. The former metrics being used were:
• Number of new tickets: the total number of tickets that entered in the online platform in a given period of time. These new tickets represent new issues that appeared to be solved:
New Tickets = ∑ 𝑇𝑖𝑐𝑘𝑒𝑡𝑠 𝑆𝑡𝑎𝑡𝑢𝑠 = 𝑁𝑒𝑤
• Number of Solved Tickets: the total number of tickets that were solved by the team. A ticket status is manually changed to solved when the agent assigned to the ticket assumes that the corresponding issue is resolved and there is no need for further interactions:
Solved Tickets = ∑ 𝑇𝑖𝑐𝑘𝑒𝑡𝑠 𝑆𝑡𝑎𝑡𝑢𝑠 = 𝑆𝑜𝑙𝑣𝑒𝑑
• Number of Reopened Tickets: the total number of tickets whose status were solved but reopened due to a new reply on the ticket from one of the agents involved in the issue:
Reopened Tickets = ∑ 𝑇𝑖𝑐𝑘𝑒𝑡𝑠𝑃𝑟𝑒𝑣𝑖𝑜𝑢𝑠 𝑆𝑡𝑎𝑡𝑢𝑠 = 𝑆𝑜𝑙𝑣𝑒𝑑
• % Tickets Replied in SLA (<8h): the percentage of new tickets with a first interaction/comment within 8h. This metric represents the Service Level Agreement and is calculated as the ratio between the number of tickets replied in less than 8 hours and the number of tickets with a reply:
SLA (< 8h) = ∑ 𝑇𝑖𝑐𝑘𝑒𝑡𝑠 𝐹𝑖𝑟𝑠𝑡 𝑟𝑒𝑝𝑙𝑦 𝑤𝑖𝑡ℎ𝑖𝑛 8ℎ ∑ 𝑇𝑖𝑐𝑘𝑒𝑡𝑠𝑅𝑒𝑝𝑙𝑖𝑒𝑑
• Number of Backlog Tickets: the number of tickets that in a given date represent the current amount of work for the team. It is calculated as the sum of the ticket with the following status: new, open, pending, on-hold:
Backlog Tickets = ∑ 𝑇𝑖𝑐𝑘𝑒𝑡𝑠 𝑆𝑡𝑎𝑡𝑢𝑠 = 𝑁𝑒𝑤, 𝑂𝑝𝑒𝑛, 𝑃𝑒𝑛𝑑𝑖𝑛𝑔 𝑜𝑟 𝑂𝑛−𝐻𝑜𝑙𝑑
• % of First Time Resolution: the percentage of tickets that are solved with a single reply.
First Touch Reply = ∑ 𝑇𝑖𝑐𝑘𝑒𝑡𝑠 𝑆𝑜𝑙𝑣𝑒𝑑 𝑤𝑖𝑡ℎ 𝑜𝑛𝑒 𝑐𝑜𝑚𝑚𝑒𝑛𝑡 ∑ 𝑇𝑖𝑐𝑘𝑒𝑡𝑠𝑆𝑜𝑙𝑣𝑒𝑑
• % of Full Resolution Time (<5 days): the percentage of tickets that are solved in less than 5 days. The resolution time is the interval between the moment the ticket is created and the moment it is solved:
Full Resolution Time (< 5 days) = ∑ 𝑇𝑖𝑐𝑘𝑒𝑡𝑠 𝑆𝑜𝑙𝑣𝑒𝑑 𝑤𝑖𝑡ℎ𝑖𝑛 5 𝑑𝑎𝑦𝑠 ∑ 𝑇𝑖𝑐𝑘𝑒𝑡𝑠𝑆𝑜𝑙𝑣𝑒𝑑
Concerning the targets for SLA, Full Resolution Time and First Time Resolution, all marks were set by the top management, taking into account performance levels from the past and the service quality that Farfetch desires to deliver. The targets for these metrics were:
• SLA (<8h): 80%;
• Full Resolution Time (< 5 days): 80% • First Time Resolution: 60%
The formulas presented above are the only metrics used by the supervisor and top management to evaluate the team performance in terms of ticket-related tasks. Looking at the former reporting, it is possible to identify right way some barriers: there is no option to divide the KPIs by office; it is not possible to obtain these metrics by category; the performance by agent is very limited; there is no way of comparing the workload that external departments create to the team; the arrangement of tickets by age is very limited, preventing supervisors from having better insights and taking adequate actions.
3.2.2 Step 4 Stops – Former Metrics
Although the metrics and level of detail used for tickets were not enough for the current needs, the analysis done for the Step 4 Stops was even more incomplete. The only metric available was:
• SLA Step 4 (<2h): the percentage of orders that are moved manually to the next step within 2h after the error occurred. This metric represents the Service Level Agreement and is calculated as the ratio between the number of order moved in less than 2 hours and the total number of orders moved within a certain period of time.
SLA Step 4 (< 2h) = ∑ 𝑂𝑟𝑑𝑒𝑟𝑠 𝑆𝑜𝑙𝑣𝑒𝑑 𝑤𝑖𝑡ℎ𝑖𝑛 2ℎ ∑ 𝑂𝑟𝑑𝑒𝑟𝑠𝑆𝑜𝑙𝑣𝑒𝑑
The SLA target defined for this metric is lower than the one defined for tickets. This is related with the type of task which is completely different: while a normal ticket represents a conversation between two entities in order to solve a problem, an order stopped in Step 4 surely represents a delay on a customer’s order and the SLA must be tighter. Hence, the target was to solve 95% of all the Step 4 Stops in less than 2h.
There was only one KPI available for this task because the data present in the database useful to monitor it is rare and forces analysts to build queries a lot more complex than in the case of the tickets platform. Tickets are easier to measure, since the information about creation, interactions and updates is very-well organized in different tables. Hence, the main gap for this task is not the KPI itself, but the given use and the depth of the analysis.
Currently, the SLA for Step 4 Stops is only split by country and by date: separation between offices, where there are active agents; daily and weekly calculation in order to compare current results with the values obtained in the previous day and/or week.
A critical gap found on the former reporting was the absence of a categorization of the error type that made the order stop. There are different causes responsible for Step 4 Stops and a proper categorization can help create a better workload distribution for the agents. Hence, these different types of stops were studied and incorporated on the new reporting, as described on the next chapter.
3.3 Final Overview
After a deep analysis around the data available in previous reporting, the main issue found was the lack of detail of the metrics available. Although the KPIs presented were not enough, the major concern was definitely the absence of enough reporting tools to show the necessary information, help identify problems and support decision making. Adding to this, there were also wrong calculations, mainly due to the absence of any kind of monitoring of the data and dashboards.
Looking at the former data from a time-based perspective, there was no filtering option and it was not possible to analyse information based on different time periods. Hence, executives that sought to take strategic decisions did not have available a visual tool to display performance reported on a weekly basis. Adding to this, the ability to filter data per team was very limited, based only on a SLA split. Moreover, the metrics available for the majority of the agents outside Porto office were even more reduced.
Concerning the individual performance, the only metric present was the backlog by agent. There was no option to analyse other metrics by agent, which made every supervisor’s operational decisions a lot harder to execute, mostly in terms of the tasks assignment. One good example of the lack of criteria on the allocation of the tasks was the way the supervisor selected the agent responsible for the Step 4 Stops: every morning, during the Kaizen meeting, the agent chosen for the task was the one with the lowest number of tickets in backlog. This type of assignment shows that the available reporting was not enough to support solid decision-making on the operational level.
Given the high volatility of the tools used to measure performance with a high accuracy, all the visual tools and formulas should be monitored frequently, in order to keep pace with the changes on the working processes and be able to answer properly to the most recent needs. In a company constantly growing, with new services being added regularly, each of the visualization tools should be under constant observation, something that did not exist with the previous reporting.
Taking into account all the topics explained, it was clear that performance metrics and tools had to be improved. The action plan was to start from scratch, slowly removing the old reporting tools and replacing them with new dashboards built in Tableau, the main business intelligence and analytics software used at Farfetch. For this, new metrics and analysis had to be implemented and some of the old KPIs were recalculated with a stronger and clearer base. The final goal was to provide senior management with completely new visual tools in order to improve the performance of the team as a whole.