FACULDADE DE
ENGENHARIA DA
UNIVERSIDADE DO
PORTO
Comparing Bus Travel Time Prediction
Using AVL and Smart Card Data
Fernando Aparecido dos Santos Silva
Master in Information Engineering
Supervisor: Dr. João Pedro Carvalho Leal Mendes Moreira Co-Supervisor: Dr. Luís Alexandre Moreira Matias
c
Comparing Bus Travel Time Prediction Using AVL and
Smart Card Data
Fernando Aparecido dos Santos Silva
Master in Information Engineering
Approved in oral examination by the committee:
Chair: Dr. António Pedro Rodrigues AguiarExternal Examiner: Dr. Rui Camacho
Supervisor: Dr. João Pedro Carvalho Leal Mendes Moreira
Resumo
Como uma área de estudo importante, o Sistema de Transporte Inteligente emergiu como o pred-itor do tempo de viagem nas redes de autoestrada para fornecer informações aos passageiros em relação ao transporte público. O Sistema de Transporte Inteligente fornece tecnologias de análise, controle e comunicação através de aplicativos para melhorar a segurança, mobilidade e eficiência. As informações são constantemente compartilhadas por agências de trânsito e empresas que usam o Sistema de Transporte Inteligente para minimizar os problemas de trânsito como congestion-amento, impacto ambiental e melhorar o gerenciamento de tráfego. Informações precisas sobre horários de chegada do autocarro ajudam os passageiros a planejar suas viagens além de fazê-los sentir-se mais satisfeito com o serviço de transporte. Um serviço eficiente de transporte de au-tocarro pode reduzir o uso do carro particular, o que reduz os problemas de excesso de tráfego e leva a uma redução dos tempos de espera dos passageiros no ponto de ônibus, o que, em última instância, leva a passageiros de ônibus mais satisfeitos.
O objetivo desta dissertação está relacionado ao uso de dados de cartão inteligente de pas-sageiros e dados de sistema automático de viaturas fornecidos pela empresa de transporte por-tuguesa, Sociedade de Transportes Colectivos do Porto (STCP), Portugal. O objetivo é comparar e avaliar as previsões do tempo de viagem das linhas de autocarro, além de ajudar na confiança do serviço de autocarro portugues, na redução de atraso do tempo de viagem do autocarro, no aumento da lucratividade das empresas em suas rotas de autocarros a integrar os dados do sistema automático de viaturas e cartão inteligente de autocarros. À medida que os sistemas automático de viaturas usam o dispositivo do sistema de posicionamento global colocado no veículo para poder localizar sua posição e velocidade em toda a rota (Algueró,2013). Os dados do cartão inteligente são gerados por um sistema de bilhética integrante que captura dados dos cartões de usuários de autocarros e comunica informações através do sistema para integrar dados em cada rota (Algueró,
2013). É importante entender qual é o impacto do número de pessoas na parada de autocarros no plano de horário de autocarros, bem como demonstrar uma análise preditiva do tempo de viagem do ônibus.
Os dados dos sistemas de localização automática de viaturas e bilhetica foram usados para comparar modelos preditivos para previsão do tempo de viagem de autocarros. A necessidade de comparar a previsão do tempo de viagem de autocarros a usar dados do cartão inteligente vem junto com o avanço da tecnologia, integração de disponibilidade dos dados e o uso desses dados na análise com algoritmos de machine learning. Esta análise reforça a competitividade das empresas públicas públicos de autocarros para garantir estrategicamente a fiabilidade do serviço de autocarros. A motivação para entender as tecnologias de cartões inteligentes tornou-se útil para as empresas de trânsito que utilizam isso para obter indicadores de transporte público. Além de realizar uma análise para entender as características dos dados,os dados também são usados para propósitos preditivos.
Para este estudo proposto foi usado alguns algoritmos como os modelos (Random Forests (RFs), Artificial Neural Networks (ANNs) and Support Vector Regression).
A aplicação de modelos preditivos que usam esses dados disponíveis para aplicar métodos de machine learning forneceu uma melhora média dos modelos preditivos de 10% em comparação com a avaliação do conjunto de dados do sistema automático de viaturas.
Keywords: Machine learning, algoritmos, cartão inteligente, sistema automático de viaturas, sistema de posicionamento global, previsão de tempo de viagem e plano de agendamento de autocarros.
Abstract
As an important study area, Intelligent Transportation System (ITS) has emerged as the predictor of travel time on road networks in order to provide information to passengers regarding public transportation. ITS provides analysis, control and communication technologies through applica-tions to improve safety, mobility and efficiency. Information is constantly shared by transit agency and companies using ITS to minimize transit problems as congestion, environmental impact and improve traffic management. Accurate information on bus arrival times helps passengers to plan their trips in addition to making them feel more satisfied with the transport service. An efficient bus transport service can reduce private car usage which reduces problems of excess traffic volume and leads to a reduction of passengers waiting times at bus stop which ultimately leads to more satisfied bus passengers.
The purpose of this dissertation is related to the use of smart card (SC) data from passengers and Automatic Vehicle Location (AVL) data provided by the Portuguese transport company, So-ciedade de Transportes Colectivos do Porto (STCP), Portugal. The aim is to compare and evaluate travel time predictions of bus lines, in addition to helping Portuguese bus service reliability, re-ducing bus travel time delay, increasing company profitability across its bus routes by integrating archived bus AVL and SC data. As AVL systems use Global Positioning System (GPS) device placed in the vehicle to be able to locate its position and speed throughout the route (Algueró,
2013). The smart card data is an integrating ticketing system which captures data from the bus user cards and communicate information through the system to integrate data in each bus route (Algueró,2013). It is important to understand what is the impact of the number of people at the bus stop on the Bus Schedule Plan (BSP), as well as demonstrating an predictive analysis of the bus travel time.
AVL and SC data were used to compare predictive models for bus travel time (TT) prediction. The need to compare the forecast of bus travel time using AVL and smart card data comes along with the advance of the technology, data availability integration and the use of these data on anal-ysis with machine learning algorithms. This analanal-ysis reinforces the competitiveness of public bus transport companies to ensure strategically bus service reliability. The motivation to understand smart cards technologies has become useful for transit companies which make use of it to get in-dicators of public transportation. Besides performing an analysis to understand the characteristics of the data, the data is also used for predictive purposes.
For this proposed study we use some algorithms such as Random Forests (RFs), Artificial Neural Networks (ANNs) and Support Vector Regression (SVR) models.
Applying predictive models using these available data (AVL and SC) to apply ML methods provided an average improvement of the predictive models of 10% in comparison to the evaluation of the AVL dataset.
Keywords: Machine learning (ML), algorithms, smart card (SC), automatic vehicle location (AVL), global positioning system (GPS), travel time prediction (TTP) and bus schedule plan (BSP).
Acknowledgements
I have some people to be grateful about my academic path at Faculty of Engineering of the Uni-versity of Porto. Thank God! He has been my strength so far and firstly my help comes from Him and Jesus Christ.
I would like to thank my supervisor and co-supervisor Prof. Dr. João Mendes Moreira and Dr. Luís Alexandre Moreira Matias who helped me to choose the theme of this thesis and advised me when was necessary and when I had questions about the research. I would also like to thank Proof. Dr. Antonio Pedro Aguiar, coordinator of Information Engineering master, who always kept the door of his office open for students and accepted me in this master course.
I would like to thank my fiancee Priscila Felix who is my partner, best friend, personal advisor and my love. She stayed by my side in every moments even when she went to Spain, her presence was noticed by her caring and support.
I could not forget my parents’ support, Luzinete Silva and Manuel Silva, without them this objective would never be accomplished. They were more than I expected even as parents and they were my structure in Lusitanian lands. To my brother Lucas Silva who made part of my trajectory even living in Brazil he did to me what I will never forget. Thank you my brother!
A special thanks to my aunt Creuza Alves and Jose Belmiro (in memory). Aunt Creuza is like a mother for me and I would like to thank her because she always supports me whenever I am and makes the difference in my life by praying and being an example of woman. To my uncle Jose Belmiro Alves who left this world two months ago and he will never be forgotten by me. He always had positive words to tell me in hard times. One more time thanks uncle Guega.
I would like to thank my parents in law, Geraldo Felix and Nidi Felix who have supported me and Priscila during our stay in Portugal and I really appreciate the way that they did not measure their efforts to support us living in Portugal.
To my friends Borgine and Mailson, thank you very much. The time we shared in this course made me learn a lot with you two. From colleagues they became friends.
I am grateful to some friends that I have made in Portugal and one of them is Wellington Bernardes. He was always available to help and I will not forget this.
Last but not the least a big thanks to Tony Silva who shared some time spreading knowledge with me at the LIAAD building. He helped me going through machine learning for this specific research area in this dissertation and better understand R programming language.
“It always seems impossible until it’s done.“
Contents
1 Introduction 1
1.1 Motivation . . . 2
1.2 Objective . . . 3
1.3 Structure of this Dissertation . . . 3
2 State of the Art Overview: Bus Travel Time Prediction 5 2.1 Technological Development on Bus Transport . . . 7
2.2 AVL and Smart Card System Cooperation for Bus Travel Time . . . 9
2.3 Leading to the Bus Service Reliability . . . 12
2.4 Approaches on Bus Travel Time Prediction . . . 14
3 Machine Learning Models and Approaches in Travel Time Prediction 17 3.1 Predictive Methods and Analyses . . . 18
3.2 The Relevancy of Predictive Models . . . 19
3.3 The Cross Validation Method . . . 21
3.4 The Sliding Window Method . . . 21
3.5 Linear Regression Model . . . 22
3.6 Support Vector Regression Model . . . 24
3.7 Kalman Filter Model . . . 25
3.8 Random Forests Model . . . 26
3.9 Artificial Neural Networks Model . . . 28
4 Evaluation and Comparison of Predictive Models in the Proposed Analysis 31 4.1 Structure of the Dataset . . . 32
4.2 Data Preparation . . . 34
4.3 Historical Data with Average Travel Time . . . 35
4.4 Applying the Permutation Importance Measure . . . 37
4.5 Applying the Sliding Windows Method for the Proposed Machine Learning Models 38 4.6 Experimenting with the Random Forest Algorithm . . . 38
4.7 Experimenting with the Support Vector Regression Algorithm . . . 41
4.8 Experimenting with the Artificial Neural Networks Algorithm . . . 43
4.9 Presenting the Results . . . 45
5 Conclusion and Future Works 47 5.1 Satisfaction of Objectives . . . 47
5.2 Future Works . . . 48
CONTENTS
List of Figures
1.1 Bus route line 600 GPS location . . . 2
2.1 GPS and Automated Data Collection System image from (Moreira-Matias,2014) 9 2.2 The operation of a Smart Card Information System (Pelletier et al.,2009) . . . . 10
2.3 Bus Travel Route (Li et al.,2011) . . . 15
3.1 Minimal consistent determination algorithm (Russell and Norvig,2013) . . . 20
3.2 Travel time prediction assuming the current time from two pointsWu et al.(2004) 25 3.3 Random Forest decision tree structure (Verikas et al.,2016) . . . 27
3.4 Aritificial Neural Network structure . . . 28
3.5 ANN Perceptron Structure (Kashid and Kumar,2012) . . . 29
4.1 Estimated time information for line 604 . . . 33
4.2 Variables of importance to the data of the bus line 600 . . . 37
4.3 Variables of importance to the data of the bus line 805 . . . 37
4.4 Regression test of AVL data with R2for bus line 600 . . . 39
4.5 Regression test of AVL data with R2for bus line 805 . . . 40
4.6 Regression test of AVL and smart card data together with R2for bus line 600 . . 40
4.7 Regression test of AVL and smart card data together with R2for bus line 805 . . 41
4.8 Real and predicted values for bus line 600 of SVR model . . . 42
4.9 Real and predicted values for bus line 805 of SVR model . . . 42
4.11 Graphical representation of the ANN model for bus line 805 . . . 44
LIST OF FIGURES
List of Tables
2.1 Complex Regression Models Employed in Travel Time Prediction (Moreira-Matias
et al.,2015) . . . 7
2.2 Spatial and Temporal Detail for Automated Data (Furth et al.,2003) . . . 11
2.3 Some Factor Affecting the Reliability of Bus Service (Cham,2006) . . . 13
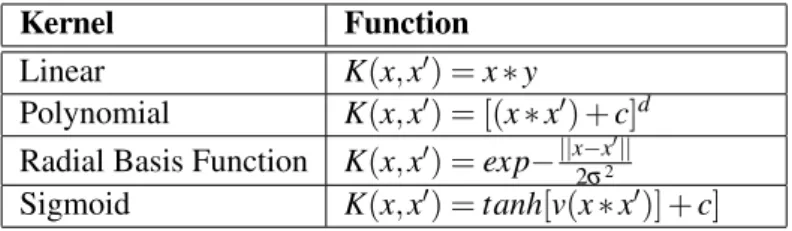
3.1 Kernel functions (Wang et al.,2009) . . . 24
4.1 Sample Observations of 3 days Average Travel Time for bus line 805 . . . 36
4.2 Statistics for Data in Bus Travel Time . . . 36
LIST OF TABLES
Abbreviations
AI Artificial Intelligence
APC Automatic Passenger Counting ANN Artificial Neural Networks AVL Automatic Vehicle Location BSP Bus Schedule Plan
GPS Global Positioning System ITS Intelligent Transportation System KNN K-Nearest Neighbours Regression
LOWESS LOcally WEighted Scatterplot Smoothing ML Machine Learning
MSE Mean Squared Error
PFI Permutation Feature Importance RF Random Forests
RBF Radial Basis Function RMSE Root Mean Squared Error SC Smart Card
STCP Sociedade de Transportes Colectivos do Porto SVM Support Vector Machine
SVR Support Vector Regression TT Travel Time
Chapter 1
Introduction
In recent times, the public transport system has been the challenge of many companies around the world, not only the infra-structure, i.e. vehicle in good conditions, well-trained drivers and automated fare payment. The corresponding number of vehicles running is over 800 million on road worldwide (Ferreira et al.,2012). The increase of vehicles running on the main cities’ roads worldwide has caused problems as traffic congestion and discouraged many people to use their private vehicles lately (Moreira-Matias et al.,2015). The use of buses has been an alternative to control the increase of vehicles running and traffic congestion, in addition it has caused a result of the recognition of public transport being a reliable alternative for the short-travel in these main cities recently.
The quality of the bus transport services offered by companies has been seen with more atten-tion and care lately, as bus travel time reliability is more sensitive for passengers. A way of re-ducing negative experiences/feelings in passengers towards the transit system is through improved reliability, however such disappointments come along with a long period waiting at bus stops, crowding situation on buses or not to be able to board the bus (Carrel et al.,2013). The public transport system nowadays has been supported in its enhancements by some studies and through the access of technologies, which helps to improve service reliability (Shalaby and Farhan,2004).
Mendes-Moreira (2008) states that the technology has been important for transport companies through investments in high technology systems such as ticketing system, automatic passenger counting, operations software, multi-modal traveller information in the past three decades.
The city of Porto, as other cities worldwide, has been impacted by improvements with bus travel time prediction, providing real time information on user’s device (i.e. smartphones and computers) to be a reliable transportation service, also corresponding to the travel time. The impact of the bus travel time reliability on passengers, such as for those who are on the bus or for those who wait for it to be on time at the bus stop. It requires constant evaluation, day-by-day, with some operational techniques, then discussion will be taken along of this dissertation. In addition to describing the machine learning algorithms used to build bus travel time prediction and frame
Introduction
the dataset in order to review the old structure, nevertheless ensure that the service is offered in a high quality.
1.1
Motivation
This study proposes to identify some proper machine learning models, which can be applied in the bus travel time prediction. The use of predictive algorithms adequate for our problem aims to optimize the results.
The aim of this dissertation is the use of ML models to predict bus travel time, using two different data sources. Considering the number of boarding and alighting passengers as well as the bus arrival and departures times that is related from Automatic Vehicle Location (AVL) and smart card (SC) data on vehicle in real time information. The passengers wait times and the variability of bus arrival times are conditioned on an accurate and improved implementation of schedule adherence at each bus stop (Kimpel,2001).
Global Positioning System (GPS) and Automatic Passenger Counting (APC) are metric sys-tems used to hold information about the bus travel, including passengers entry and exit. These electronic systems were the support for the proposed study in this dissertation that will be the baseline to begin the research with evaluation and measurements.
AVL data can be an advantaged guide for making decisions which come from advanced tech-nology, proof of this, according to information from the U.S. Department of Transportation, the buses in the city of Chicago are fully equipped with the AVL system since 2004 (U.S. Depart-ment of Transportation, 2007). The development of the U.S public transport system has been present through the massive investment in technology and the implementation of AVL system on the fleets.
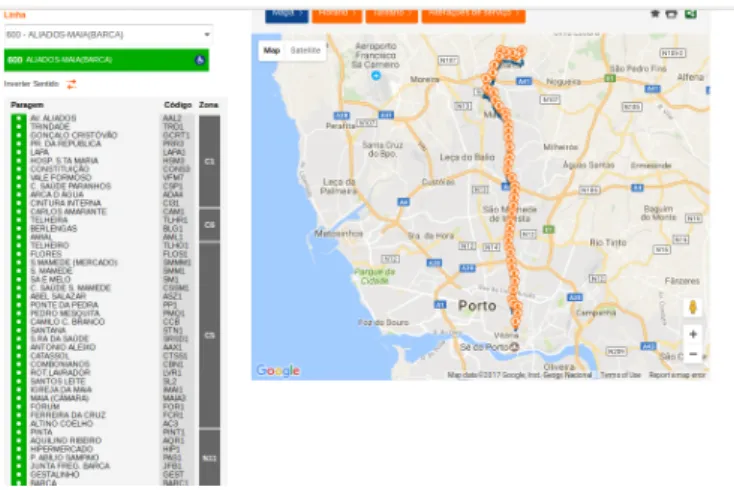
A demonstration sample of an AVL system using GPS data is shown in figure1.1. It shows the route for bus line 600 since it leaves the terminal until the last stop.
Figure 1.1: Bus route line 600 GPS location
Following the aforementioned description, according to the goal and target to be accomplished, more details will be presented in section1.2, which involves the effective purpose in evaluating
Introduction
bus travel time prediction in public transport considering the impact of the passenger load at the bus stop in relation to the time a bus link has been affected.
1.2
Objective
To provide a more consistent travel time prediction (TTP) system which does not mean a sys-tem that is 100% perfect, but that is more accurate in every step of the process. We address the relevance of considering some events, i.e. the number of passenger at each bus stop. The per-formance is evaluated using the root mean squared error (RMSE). These aforementioned events will be considered as influences on forecasts and should also be important reason of delays that buses on their route go along to each stop, therefore the amount of passenger at each bus stop is another parameter to explain how accurate travel time is, in order to evaluate its relevance and average throughout the bus route. The excessive number of users on a bus or at a bus stop can cause an abrupt interruption passenger’s use of the service, in addition the decrease of bus travel time reliability (Tirachini et al.,2013). This is a problem in relating to passenger overcrowding could affect the service reliability.
Firstly, the evaluation of accurate bus travel time prediction is related to the quality of dataset which informs the importance of attributes wherein it should capture data to become necessary information and all data to be trained and tested in the dataset by the following generation the prediction model.
With such a good data from the dataset,Bagchi and White(2004) say that bus travels can be built with smart card data to provide users a schedule where it can achieve their needs throughout the day by transportation companies. It is an advantage to have data which come from this type of technology, as it helps to support the process of implementation, development and analysis. Therefore, ITS is important to promote quality of bus public transport service and reflect the main modernization about the service.
1.3
Structure of this Dissertation
This dissertation contains five chapters, so throughout the proposed study and the baseline to comprehend more bus travel time prediction on the scope of the research field, which meets the needs of transportation companies and passengers. The increasing of more reliable bus service and travel time is a measure which ultimately leads to more satisfied bus passengers. In addition to the introduction, this dissertation contemplates four more chapters, according to the development of this study.
In Chapter 2 is shown a description about the start-of-art review for travel time prediction approach, whereas explains the proposed study and takes the opportunity to compare other studies. In addition, we will see, in details, the involved technology mechanism in capturing data from buses in circulation on city’s road networks in Porto.
Introduction
Chapter3settles down the main importance to promote the explanation about machine learn-ing methods, models and algorithms that are applied to reach our goals or are used to provide some feedback and experience throughout the study from other researchers, therefore a descrip-tion of the general and specific point of view from each models and algorithms were proposed. A mathematical explanation helps us to better comprehend the proposed algorithm over the idea and implementation on bus travel time prediction. Nevertheless, there will be proposed a particular analysis whereas results and graph will show up, not as definitive but as part of the comparative model.
In chapter 4 is proposed a more concise definition of each valuable algorithm, that better defines our goals without losing any perspective and providing an explanation about the choice of the problem, whereas it might be more than one predictive model. The suitable algorithm provides us more support over our analysis, therefore it particularly gives the idea through its applicable method on the dataset, even though some can be elected more suitable depending on the results and its applicable structure, in order to identify correlation with proposed data frame and objective.
Chapter5finalizes this dissertation with expecting result and helps us to conclude, after seeing some results in chapter 4, the contemplation of the idea and the problem is partially or totally solved by the conclusion on this method, algorithm and result figured out in the final part.
Chapter 2
State of the Art Overview: Bus Travel
Time Prediction
Travel time prediction is a demanding study area, requiring proper data, technological tools access and, moreover, the effort to understand the behaviour of the transportation service across a state variable, in order to predicts its result considering some factors that can interfere the realization of operation system. Mendes-Moreira(2008) defines travel time prediction as being the time that a vehicle travels from a start point to its terminal, and this definition was used from theTurner et al.
(1998). He also complements to clarify travel time prediction explaining some other definitions related to slack time which is the time a bus is stopped in a terminal between the final trip time and the beginning of a next trip. For the cycle time the author says that is the two consecutive times a bus is leaving from the same point in a time interval.
The ability to comprehend data, technological tools, and environment where we want to find solutions for specific problems raised in people’s or companies’ routine. It comes with the need to use machine learning and artificial intelligence as part of a learning model to ensure better results are being applied and comparing both. Machine learning has been present in many study areas consolidating its importance in employing learning methods in order to exemplify the problem-solving structure, solve them and show results. With historical data, as for example the studied in this dissertation, is necessary to train the methods. The training set and test are part of the aggregated data so they consist of a learning model and methods for trying to find a specific function which maps both input and output in a training dataset, as well as a second method is applied to evaluate the test dataset, in order to provide some feedback about whether the prediction is correct or not (Dahl et al.,2014).
Starting from a baseline study and considering bus travel time a problem for public transporta-tion, we review the main idea of a public transport service problem given by its pattern to realize the contextual previous research. To relate a practical use, taking into account the routine service
State of the Art Overview: Bus Travel Time Prediction
and the external factor of passenger that are distributed along a bus route at each stop and this distribution is unbalanced, which must influence the travel time for the bus schedule plan.
Moreira-Matias et al.(2015), in their project about improving public road transportation plan-ning and monitoring, describes the general travel time prediction function as defined as following to be T T(i, j) the run time between two bus stops bi, bj: j > i and the computation of travel time
will be: T T(i, j)= j−1
∑
k=1 dwTk+ RT(k,k+1) (2.1)The notation RT(k,k+1) is to represent the non-stop running time in a road segment between
two consecutive bus stops bk, bk+ 1, and the dwell time is represented by dwTkat the bus stop bk
which is the first bus stop.
Some other studies provide an understanding of the idea that passengers distribution along the bus route is considered the number of stop and the number of passenger distributed along the bus route. For us to have some understanding, whereas the kind of problem we are handling in this dissertation,Zhao et al.(2006) provide an explanation about the probability density function (p.d.f) for the random passengers arrival at the bus stop:
fA(t) = SH−1, (2.2)
In this p.d.f (t) is a representation of the passenger’s arrival at the bus stop, according to
Bowman and Turnquist(1981) other alternative is the distribution of passenger’s arrival time in a circumstance the bus schedule time is already known as shown in the following p.d.f:
fA(t) =
exp(U (t))
RSH
0 exp(U (t))dτ
(2.3) Where U (t) = αE[w(t)]b is the value of an arrival at time t. From the data we have "a" and "b" as constant. An expected waiting time for an arrival at time t is represented by the function E[w(t)].
Previous studies using regression models were created by getting results in estimating predic-tions, they are used in average time, number of stops, time period of the day (i.e. independent variable), average transit, bus flow average, heavy vehicle proportion and travel distance (Yu et al.,
2016).
Some complex models are applied for travel time prediction, in order to relate the most impor-tant model and result obtained. The authors’ specifications have already been applied to bus travel time prediction problem in different approaches, however it has been a significant problem-solving in many circumstances that involves travel time prediction and its complexity.
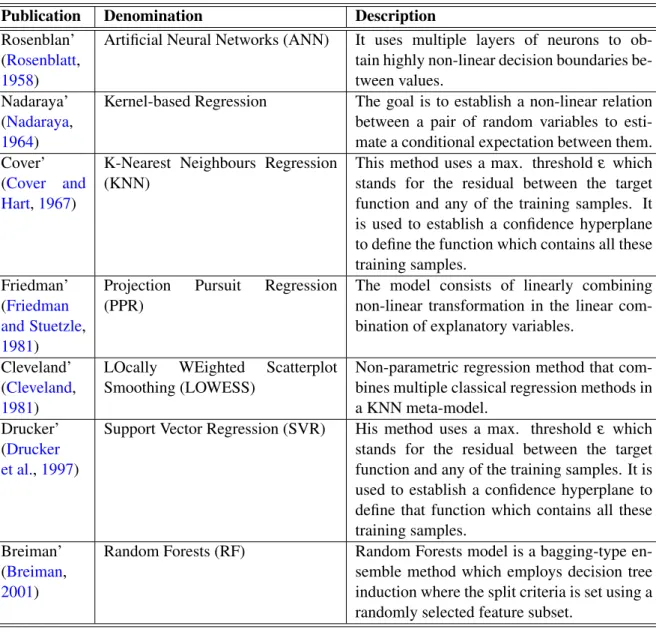
These models are well employed for travel time prediction with accurate results. One of the most known approaches for travel time prediction is Regression which has the propose to infer the arrival times in a mathematical form using a set of independent variables, such as some regression algorithms can be easily applied for long-term travel time prediction (Moreira-Matias et al.,2015). The Support Vector Regression, K-nearest Neighbourhood and Artificial Neural Networks have
State of the Art Overview: Bus Travel Time Prediction
Table 2.1: Complex Regression Models Employed in Travel Time Prediction (Moreira-Matias et al.,2015)
Publication Denomination Description Rosenblan’
(Rosenblatt,
1958)
Artificial Neural Networks (ANN) It uses multiple layers of neurons to ob-tain highly non-linear decision boundaries be-tween values.
Nadaraya’ (Nadaraya,
1964)
Kernel-based Regression The goal is to establish a non-linear relation between a pair of random variables to esti-mate a conditional expectation between them. Cover’
(Cover and Hart,1967)
K-Nearest Neighbours Regression (KNN)
This method uses a max. threshold ε which stands for the residual between the target function and any of the training samples. It is used to establish a confidence hyperplane to define the function which contains all these training samples.
Friedman’ (Friedman and Stuetzle,
1981)
Projection Pursuit Regression (PPR)
The model consists of linearly combining non-linear transformation in the linear com-bination of explanatory variables.
Cleveland’ (Cleveland,
1981)
LOcally WEighted Scatterplot Smoothing (LOWESS)
Non-parametric regression method that com-bines multiple classical regression methods in a KNN meta-model.
Drucker’ (Drucker et al.,1997)
Support Vector Regression (SVR) His method uses a max. threshold ε which stands for the residual between the target function and any of the training samples. It is used to establish a confidence hyperplane to define that function which contains all these training samples.
Breiman’ (Breiman,
2001)
Random Forests (RF) Random Forests model is a bagging-type en-semble method which employs decision tree induction where the split criteria is set using a randomly selected feature subset.
the ability to find out complex non-linear relationships from independent variables and the target one (Moreira-Matias et al.,2015).
According to Moreira-Matias et al. (2015) information displayed by advanced time system might reduce the high number of passenger at any bus stop for short-term travel time. That re-lates the use of the algorithm to predict in advance bus travel time at some bus stop and avoid unreliability of the transport system.
2.1
Technological Development on Bus Transport
Technology is everywhere since a small task that human beings want to do until big task, and provides tools, insights and knowledge. Beyond that, Intelligent Transport Service (ITS) is one of
State of the Art Overview: Bus Travel Time Prediction
special system in referring communication technologies in addition to improving people’s trans-portation mobility conditions and economic performance with transport improvements in Europe (Taylor, 2010). The ITS structure provides to mass transit companies the possibility to build mechanisms to support the transport system with GPS, AVL and smart card data. The perspective of improvements through the technology was considered new to this research area some years ago, however its emergence brought unprecedented advantage in the matter of public transport. The following contribution, on the European Union transport reportTaylor(2010) explains some technology components that integrate ITS:
• Sensing technology: It consists a feed control system with infrastructure-based to gather information from a radar or cameras installed on a bus for example. Employing sensors have the same technology structure and components with this vehicle based data.
• Computational technologies: Inside the structure, model based process control and artificial intelligence are the two main reasons for the most expensive embedded technology.
• Long range and short range: Data exchange combined with several forms of wireless com-munication for the vehicles.
All of these technologies has as main objective to capture important data to be used as com-petitive advantage, or in a future research on the specific topic about public/private transportation. The facility of contribution on improvement of transport services with such technological devices inserted in a vehicle highlights how important services and technology must go together. The way these data sources has enriched vehicles operational planning and control to get more automated with the help of computational learning algorithms (Moreira-Matias,2014).Delgado et al.(2012) also collaborate stating that GPS and AVL are the new information technologies to cooperate with such complex transportation system and holding control schemes. Automatic Passenger Counter (APC) system also has cooperated with such data from public transport and helped improve the service reliability nowadays. It seems to be more decisive for operational structure to have these transport companies providing this type of data to better serve their customers.
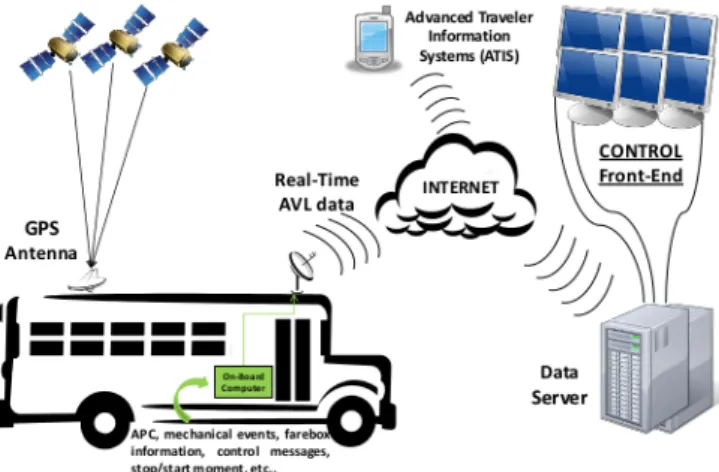
The GPS technology has been important since its discovering in the 20th century to drives and companies. They make use or produce this system, not only for privates vehicles where it can be utilized for transport companies which are interested in storing and accessing data through a device. Companies are also able to keep themselves informed about their vehicle fleets in a correct vehicle position. They can also locate their vehicles in real-time and have some other future perceptions about their business with these data (Moreira-Matias,2014). Figure2.1shows the operation and implementation of the GPS data collection system.
With this technological implementation, the process of capturing all the data is performed in order to generate the GPS data to be transmitted by an AVL system, informing the position of the vehicle. In this case, a bus, as we can see in the image. Another antenna sends data to be stored in a data server through the internet and available on the control front-end and personal devices.
State of the Art Overview: Bus Travel Time Prediction
Figure 2.1: GPS and Automated Data Collection System image from (Moreira-Matias,2014) The technological development passes in collecting data in order to provide for people better service along with the discovering of new and advanced techniques. It is important to understand how automated tools have provided a good comprehension about service planning and operations management and avoided creating operational problems, in addition to developing a prior correct-ness strategy when problems come up (Cham,2006).
Next section revises in more detail the reasons and importance of the use of AVL and smart card system as baseline in the dissertation and main system for capturing our data.
2.2
AVL and Smart Card System Cooperation for Bus Travel Time
This section describes the most important technologies (Automatic Vehicle Location and smart card) for supporting the realization of this study through the provision of bus travel time data, passengers boarding and alighting data. Cooperating with the need to establish strong operational structure to minimize the problems relating to the public transport service, as being necessary nowadays. To have good technologies behind, which support for the operational structure of a company a better way to visualize any inconsistency or future problems related to operations. In order to achieve problem-resolution as the substantial and large data coming from these parametric systems, there was much more what to do in regarding to travel time improvements for public transport.
What else relevant to say about these technologies is related to bus travel time prediction? You might have asked this question and there is much related explanation for their importance in bus travel time. Some of them are explained by researchers, regarding the efficiency of mobility system and enhancing travel times. Before collaborating in details with some of the importance of two transport technological systems used in this dissertation, we focus on the technical charac-teristic between AVL and smart card system. Moreira-Matias et al.(2015) explain that AVL and smart card are bus dispatch systems, while GPS is an AVL-based measurements system. Smart card system has an estimation-based technique about weight sensors where companies have been
State of the Art Overview: Bus Travel Time Prediction
introduced in their bus fleets. The authors also contributes saying that these automated systems store bus location data with a type of sensors broadcasting values in a interval of 10 to 30 seconds, depending on which is the capacity rate for collecting data on these systems.
The smart card system consists in capturing data from a card which has in its part a chip and it is capable of processing, collecting and storing data or a memory chip which is capable of reading data from these cards, available with smart card system (Bagchi and White,2004).
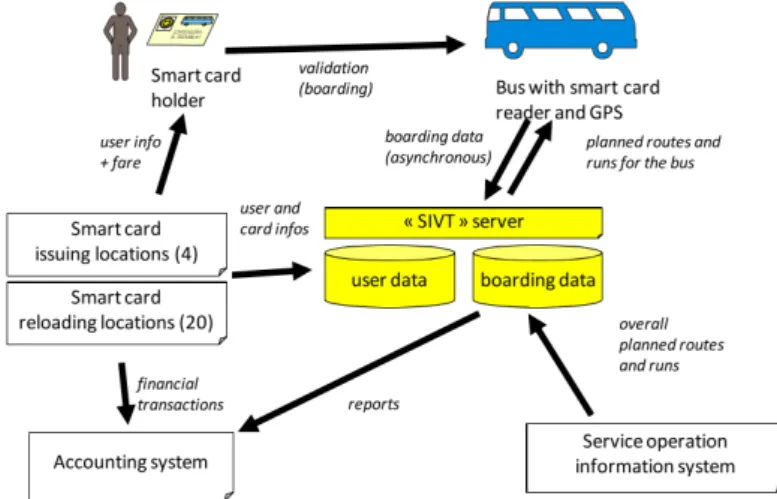
All information kept in an automated process combines smart card and the reading machine configured to read and collect data from these cards. Figure2.2shows us the smart card transaction data integration and passenger information flow since the user whose the card is validated by a reading device until the data storage.
Figure 2.2: The operation of a Smart Card Information System (Pelletier et al.,2009) It is important to ensure the data are stored in a secure way, preserving all passengers’ data and reliability of the system. The users’ validation data are not kept in the same database, the reason is to guarantee the security of all information traffic come through the system (Pelletier et al.,2009).
Bagchi and White(2004) also provide us some information about the overall collecting of data through smart cards:
• Linking data: It is possible to link a card to a person in a way of membership to relate most of travel done by each person who has this personalised card, and facilitate trend travel issues.
• Volume and scope of the data: Transport companies have to handle with large amount of data which comes from automated system. This happens because of the volume of people who have signed up for smart cards and a little data is lost by the amount of people who did not pay their fare with smart cards.
• Continuous information: This type of collection data collects information in a continuous way. These data will be collected in long periods of time that undertakes getting trip data
State of the Art Overview: Bus Travel Time Prediction
from individuals. It provides more accurate long-term analysis and forecasting with most trend day and time used by passengers on a travel.
The authors explain that with smart cards, the need to make recording start from the human role whom a person presents his card to the reading machine, it initializes the pre-defined collecting of information variables, and always considering how many adepts to the modern transaction are using it.
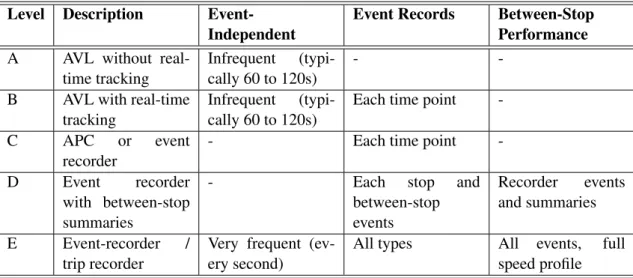
AVL and APC also called automated data collection are mechanisms linked by devices to oper-ate in a vehicle while in movement broadcasting localization, time, speed, passenger boarding and alighting. As in the previous section, we intend to describe the technological advances nowadays in using such AVL and SC systems. Thus,Cham(2006) contributes with the understanding about the relevance of smart card system which is also used for off-line analysis as the use of evaluating performance while APC is used for real-time applications. A first hierarchy level of the automated technological system is described in table2.2:
According toFurth et al.(2003) archived data is composed by four key dimensions and sup-ported by automated systems, as shown in table2.2. These key dimensions are: fleet penetration and sample size, complete vs. exception data, level of spatial and temporal detail and data quality control.
In general to agree about the opportunity to use automated data collection system can do sta-tistically valid analyses for the first moment on the reliability of the service (Furth,2000;Kimpel et al.,2004). The cooperation between AVL and smart card system brought the understanding to manage bus travel time and its particularities in addition to comprehending the predictability of the service. To have advantage it is necessary for all these data to be built a framework with the use of machine learning models, where a prior decision should be made to relate uncertainties and to collaborate in improving many perspectives of transport service such as operations, performance monitoring, scheduling and planning.
Table 2.2: Spatial and Temporal Detail for Automated Data (Furth et al.,2003) Level Description
Event-Independent
Event Records Between-Stop Performance A AVL without
real-time tracking
Infrequent (typi-cally 60 to 120s)
-
-B AVL with real-time tracking
Infrequent (typi-cally 60 to 120s)
Each time point -C APC or event
recorder
- Each time point -D Event recorder
with between-stop summaries
- Each stop and between-stop events Recorder events and summaries E Event-recorder / trip recorder
Very frequent (ev-ery second)
All types All events, full speed profile
State of the Art Overview: Bus Travel Time Prediction
2.3
Leading to the Bus Service Reliability
As one of the main concerning of this study, the reliability of the public transport has a fundamental role for transit companies that provides for their customer, thus passengers are always expecting at least a good service supplied by transport companies. Levinson(1991) explains the meaning of providing reliable service as for example to be on the right schedule every time, to low the variance of high passenger loads and to keep uniform headways. Therefore, this implies offering reliable services, compared to their schedule time running according to what was proposed in the schedule, which means without delays or much anticipation. The transit industry considers buses on travel time schedule, when they arrive or depart from a time point within one minute window early or five minutes in a late schedule (Bates,1986).
It is considerable some service adjustment of schedule, although reliability does not mean a bus to be on time all times, but to be on a right schedule for most of times. Unreliable transport service has the influence of affecting passengers into dissatisfaction with the system. Some problems have relation to wait time increase and travel time uncertainty (Strathman et al.,1998). The most relevant problems which affect bus variability and its travel time are related to congestion roads, traffic signals and passenger demand at stops, so traffic conditions are the most serious cause of low reliability (Ma et al.,2014).
When time variation is found in a balanced interval of time for a bus on a specific route, this might be considered a delay, some seconds or until one minute of adjustment because of some external factors that might affect a bus schedule plan. As we are focused on travel time and passenger demand,Kimpel(2001) describes, on his research work about transit service reliability and passenger demand a type of hypothetical relationship between demand and service quality for route level analysis which consists of:
Dr= f (SQr, SRr, ...Xr) (2.4)
SQr= f (Dr, SRr, ...Yr) (2.5)
SRr= f (Dr, SQr, ...Zr) (2.6)
These functions show that (Dr) represents the number of passenger boardings related to a
specified route, and (SQr) is represented by the quantity of service provided on a route, while
(SRr) is the measure of service reliability, (Xr) is the vector to explain passenger demand, (Yr) is
another route vector to explain service quantity and (Zr) is another route vector to explain transit
service reliability of this route (Kimpel,2001).
Some practices are considered to be made, in order to avoid problems related to public trans-port. These practices correspond to the bus travel time reliability. In a scenario that passengers tend to get to plan their way and time to go to a specific location by bus. They are given infor-mation through applications about next bus coming in advance of a real time bus. The bus travel time along of a route is more comfortable when given information about times and passengers get more satisfied with the service and can arrange their time in a schedule for their activity in a more
State of the Art Overview: Bus Travel Time Prediction
planned way. According toKimpel(2001), the reduction of the variability of bus arrival times and the decrease of average passenger wait times are consequences of an improved schedule adher-ence at bus stops providing benefits for passenger’s schedule plan. The author also states that this strategy gives more regularity, reducing bus bunching and efficiently ensure that buses are being used in their capacity.
In an opposite scenario where buses are running in a short headways and random arrivals define characteristics of heavy demand for transport service and under these conditions, buses will be running loaded of passengers on the other hand a bus behind, trailing the loaded bus will be in a light loads and boardings causing bus bunching problems (Strathman et al.,1998).
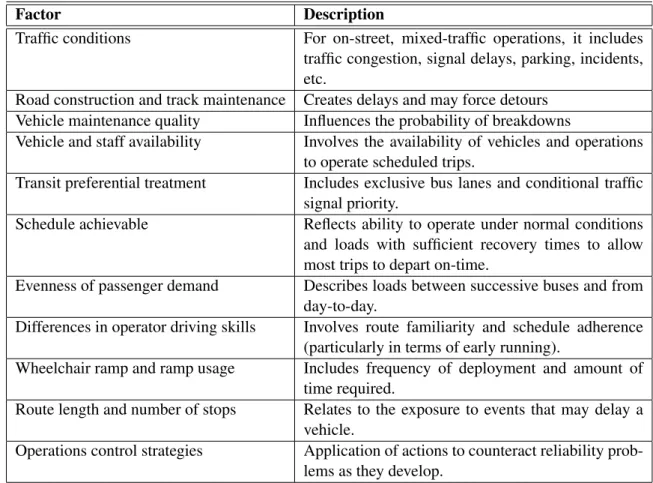
In the Transit Capacity and Quality of Service Manual (3rd Edition) is described a number of factors which affect bus service reliability. In table2.3we can see a description of each one considering its factor on service to have an overview about the most caused problem on service reliability.
Offering a more reliable transport service helps to improve conditions for passenger of public transportation system which concerns to predict travel time and consistent availability of seats and space on buses for passengers to feel comfortable to board, so this is a measure of quality of the public transport service under the right conditions (Bates et al.,2001;Brownstone and Small,
Table 2.3: Some Factor Affecting the Reliability of Bus Service (Cham,2006) Factor Description
Traffic conditions For on-street, mixed-traffic operations, it includes traffic congestion, signal delays, parking, incidents, etc.
Road construction and track maintenance Creates delays and may force detours Vehicle maintenance quality Influences the probability of breakdowns
Vehicle and staff availability Involves the availability of vehicles and operations to operate scheduled trips.
Transit preferential treatment Includes exclusive bus lanes and conditional traffic signal priority.
Schedule achievable Reflects ability to operate under normal conditions and loads with sufficient recovery times to allow most trips to depart on-time.
Evenness of passenger demand Describes loads between successive buses and from day-to-day.
Differences in operator driving skills Involves route familiarity and schedule adherence (particularly in terms of early running).
Wheelchair ramp and ramp usage Includes frequency of deployment and amount of time required.
Route length and number of stops Relates to the exposure to events that may delay a vehicle.
Operations control strategies Application of actions to counteract reliability prob-lems as they develop.
State of the Art Overview: Bus Travel Time Prediction
2005;Golob et al.,1972;Prashker,1979).Carrel et al.(2013) contributes saying that an improved reliability service can keep low passengers’ negative experiences due to both long waiting times at the bus stop or not be able to get on a bus because of excess of passengers.
We can consider two perspectives in relation to the prediction of bus arrival time, one from the operator’s side of the system and other from user’s. Although, the relevance of both to give the understanding about its importance and relevance, each one will be considered it differently. Operators tend to be more concerned in predicting reliably vehicles route, while passengers are interested in predicting the remaining waiting time at a particular bus stop (Oshyani and Cats,
2014).
To make an effort to ensure conditions in order to provide passenger a more reliable service it means always propose improvements according what they are more sensitive to be dissatisfied with how this service is offered, combine improvement factors which might have influence on travel time prediction and assess the implementation in a short period of time.
In the next section we describe the two most used techniques for travel time prediction.
2.4
Approaches on Bus Travel Time Prediction
The contribution on travel time prediction has highlighted for years of research through studies where the practical evidences have particularly made changes in the transport system. Approaches and models have been applied during the implementation on the purpose to figure it out how travel time could get more structural, providing the correct model for different approaches. Overall, travel time prediction is an effective way to get future travel times on a trip where passengers will have knowledge about the bus schedule plan in an ahead trip.
The characterization of some linear and no-linear models can be used and verified by solving travel time prediction with its variable parameter, although the most used model for this purpose is the linear one. Some of these models will help us to understand the problem and solve them as part of understanding of the problem that verifies linear or non-linear functions as for example Artificial Neural Networks (ANNs). For regression models that are considered as conventional approaches with dependent variables characterizing its main function (Padmanaban et al.,2009).
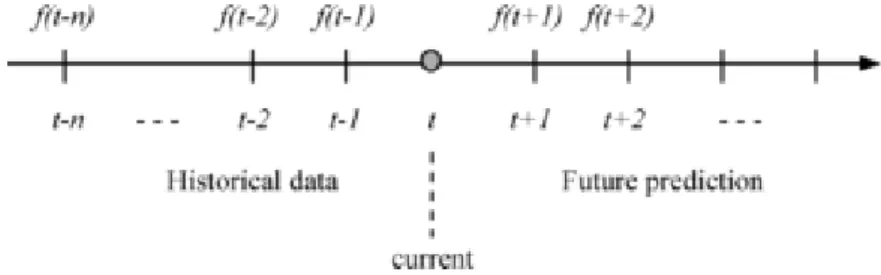
The two other methods and models are related to travel time prediction analysis which are data-driven methods and model-based approaches. For data-data-driven methods are employed historical travel time, beyond the use of related variable such as occupancy, speed, day of week and time of the day (Zou et al., 2014;Zeng and Zhang, 2013; Zhang and Haghani, 2015). The model-based technique uses different model for capturing the dynamics of system through settling a mathematical relationship with variables (Kumar et al.,2014). Other used approaches are related to historical and real time information. The travel time prediction for historical approach involves the average travel time at a specified period of time and it is also the same period over different days, then on the other hand, real time approach is represented by future time in an interval travel time as being the same as the current travel time over next days (Padmanaban et al.,2009).
State of the Art Overview: Bus Travel Time Prediction
Li et al.(2011) help us to better understand the facts of public bus arrival time with figure2.3, where the bus starts its trip from a specific bus stop until its final destination and shows the entire process as a trip.
Figure 2.3: Bus Travel Route (Li et al.,2011)
Some researchers have developed some algorithms to provide real-time bus arrival information through a historical approach where this information might be displayed for passenger at bus stop electronic boards.Lin and Zeng(1999) were two of the researchers who used a historical approach to analyse bus travel time prediction. They used bus location data to assess what was the difference waiting time at real time stops, scheduled arrival time and current arrival times.
Other two researchersShalaby and Farhan(2004), who also used bus arrival time prediction with automated data from AVL and APC. The authors developed two consistent Kalman filter model, which the first one predicts travel time and the second one predicts the dwell time, consid-ering the number of passengers boarding and alighting the bus at each bus stop as a function of their approach.
Another approach developed byMoreira-Matias et al.(2016) intended to eliminate bus bunch-ing for public transport in Porto, in real time, through an on-line learnbunch-ing proactive approach. This predictive method consists in using an automatic control framework to mitigate bus bunching and one of the causes of bus service unreliability. This kind of problem causes infrequency of buses on a route and unbalanced distribution along the bus schedule plan. The authors also present an effec-tive action to automatically prevent bus bunching using machine learning techniques and methods to get valuable information from location based data.
In this dissertation, the proposed analytical approach will be employed with some machine learning (ML) models for our framework to evaluate the influence of the number of passengers on the bus arrival time on each bus route and bus travel time. The advantage of this approach, the short-term forecast, is to quantify input variables to get immediate bus travel time prediction. The combination of effort to try to figure it out how predictive travel time is, in the sequence of BSP
State of the Art Overview: Bus Travel Time Prediction
provides us more certainty equivalent when accurate algorithms are applied in order to combine efficiency and accuracy to help relate the problem.
Chapter 3
Machine Learning Models and
Approaches in Travel Time Prediction
A Review
During years, the combination of analysis through Machine Learning (ML) models and algorithms has been important to achieve expressive results on a variety of problems. A ML model is struc-tured as part as the predictive analysis process and implementation related to data and a specified problem. ML concept is formulated on the idea that we build analytical models with automated software and with ability to learn interactively without periodic configuration or tuning it (Jou,
2017).
Some advantages in using ML methods, in a process of statistical analysis, are: the way of dealing with certain complex relationships between predictors in a large volume of data, the pro-cess of how each predictive model treats non-linear relationships with predictors and how it will treat noisy and complex data (Recknagel,2001).
Machine learning has powerful techniques in relating predictive analysis, and Artificial intel-ligence (AI) is another study area frequently correlated to important methods allowing the appli-cation of prediction for travel time which is part of ITS. AI, ML and statistics were applied, in the
Dahl et al.(2014) research work, in order to be categorized as search, optimization, classification or a combination of the methods. In the authors research work, they also state that the applicabil-ity of AI was given from the beginning by searching and optimizing car navigation to help drivers find their way. The potential of using ANN during identification, implementation and collection in complex and large amount of data is to be explained and investigated in more details in the next sections. Beyond ANN, others predictive models will be discussed such as Random Forests model, Linear regression model and Support Vector Regression that will be compared in our data set.
Machine Learning Models and Approaches in Travel Time Prediction
3.1
Predictive Methods and Analyses
Conducting predictive analysis of travel time is also a way to understand correlated approaches, which is performed in a set of characteristics through implementation of statistical methods. It can be useful to provide accurate information about buses travel time prediction, as mentioned on this dissertation. So historical approach is one of the based-models considering the structure of the database, by making use of historical data and a statistical analysis of travel time average by taking in consideration one bus route. Our approach focus is on the use of historical data, perceiving the output generated through some important features that will be relevant to consider as it is the verification analysis of passenger amount along bus route. To provide a fully understanding and some prior knowledge about ML, it is advisable to cover on the matter of learning methods and definitions which are explained below:
• Supervised Learning: The analysis is to predict the output of some component and these components give us the correct available feedback in a certain way, which confirms or pro-vides the intuition about what correct output is. Beyond the prediction of a certain action which will provide certain output with the perception of description of the correct output in an algorithm (Russell and Norvig,2013).
• Unsupervised Learning: It represents the lack of knowledge about the output. Reminding that an unsupervised learner might have relationships inside its perception in a supervised method. This ability to learn can predict future perception with previous percepts, but it cannot learn without a previous useful function and some restrictions (Russell and Norvig,
2013).
• Off-line Learning: This is a method by applying in a static dataset and it does not consider how dynamic the status and tracking of the target is on the data beyond their correlation (Jou,2017).
• On-line Learning: This method is supposed to be applied in a live dataset, which is able to learn from the dataset and the use features considering the status and tracking of the data target. To be able to analyse this real data even with an enhanced ML models, in on-line learning is a difficult task because at the same time the data is coming in to be processed in a smart way and run with these on-line algorithms (Jou,2017).
• Incremental Learning: A learning algorithm has an incremental method when any training data sample contains e1....en, and it generates a list of hypotheses values h0....hn, so hi+ 1
will depend on hifor the current ei(Giraud-Carrier,2000)
• Real-Time Learning: This is a somewhat similar method to on-line, however this method has the ability to process the data and use their features in real time with a up-to-date model while the previous sample is processed and the next one is arriving (Huang et al.,2006).
Machine Learning Models and Approaches in Travel Time Prediction
Two other consistent methods (Analytical and Inductive) can be applied for travel time pre-diction. These methods are the baseline intuition of better understanding different formulations of learning problems, taking into account some generalizations. Identifying features from observed training samples where exist distinction of positive and negative training sample is more applicable to the inductive method (Mitchell,1997). A more detailed explanation about these two methods is demonstrated byMitchell(1997), in which is possible to observe the formulation of difference between them:
• Inductive learning: A hypothesis space H is given by the learner, and that shall select a hypothesis as an output, generating a set of training samples D = h(x1, f (x1)i, ..., hxn, f (xn)i)
where f (xi) represents the target value of instance xi. A consistent training sample is the
output of the learner.
• Analytical learning: The same happens to the inductive learning where the hypothesis space H and training samples D are included with the learner input, but for the analytical learning the provided input generated by the a learner it is called domain theory B, which has intrin-sically the background knowledge to be explained by observed training samples. For the consistent training samples D and domain theory B in which have a desired output learner and have hypothesis from h to H.
Mendes-Moreira (2008) contributes stating, in his research work, that the use of inductive learning techniques for prediction aims to learn a model from the data set, where this data set has V as input variables. It is only one output variable and through this model we are able to predict with new data frame.
Some other approaches, such as historical data and real time might be used in the implemen-tation process, depending on your aim to assess bus travel time prediction which correspond to analyses processed in the dataset and following the admissibility of features data as well. In the next section, it will be addressed the importance of predictive models in this work, such as exam-ples of ML models which should be used during the algorithm development explanation.
3.2
The Relevancy of Predictive Models
It was said at the beginning of the chapter3that is addressed the importance of predictive model, so we will detail their relevance in this dissertation, in order to present the most used models in this area of research. However, it will be necessary to compose a complete explanation for each model relating to the objective and the proposed analysis.
ML has two stages, one is the process of choosing a candidate model among those that might be applied to solve predictive problem, the other one is related to the parameters of the model where this learning process implemented in a data structure (Jin and Sendhoff,2008). What is also important to say about these models is that they can be used in travel time prediction, without previous analysis or during the implementation process to address the traffic data (Altinkaya and Zontul,2013).
Machine Learning Models and Approaches in Travel Time Prediction
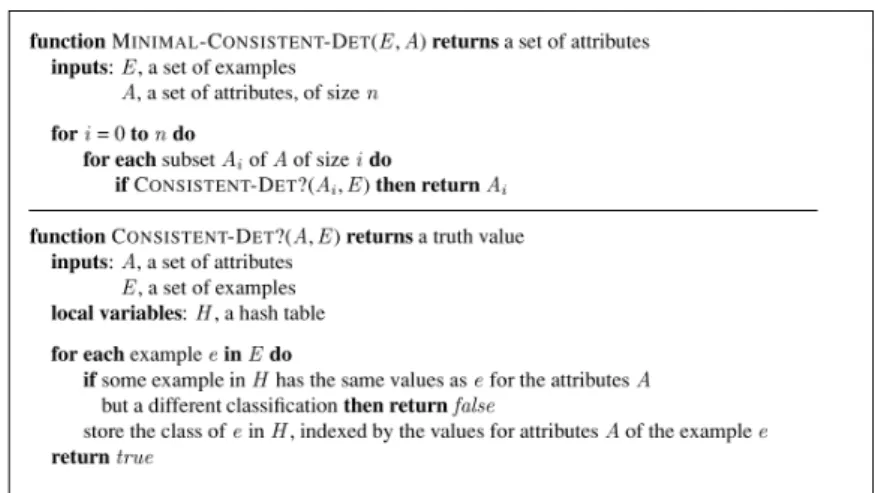
The algorithms infer different ML models that can be useful to make sense of how relevant the information is. Who help us to understand this building process of algorithm learning and the use of relevance-based learning areRussell and Norvig(2013). The authors suggest an algo-rithm to attempt to find a simpler and consistent determination through observations where this determination P Q, so correlations among examples between P and Q.
An example of algorithm is shown in figure3.1. It is an example of how to find the minimal consistent determination to represent a basic algorithm with a group of attributes (Russell and Norvig,2013).
Figure 3.1: Minimal consistent determination algorithm (Russell and Norvig,2013)
ML provides the idea of looking for possible and alternative forms of assumptions in the data analysis development process, nevertheless the involvement includes getting insights from our training and test data, which makes to review any possible constraints might create any noise into data analysis. So the concept of ML learning as the research of parameters is described as the task through a large space of assumptions and defined by the representation of hypothesis, notwithstanding it is relevant to consider that the selection of hypothesis representation should be defined in the algorithm and all hypotheses space learned and developed on a computer program (Mitchell,1997).
In different fields of research, ML predictive models have an important role by which they can be applied in different approaches, particularly for travel time prediction its models have been considered valuable in predicting travelling time of buses given by complex non-linear data relationship. It will be addressed, in the following sections, some relevant ML models, such as historical model, regression model, including artificial neural network model, support vector regression model, linear model, Kalman filtering-based model, and dynamic model, as a literature review and they have been applied to bus travel time prediction by researchers with successful results nowadays.
Machine Learning Models and Approaches in Travel Time Prediction
3.3
The Cross Validation Method
The cross validation is a method to validate a predictor which does not require any assumption. There are two process in using cross validation: the first one is used to learn or train the model and the second one is used to validate the model. This method is also used to evaluate and compare ML algorithm which is built every time using K-1 folds. In the remaining fold which is used as test set, and then the process is repeated K times, always considering the out-of-sample error as the mean squared prediction errors with k different folds (Viviano,2016). Its validation technique has been used in different models in order to evaluate the results of a statistical analysis process that integrates in a data set and in the training step.
The two existing types of cross validation are methods used to implement the cross validation into data set, the first one is called exhaustive techniques and the second one is non-exhaustive techniques. The exhaustive technique is related to split the original data set into different train-ing and validation samples besides learntrain-ing and testtrain-ing all possible formats, which consists of the leave-one-out method. The non-exhaustive technique is the opposite of the other one when not compute all the formats of splitting the original data set, which consists of the k-fold cross validation and holdout methods.
The leave one out cross validation consists in getting k=n, where n takes the value of the number of observations which means that n separate times. The holdout cross validation method has no benefits to use all the available data, if the use of half the data for the test set so the training set is built on half the data and there might get weak hypothesis but the opposite for the test set with 10% of the data, then a statistical change from the actual accuracy gets poor (Russell and Norvig,2013).
The k-fold cross validation is used to get an accurate estimation using its technique which basically has the idea of each example shows double duty for the training data and test data. The first step is to split data into k equal subsets to perform k round of learning, thus the average test set score of the k rounds gets a better estimate rather than a single score (Russell and Norvig,2013).
The k-fold cross validation has been proposed by researchers in the matter of predicting travel time based on historical data and it was used to partition data randomly into subsets, howeverDahl et al.(2014) noticed to the use of this type of techniques in this analysis should be avoided because of the only travel time to forecast is the future.
Cross validation and sliding windows method are the two important methods to be validated with predictive models as described on this dissertation. In the next section we will explain about the sliding window method.
3.4
The Sliding Window Method
Sliding window is another important method used with predictive models that guarantees the use of the most recent data, it remains active in order to get the current ones. The two methods are equally important in the sliding windows technique, which is the fixed window and time-stamp
Machine Learning Models and Approaches in Travel Time Prediction
based window. The fixed window contains data items arriving at a time for the most recent "n" items remain active for a fixed parameter "n". The times-tamp-based window consists in storing many data items arrive in bursts at a single step and for this technique the last "t" steps gets active for a fixed window parameter "t" (Braverman et al.,2012).
Contextualizing the sliding window technique is an effective method for stream data set where we can choose the most attractive part of data, which can vary with the proposed analysis and the data (i.e. in a financial data frame an assessment using sliding window can vary depending on the month of the year where the seasonality of the data is more biased than the other months). This might not have any generalization from your incoming data set and it still can match with your aim to find out and guarantee what are the most important and recent data.
Zhou et al.(2016) proposed in their research work, a sliding window ensemble framework which the aim was to determine the performance of the model used to predict passenger demand on bus services and estimate accuracy using time series forecasting error metric. The authors explain that the sliding window ensemble framework as being the use of three distinct predictive methods which learns from long, medium and short-term historical data. The combination of the three models based on the weighted ensemble where is applied to improve the prediction using a sliding window method. They also applied time-varying Poisson averaged models to be updated every 24 hours and a sliding window of 4 hours. The authors concluded that their implementation of sliding window ensemble was the best model in every shift and period with high accuracy of 78%.
The contribution for another research was described byFerreira and Ruano (2009) in their research work about online sliding window methods. They provided a method to adapt an online sliding window and model parameters to be adjusted when new information is added, so the main idea is to find a termination criterion at every moment a new input and output standard data is appended and create a need to carry out a number of interactions in the training method and meet the termination criteria.
It is notable that the sliding window method has been implemented in different forms and models and its importance has been registered in many research works. It is described how sliding window is relevant in our bus travel time prediction analysis and its implementation steps in this dissertation.
3.5
Linear Regression Model
Linear regression model can be used to solve a regression problem where the dependency is known or assumed to be a linear function. Its efficient form of calculating optimal parameters with ac-curacy by using such as gradient descent as precise computing calculation (Russell and Norvig,
2013). It has been the models employed byBin et al.(2006) to solve bus arrival time prediction. In a straightforward definition we begin split linear regression in two analysis components, the first one is addressed to univariate linear regression and the second one is the multivariate linear regression. For the univariate one is defined with input x and output y which has the computation
Machine Learning Models and Approaches in Travel Time Prediction
of y = ω1x+ ω0, where ω0and ω1are real coefficients to be used as learner (Russell and Norvig,
2013). The following formula defines w as a vector of [ω0, ω1]:
hw= ωx+ ω0. (3.1)
In the process of finding the hw that better fits a line to our data and gives the values of
weights[ω0, ω1] and minimizes the loss which is described byRussell and Norvig(2013) below:
Loss(hw) = N
∑
j=1 L2(yj, hw)) = N∑
j=1 (yj− hw(xj))2= N∑
j1 (yj− (ω1xj+ ω0))2. (3.2)If we want to minimize finding the value of w∗ = argminwLoos(hw), so we must sum the
function until its partial derivative gets zero along with its respective ω0and ω1: N
∑
j=1 (yj− (ω1x1+ ω0))2 (3.3) ∂ d ∂ dω0 N∑
j=1 (yj− (ω1xj+ ω0))2and N∑
j1 (yj− (ω1xj+ ω0))2= 0 (3.4)It is important to consider that for linear regression models it might vary from different formu-lated function depending on the proposed problem solution and the form that its function might be addressed. Some functions help us to address the problem in a efficient way and build the resolu-tion close to the optimal point. Below it is described byRussell and Norvig(2013) some of these function which make part of learning regression approach.
• Gradient descent is a function to minimize the loss, choosing a starting point in weight space (ω0, ω1) to move downward to find another point and this process is repeated until it
converges to a minimum loss.
• Batch gradient descent is another function inside the univariate linear regression model, and its convergence must be achieved in only one global minimum, but α must be chosen in a really small value. Many steps will guarantee the cycle for training data and its each steps. • Stochastic gradient descent is considered a single training point for once, it can be used for
on-line or off-line setting. The cycle steps in the data are taking as many times as is needed. This function is faster than batch gradient, but even with a fixed α its convergence is not guaranteed.
Now, multivariate linear function is an extension of univariate linear regression where each example xj is a vector element of n. So the function is represented by the hypothesis space form,
described by authorsRussell and Norvig(2013).
hsω(xj) = ω0+ ω1xj, 1 + ... + ωnxj, n = ω0+
∑
i