Marine by-products in Portugal: sources, actual processing and
alternative valorisation
Dissertation for the obtainment of the master´s degree in Marine Biology
Supervisors: Professor Doutor Paulo Vaz-Pires
Abel Salazar Institute for the Biomedical Sciences University of Porto - Portugal
Professora Doutora Teresa Modesto
Faculty of Sciences and Technology
University of Algarve - Portugal
Raquel Susana Teles Coimbra January 2016
2
Marine by-products in Portugal: sources, actual processing and
alternative valorisation
Raquel Susana Teles Coimbra
Dissertation for the obtention of the master´s degree in
Marine Biology
Supervisors: Professor Doutor Paulo Vaz-Pires
Abel Salazar Institute for the Biomedical Sciences University of Porto - Portugal
Professora Doutora Teresa Modesto
Faculty of Sciences and Technology
University of Algarve - Portugal
3
Marine by-products in Portugal: sources, actual processing and
alternative valorisation
Declaração de autoria de trabalho
“Declaro ser a autora deste trabalho que é original e inédito. Autores e trabalhos consultados estão devidamente citados no texto e constam da listagem de referências incluída”
“Copyright” em nome de Raquel Susana Teles Coimbra.
A Universidade do Algarve tem o direito perpétuo e sem limites geográficos, de arquivar e publicitar este trabalho através de exemplares impressos reproduzidos em papel ou de forma digital, ou por qualquer outro meio conhecido ou que venha a ser inventado, de o divulgar através de repositórios científicos e de admitir a sua cópia e distribuição com objetivos educacionais ou de investigação, não comerciais, desde que seja dado crédito ao autor e editor.
4 Snapne’pi nitya jagatam ashesam
srashta cha hanta vibhura prabheyaha trata tvam eka strividho vibinnaha tam tvam nrisimham satatam nato’smi
I offer my obeisance unto Lord Nrisimha who is the creator, the maintainer and the destroyer of the entire universe. Although You perform all of these three acts simultaneously, You are completely beyond these activities. You are the all-pervading, unlimited supreme spirit.
5
ACKNOWLEDGMENTS
Well, the elaboration of this thesis witnessed several scenarios of my life: living in 4 different cities of 3 different countries, learning one new language, starting to learn another one, being possible only due to the kind help of:
Prof. Paulo Vaz-Pires my supervisor and great well-wisher who had the patience to introduce a radical vegetarian to the world of, not only fish, but fish “waste”! His patience and kind help before my complete ignorance made it all happen,
Engineer Irineu Batista, for his precious and always ready help and knowledge and….for the light meal moments in which the “team of fish eaters” (they know who they are!) was trying to convert me! (Unsuccessfully though….!),
MARMED project funding for the material facilities,
Prof. Alexandra Teodósio for all the support and encouragement even still on the bureaucratic process of applying to the master’s course,
Prof. Teresa Modesto who promptly accepted to be my UAlg supervisor on the spot and whose support was amazing!
To my sweet friends, whose presence in my life make it all make sense: my spiritual master whose letters lately end like “how can I help?!!”, João and Paula for all the material help, kind advices, support, support, support (!), Robson and Ana for the accommodation in Lisbon and all the care, Leonor, for maintaining me sane through this, Radha Seva for always, always, always being available from the distant Russia for my mental trips despite busy herself with her thesis, Ananta Sesa for his brotherly mood while providing me vitamin B, relaxing music, relaxing talks and encouragement, Carla Graça cannot even enumerate all the support!, Pedro Mendes for his proof reading and atheistic challenges! J. P. for the late proof reading (hope I didn’t put you under too much stress), Radha Madhava Sacisuta for believing it, when I really didn´t have a clue from where to start, Nayana Manjari and Krishna Premarupa for allowing my leave from my service to happen and for all the support, Maharani for the talks during lunch time that during one month were basically my only 3D, real life contact, Govinda and Rohini for feeding me nicely, to Maria for the daily phone calls, to Cristina and Nrisimha for all the care and
6 adventures, to Miguel simply for existing, to Telma and João for all the printing efforts even from a distance (!), to Acarya who was “kidnapped” in Frankfurt on her stopper from India to Europe to come to replace me in my service (and for her priceless sense of humor!), to little Shyama for replacing me on the last most stressful week and to all those shining stars in my life that make it worth it.
7
RESUMO
A produção de alimento de origem aquática em 2010 foi de 148.5 milhões de t de peixe (a pesca contribuiu com 88.6 milhões de t, cerca de 60% da produção total e a aquacultura com 59.9 milhões de t, cerca de 40% da produção total; destes, 128 milhões de t (86.5%) foram canalizados para a alimentação humana e os restantes 20 milhões de t (13.5%) utilizados para a produção de farinha e óleo de peixe. O pescado fornece 20% do aporte de proteína animal a cerca de 30 milhões de pessoas a nível mundial.
O fornecimento mundial de pescado tem aumentado significativamente devido ao crescimento sustentável da sua produção e à melhoria dos canais de distribuição nas últimas 5 décadas (taxa média de 3.2%/ano no período de 1961-2009), ultrapassando o aumento do crescimento populacional (1.7%/ano). Como consequência, o fornecimento mundial de pescado per capita aumentou de 9.9 kg (média do peso vivo equivalente) nos anos 60 para 18.4 kg em 2009. A percentagem crescente de stocks pesqueiros sobre-explorados, a diminuição da pesca de espécies marinhas e a decrescente proporção de espécies que não estão completamente exploradas a nível global nos últimos anos são indícios de que o estado da pesca marinha mundial está a piorar e tem um impacto negativo na produção de pescado. A sobre-exploração tem um impacto negativo não só a nível ecológico mas também ao nível da produção pesqueira dado esta estar reduzida, conduzindo a futuros impactos sociais e económicos negativos. Em relação à aquacultura, a sua produção aumentou cerca de 12 vezes entre 1980 e 2010, com uma taxa média anual de 8.8%, continuando a crescer a partir daí apesar de a uma taxa mais baixa. Em 2010 a aquacultura atingiu o seu máximo com 60 milhões de t de produção, correspondente a um valor estimado em 125 mil milhões de dólares (valores excluindo plantas aquáticas e produtos não alimentares).
Atualmente, na pesca, os indivíduos de tamanho abaixo do mínimo legal, com valor comercial baixo ou as espécies sem quota piscatória são normalmente devolvidos ao mar – as chamadas devoluções ao mar. A percentagem de devoluções ao mar varia dentro das frotas pesqueiras dado depender da seletividade dos mecanismos de pesca. As devoluções ao mar estão estimadas em 7.3 milhões de t/ano (cerca de 8% da captura total de pescado) para o período entre 1992 e 2001. Estas devoluções são um desperdício de recursos biológicos, sendo em parte responsáveis pela
8 depleção das populações de espécies aquáticas. A frota de arrasto tem um papel muito importante na captura e dispersão de biomassa, dada a significativa porção de capturas na frota de arrasto ser de espécies não-alvo, sendo portanto devolvidas ao mar já mortas. Vários autores consideram que a grande quantidade de peixes , crustáceos e moluscos mortos devolvidos ao mar em áreas pesqueiras tem potenciais repercussões ao nível das comunidades biológicas da superfície, coluna de água e sedimento. Para além das devoluções ao mar, outra fonte de sub-produtos marinhos é o processamento a bordo, principalmente a evisceração e a consequente limpeza, gerando quantidades consideráveis (por vezes cerca de 80% do indivíduo) de desperdícios como cabeças, espinhas, vísceras, pele, etc. Para além dos efeitos adversos na cadeia trófica, esta evisceração a bordo contribui para a acumulação de poluentes como PCBs, dioxinas e metais pesados e a dispersão, nas áreas de pesca, dos parasitas existentes nas vísceras. Para além da FAO, a Comissão Europeia também tomou várias ações para a implementação das políticas de “zero-desperdícios” e “não devoluções ao mar” salientando assim a importância da valorização dos produtos marinhos como medida de redução do desperdício. Os sub-produtos marinhos também podem ter origem nos portos e lotas onde ocorre a primeira venda de pescado, que pode ser rejeitado por inspeção sanitária ou retirado por não ser vendido. Outra fonte de sub-produtos de origem marinha é a indústria transformadora do pescado, por exemplo as indústrias de salga e seca de bacalhau, de conservas e de congelação de pescado. Neste trabalho foi efetuada uma sondagem com uma abordagem multimetódica com o objetivo de avaliar as quantidades de subprodutos marinhos produzidos em Portugal e as suas principais utilizações.
Esta pesquisa foi efetuada, dependendo da situação, através de questionários enviados por fax ou email às empresas da indústria marinha, entrevistas com os responsáveis pelas empresas e consulta de registos relacionados com o tema, obtidos das entidades competentes. Efetuou-se também uma pesquisa bibliográfica sobre as atuais valorizações de subprodutos de origem marinha e potenciais utilizações. Da pesquisa biliográfica aos trabalhos do grupo ICES concluíu-se que em Portugal as devoluções ao mar variam entre cerca de 1000 t/ano no caso da cavala (Scomber colias) e 8 t/ano no caso do Pimpim (Capros aper). Em relação aos valores de retiradas e rejeições os valores situam-se entre cerca de 3000 t/ano e 700 t/ano, respectivamente.
9 Do total de respostas aos questionários (cerca de 17%) concluiu-se que a indústria que mais significativamente contribui para a geração de subprodutos é a conserveira, principalmente nos Açores, atingindo valores de cerca de 3,000 t/ano. Em Portugal continental as indústrias que produzem mais subprodutos são a salga e seca de bacalhau na zona da ria de Aveiro, com cerca de 1,300 t/ano e a conserveira no Algarve, com cerca de 1,200 t/ano. De salientar que a percentagem de respostas da zona Norte foi relativamente menor, não refletindo assim a realidade regional em termos de indústria marinha. Das entrevistas às fábricas de farinha de peixe e consulta de registos, concluiu-se que as 4 fábricas existentes em Portugal processam cerca de 135,000 t/ano; cerca de 900 t/ano são recolhidas em Portugal e processadas no Norte de Espanha e cerca de 500 t/ano são geradas na Andaluzia e processadas em Portugal. Na ilha da Madeira todos os resíduos atualmente têm como destino o aterro sanitário, por inexistência de soluções alternativas. Para além da produção de farinha e óleo de peixe, outras utilizações dos subprodutos marinhos incluem a extracção de quitosano para aplicações diversas como suplementos alimentares, e a extração de várias enzimas ativas a baixas temperaturas como a tripsina, elastase e colagenases serinas, com diversas aplicações que têm em conta a sua especificidade em relação à temperatura em que se encontram ativas.
10
ABSTRACT
The total production of aquatic food, in 2010, was estimated in 148.5 million t of fish (fish capture contributed with 60% and aquaculture with 40%) from which 86.5% were directed to human consumption with the remaining 13.5% used mainly for the production of fish meal and oil. Nowadays fish discards are estimated in 8% of the total fish catch with important ecological and economic impacts. The marine processing industry also generates large quantities of “waste”. Due to the new European Commission policies of “no-discard” and “zero-waste” several research projects have been created to valorise marine by-products, MARMED project (within which this thesis was made) being one of them. In this study a multi-method survey was conducted to inquire about the quantities and types of marine by-products and discards generated and processed in Portugal. These included three types of methods: written questionnaires to the fish processing industries, interviews with the managers and records consultation. From around 17% total replies it was visible that in Portugal the industry that more contributes to the generation of marine by-products is the canning industry, particularly in the Açores with values of 3,000 t/year approximately, followed by the cod salting and drying industry in the central region of the continental Portugal with 1,300 t/year approximately. The information gathered from the four fish meal factories existing in Portugal showed that in total they process around 135,000 t/year of marine by-products, around 900 t/year are produced in Portugal but processed in Spain, and around 500 t/year are produced in Andalucia and processed in Portugal. In Madeira all by-products go to landfill due to the lack of other valorization solutions. Besides the production of fish meal and fish oil, other utilizations of marine by-products include the extraction of chitosan for several applications like food supplements, the extraction of several enzymes active at low temperatures like tripsine, elastase and others.
KEYWORDS: Marine products; Portuguese fisheries; Alternative valorisation of marine
11
Host Institutions and conditions
Abel Salazar Institute for the Biomedical Sciences of the University of Porto (Institution where the work was done) and the Faculty of Sciences and Technology of the University of Algarve (Institution that confers the degree). This work was developed in the frame of the Project MARMED: Development of innovating biomedical products from marine resources valorisation (2011-1/164), funded from the European Regional Development Fund through the Atlantic Area Transnational Cooperation Program.
12
INDEX
1. Literature review... 16
1.1 Importance of marine products, fisheries and aquaculture in the world ... 16
1.2 Marine industry in Portugal ... 26
1.2.1 Fisheries ... 26
1.2.2 Aquaculture ... 27
1.2.3 Fish processing industry ... 28
1.3 Definitions ... 28
1.4 Characteristics of marine by-products ... 31
1.5 Sources of marine by-products ... 36
1.5.1 On-board: discards, by-catch and on-board fish processing industry ... 36
1.5.2 In-land ... 40
1.6 Main utilizations of marine by-products ... 42
1.7 Other initiatives to reduce waste and add value to marine by-products ... 57
2 MARMED PROJECT AND STUDY AIMS ... 60
3 DATA SOURCES AND METHODOLOGY ... 61
4 RESULTS ... 64
5 DISCUSSION OF RESULTS ... 70
6 CONCLUSIONS ... 77
13
TABLE OF FIGURES
Figure 1.1 - World capture fisheries and aquaculture production (FAO, 2012). ... 18
Figure 1.2 - World fish use and supply (FAO, 2012). ... 18
Figure 1.3 - World capture fisheries production (inland and marine waters) (FAO, 2012). ... 20
Figure 1.4 - Overfishing ecosystem impact (University of Waikato, 2012). ... 21
Figure 1.5 - Global trends in the state of world marine fish stocks (FAO, 2012). ... 22
Figure 1.6 - Utilization of world fisheries production (FAO, 2012). ... 24
Figure 1.7 - World aquaculture production of non-fed and fed species (FAO, 2012). ... 25
Figure 1.8 - By-products generated during filleting of gadiform species with suggested methods of preservation and bulk production (Falch et al, 2007). ... 40
Figure 1.9 - Fish by-products and their possible uses (compiled from Andrieux,2004; Gildberg et al., 2002; Guérard et al., 2004; Liaset et al., 2003 in Guérard, 2007). ... 44
Figure 1.10 - Price for fish and fish waste (Taylor and Himonides, 2007). ... 44
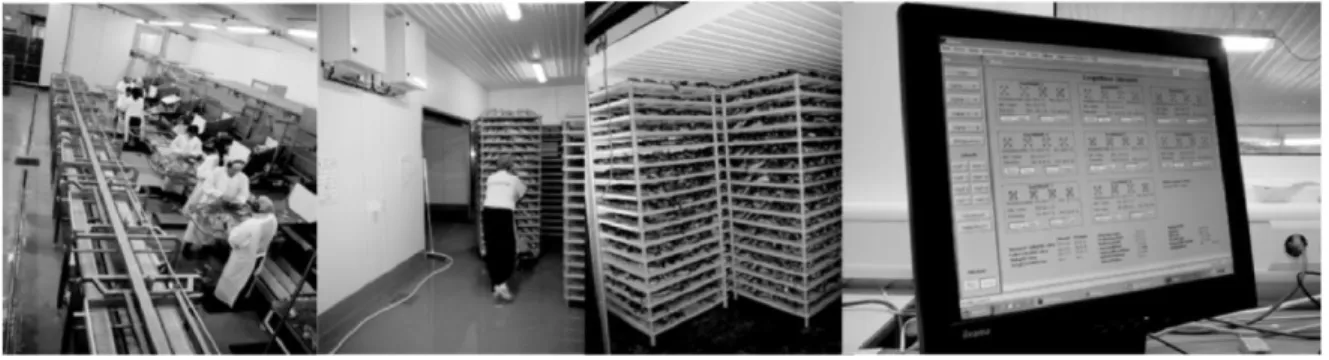
Figure 1.11 - Modern computer-controlled drying facility for cod heads: heads processing, racks transport, racks in the primary drying chamber and control board. ... 46
Figure 1.12 - Illustration of three alternative production lines for on-board processing of by-products . ... 48
Figure 1.13 - The MESA 850 cod backbone processor, and recovered meat and swim bladder (Kristbergsson and Arason, 2007). ... 51
Figure 1.14 - Fish meal plant with fish meal and oil streams (Kristbergsson and Arason, 2007) 52 Figure 1.15 - Example of a chitosan dietary supplement commercially available on Italian supermarkets. ... 55
Figure 1.16 - Scheme for the utilization of fish by-products for human consumption in general (Batista, 2007). ... 56
Figure 4.1- Evolution of auction rejections and withdrawals (Batista, 2013 oral communication)...67
Figure 4.2 - Regional distribution of marine by-products available in Portugal. ... 68
Figure 4.3 - Main destination of marine by-products available in Portugal. ... 69
Figure 4.4 - Monthly evolution of marine by-products received by a fish meal plant in continental Portugal. ... 69
14 Figure 5.1 - An example showing applications for the MaxFish program to plan the utilisation of by-products (Falch et al, 2007). ... 75
15
TABLE OF TABLES
Table 1.1 - World capture fisheries and aquaculture production and utilization (FAO, 2012). .. 17
Table 1.2 – Main landings in the Portuguese auctions in 2013 (INE, 2014). ... 27
Table 1.3– Amount of different by-products fractions (Rustad, 2007). ... 32
Table 1.4– Constituents of by-products (Shahidi, 2007). ... 32
Table 1.5– Protein content in different by-product fractions (Rustad, 2007). ... 33
Table 1.6- Proposed value chains for marine by-products (BIOTECMAR project, Sotelo et al., 2011). ... 58
Table 3.1 - Distribution of successful sent out questionnaires and invitations for interviews by industry categories. ... 62
Table 4.1- Summary of the replies to surveys and standardized interviews in number and percentage. ... 64
Table 4.2 - Discards by species in Portuguese ICES (International Council for the Exploration of the Sea) Division IXa. ... 65
16
1. LITERATURE REVIEW
1.1 Importance of marine products, fisheries and aquaculture in the world
Fishing, as an ancient activity, was always an important part of many human societies. Nevertheless it was during the 20th century that the fishing activity had a dramatic change due to several factors: the freezing technology invention, the fishing effort increase due to the introduction of steam trawling and all the improvements in fishing tackle/equipment (Blanco et al., 2007). In 1885, the concerns about the decrease of specific fish stocks in coastal waters started (Kreuzer, 1974). By then, the idea of the inexhaustibility of the sea was considered erroneous in the McIntosh´s book “Resources of the Sea”, thus implying the need for the conservation of fish stocks (Blanco et al., 2007).
The potential of fisheries has been estimated through several institutions being FAO (Food and Agriculture Organization of the United Nations) Fishery Resources division one of them.
Since the 1960’s, FAO has been monitoring the state of capture fisheries. The results of this monitoring show that the total world marine capture fish production increased at a rate of 6% per year since 1950 (19.3 million t) to 1970 (around 60 million t). The estimation of maximum potential of the traditionally exploited marine species (excluding cephalopods) was 80-100 million t/year. This estimation was further confirmed by later studies. In 1989 and 2002 this amount was surpassed with more than 100 million t and 134 million t, respectively (Blanco et al., 2007).
Marine captures contributed around 86% to this production, even though this contribution has diminished in the last decades due to the faster expansion of marine and inland water aquaculture (FAO, 2005).
In terms of total production of aquatic food in 2010, for instance, it was estimated in 148.5 million t of fish (fish capture contributed with 88.6 million t, around 60% of the total production, and aquaculture with 59.9 million t, around 40% of the total production) (Table 1.1 and Fig. 1.1) from which 128 million t (86.5%) were canalized for human consumption with the remaining 13.5% (20 million t) utilized mainly for the production of fish meal and oil. Estimated numbers point to an increase in 2011 (154 and 131 million t, respectively) (Fig. 1.2) (FAO, 2012).
17 Table 1.1 - World capture fisheries and aquaculture production and utilization
(FAO, 2012).
World fish food supply has increased significantly, due to sustained growth in fish production and the improvement in the distribution channels, in the last five decades (average rate 3.2%/year in the period of 1961-2009) surpassing the increase in the world population (1.7 %/year). As a consequence, the world per capita food fish supply increased from 9.9 kg (average live weight equivalent) in the 1960s to 18.4 kg in 2009 indicating a further increase in fish consumption to 18.6 kg (FAO, 2012).
Regarding the contribution of fish to the human protein intake, several studies have been made namely by FAO. These studies state that the protein from fish origin was 16.6 % of the world´s population intake of animal protein and 6.5 % of the total protein intake in 2009. Fish provides around 3.0 billion people worldwide with 20% of their intake of animal protein and 4.3 billion people with 15% of this type of protein.
18 Figure 1.1 - World capture fisheries and aquaculture production (FAO, 2012).
Figure 1.2 - World fish use and supply (FAO, 2012).
There is a visible difference between developed and developing countries regarding the contribution of fish to animal protein intake. In developing countries, although the values are
19 low, they can reach 19.2 % and 24.0% in Low-Income, Food-Deficit Countries (LIFDC). Both in developing and developed countries this percentage has decreased slightly in recent years due to the rapid growth of other animal proteins (FAO, 2012).
Concerning the overall global capture fisheries production, in general it is stable at about 90 million t, despite the visible changes in catch trends depending on the countries, fishing area and species. Landings of all marine species, except anchoveta, ranged from 72.1 million to 73.3 million t between 2004-2010. On the other hand, the most visible changes were in anchoveta landings in the Southeast Pacific that decreased from 10.7 million t in 2004 to 4.2 million t in 2010. Inland water capture production had a continuous growth, with an overall increase of 2.6 million t between 2004-2010 (Fig. 1.3). Regarding inland waters, its total global capture production has increased significantly since the mid-2000s with an estimated production reported of 11.2 million t in 2010 and an increase of 30 % since 2004, even though there may be significant underestimations in some regions (FAO, 2012).
Fisheries and aquaculture provide numerous jobs, besides the primary production sector, like in ancillary activities such as processing, packaging, marketing and distribution, manufacturing of fish-processing equipment, net and gear making, ice production and supply, boat construction and maintenance, research and administration. This employment (together with dependents) is estimated to support the livelihoods of 660-820 million people: 10-12% of the world´s population (FAO, 2012).
Regarding the world total number of fishing vessels, it was estimated in 2010 in 4.36 million, from which 74% (3.23 million) vessels were considered to operate in marine waters and the remaining 1.13 million operating in inland waters (FAO, 2012).
Nowadays one major concern is focused on the exploited fish stocks. In this regard, studies by FAO show that the world´s marine fisheries have increased significantly between 1950 and 1996 from 16.8 million t to 86.4 million t, respectively, after which there was a decrease before stabilization at about 80 million t. In 2010 there was a global record production of 77.4 million t. The proportion of non-fully exploited stocks has been decreasing gradually since 1974, date of the first FAO assessment. On the other hand, the percentage of the overexploited stocks has been increasing, markedly in late 1970s and 1980s from 10% in 1974 to 26% in 1989 (Fig. 1.5).
20 Figure 1.3 - World capture fisheries production (inland and marine waters)
21 The number of overexploited stocks continued to increase, after the 1990s but at a slower rate. Figure 1.4 shows the impact of overfishing on the ecosystem.
If the plans to rebuild the overexploited stocks are put in place, then it is possible to have higher production even from these stocks. Regarding the fraction of fully exploited stocks, producing catches reaching their maximum sustainable production and with no room for further expansion,
Figure 1.4 - Overfishing ecosystem impact (University of Waikato, 2012 ).
thus requiring effective management in order to avoid decline, it had minimal changes over the time: from 1974 to 1985, around 50%, in 1989 it decreased to 43% and in 2009 it increased to 57%. Around 29.9% of the stocks are classified as overexploited: they produce yields lower than their biological and ecological potential thus requiring a strict management planning to restore their full and sustainable productivity, according to the Johannesburg Plan of Implementation, outcome from the World Summit on Sustainable Development (United Nations, 2004), demanding all overexploited stocks to be restored to the level of maximum sustainable yield by
22 2015, an objective questionable to be achieved as planned. In 2009, 12.7% of the stocks were non-fully exploited and are still under relatively low fishing pressure, with potential to increase their production (even though their potential production is very often low) and requiring adequate management plans to make sure that any possible increase in the exploitation rate will not result in overfishing in the future (FAO, 2012).
Figure 1.5 - Global trends in the state of world marine fish stocks (FAO, 2012). On the other hand, 30% of world marine capture fisheries production are accounted by top ten species which stocks are fully exploited and have no potential for increases in the production, whereas some stocks are overexploited but it is possible to increase their production by putting in place effective rebuilding plans. Examples of fully exploited stocks are: the two main stocks of anchoveta in the Southeast Pacific, Alaska Pollock in the North Pacific, blue whiting in the Atlantic, Atlantic herring in both Northeast and Northwest Atlantic and chub mackerel in the Eastern and Northwest Pacific. Examples of overexploited stocks are Japanese anchovy in the Northwest Pacific and Chilean jack mackerel in the Southeast Pacific. In 2009, there were estimations for the overexploitation of the stock of largehead hairtail in the main fishing area in the Northwest Pacific. Still in 2009 one-third of the seven principal tuna species were estimated to be overexploited, 37.5% were already fully exploited and 29% were non-fully exploited. Unless significant improvements in the management of tuna species are implemented, the status
23 of tuna stocks (and catches as a consequence) may further deteriorate in the long term. This is due to the significant tuna demand and the tuna fishing fleets overcapacity (FAO, 2012).
The increased percentage of overexploited fish stocks, the declining of global marine catch and the decreased proportion of non-fully exploited species around the world, in the last few years, are signs that the state of world marine fisheries is worsening and is having a negative impact on fishery production. Overexploitation has a negative impact not only on the ecological aspect but also on the level of fish production since it is reduced leading to further negative social and economic consequences. Effective management plans must be put in place in order to increase the contribution of marine fisheries to the food security, economies and well-being of the coastal communities. For some highly migratory, straddling and other fish resources that are exploited only or partially in the high seas, the situation is more critical. In 2001, the United Nations Fish Stocks Agreement was put in practice and should be used as a legal basis for management measures of the high seas fisheries (FAO, 2012).
However, despite the serious global situation of marine capture fisheries, there has been made good progress in reducing exploitation rates and in restoring overexploited fish stocks and marine ecosystems by the effective management actions in some areas. 67% of stocks the United States of America are being sustainable harvested, with only 17% being overexploited. Also in New Zealand 69% of the stocks are above management targets, thus urging for mandatory rebuilding plans for all fisheries below target thresholds. Australia also reported overfishing for only 12% of the stocks in 2009. The Newfoundland-Labrador Shelf, the Northeast United States Shelf, the Southern Australian Shelf and California Current ecosystems have shown since the 1990s significant decreases in fishing pressure, so they are now at or below the modelled exploitation rate that gives the multispecies maximum sustainable yield of the ecosystem. These successful examples support the effective management of fisheries (FAO, 2012).
Regarding the form in which the catch is utilized in the year 2010, 40.5% of the world’s fish production (60.2 million t) was in live, fresh or chilled forms, 45.9% (68.1 million t) was processed in frozen, cured or otherwise prepared forms for direct human consumption and 13.6% as destined for non-food uses (Fig. 1.6). There has been an increase in the proportion of fisheries production used for direct human consumption instead of other uses, since the early 1990s. On the other hand, in the 1980s around 68% of the fish produced was used for human consumption, having this share increased to more than 86% in 2010 (128.3 million t), and 20.2 million t were
24 used to non-food purposes, from which 75% (15 million t) was destined to fish meal and fish oil and the remaining 5.1 million t used as fish for ornamental purposes, for culture (fingerlings, fry, etc.), for bait, for pharmaceutical uses and also as direct feed in aquaculture, for livestock and for fur animals (FAO, 2012).
Figure 1.6 - Utilization of world fisheries production (FAO, 2012).
Regarding aquaculture, its production has increased by almost 12 times between 1980-2010, with an average annual rate of 8.8%. Aquaculture continues to grow, despite at a slower rate than in the 1980s and 1990s. In 2010, world aquaculture reached a peak of 60 million t with an estimated $ 125 billion in the U. S. (excluding aquatic plants and non-food products). If farmed aquatic plants and non-food products are included in the statistics, then the value of aquaculture production in 2010 reaches 79 million t, worth US $ 125 billion. Nowadays, about 190 countries raise around 600 aquatic species in farming systems of different intensities and technological sophistication, including hatcheries that produce seeds for stocking to the wild, especially in inland waters (FAO, 2012).
Aquaculture production is distributed unevenly throughout the regions and countries of different economic development levels. The top ten producing countries contributed for 87.6% of the quantity and 81.9% of the value of the world´s farmed food fish, in 2010. In this year, Asia alone contributed for 89% of the volume of world aquaculture production, being China the biggest contributor which accounted for more than 60% of world aquaculture production volume. Other
25 Asiatic big producers were: India, Vietnam, Indonesia, Bangladesh, Thailand, Myanmar, Philippines and Japan. The Asian share of freshwater aquaculture has increasing gradually from around 60% in the 1990s until 65.6 % in 2010 (FAO, 2012).
Global aquaculture production is dominated by freshwater fishes 56.4%, 33.7 million t), followed by molluscs (23.6%, 14.2 million t), crustaceans (9.6%, 5.7 million t), diadromous fishes (6.0%, 3.6 million t), marine fishes (3.1%, 1.8 million t) and other aquatic animals (1.4 million t, 814 300 t). Even though feed is generally considered a limiting factor in aquaculture development, one-third of all farmed food fish production (20 million t) is achieved without artificial feeding like bivalves and filter-feeding carps (Fig. 1.7). Nevertheless, the percentage of non-fed species in the global aquatic production has decreased from more than 50% in 1980 to 33.3% nowadays, showing the faster body-growth rates obtained in the cultivation of fed species and the growing demand of the consumer for higher trophic-level species of fishes and crustaceans (FAO, 2012).
Figure 1.7 - World aquaculture production of non-fed and fed species (FAO, 2012). Aquaculture has been the engine driving growth in total fish production, while global capture production has been stable, increasing its contribution to world total fish production from 20.9% in 1995 to 32.4% in 2005 and 40.3% in 2010. On the other hand, regarding world food fish production, aquaculture has increased its contribution from 9% in 1980 to 47% in 2010. Regarding freshwater production, it increased from less than 50% before 1990 to almost 62% in
26 2010, while the share of marine aquaculture production decreased from more than 40% to just above 30% (FAO, 2012).
1.2 Marine industry in Portugal
1.2.1 Fisheries
In Portugal, fisheries employed in 2011 approximately 0.3% (13,156 out of 4,361,187) of the working population with 16,797 registered fishermen in 2013 (INE, 2014).
The total amount of fish landed by the Portuguese fleet was 193,211 t in 2013, where 162,258 t was fresh fish and 30,953 t frozen fish (16% of total landed fish). Most of this fish was for human consumption and the major part of landed fresh fish was whole fish (95.5 %), but in the case of frozen fish only 22.3 % was whole fish (INE, 2014).
In the Portuguese auctions, the total amount of fresh or refrigerated fish sold was 144,654 t and its value was about 253 million Euros in 2013. The distribution was the following: 123,907 t (marine and freshwater fish), 1,097 t (crustaceans) and 19,646 t (bivalves and cephalopods). The main species of fresh fish sold in auction (Table 1.2) were Atlantic chub mackerel (Scomber colias), sardine (Sardina pilchardus), horse mackerel (Trachurus trachurus), tuna (Thunnus spp.) and similar, black scabbard fish (Aphanopus carbo), blue jack mackerel (Trachurus picturatus), hake (Merluccius merluccius), blue whiting (Micromesistius poutassou) and octopus (Octopus sp.) (INE, 2014).
27 Table 1.2 – Main landings in the Portuguese auctions in 2013 (INE, 2014).
Landingsin auctions (fresh fish) in 2013
Species Amount (tons)
Atlantic chub mackerel
(Scomber colias) 37,309 Sardine (Sardina pilchardus) 27,669 Horse mackerel (Trachurus trachurus) 15,337 Tuna
(Thunnus spp.) and similar 11,502
Black scabbard fish
(Aphanopus carbo) 4,093
Blue jack mackerel
(Trachurus picturatus) 3,497 Hake (Merluccius merluccius) 2,745 Blue whiting (Micromesistius poutassou) 1,996 Octopus (Octopus sp.) 12,934 1.2.2 Aquaculture
The total sales of aquaculture products in 2011 were around 53 million Euros. In Portugal there are 1,492 aquaculture registered companies, from which 1472 are of salt and brackish water and only 20 of fresh water. The total area of aquaculture land is of 1,583 ha (INE, 2014).
The best year for production was 2012 with a total of 10,500 t, from which 4,300 were turbot (Aquaculture Portugal, 2014). In 2013 there was a general decrease in the aquatic production due to the decrease of turbot production on one of the major Portuguese aquacultures of the sector. This particular aquaculture influences all Portuguese aquaculture statistics since it produces
28 significant quantities of turbot. In 2014, after this incident, aquaculture is expected to increase again (Pedro, 2015 oral communication). The exception to this tendency was blue mussel (Mytilus spp.) which increased, particularly in the Algarve region, to approximated values of 1,500 tons in 2013. The quantities of other species produced during 2013 were: grooved carpet shell (Ruditapes spp.) 2,500-3,000 t; oyster (Crassostrea sp.) 700-800 t; trout (Oncorhynchus mykiss) 1,000 t; sea bream (Sparus aurata) 400-500 t (in Madeira Island), flounder (Platichthys spp.) 35 t (Aquaculture Portugal, 2014).
1.2.3 Fish processing industry
The latest published data shows that in Portugal the fish processing industry was composed of 180 companies, from which 163 were in continental Portugal in 2012. The total number of employed people in this type of industry was 6823 in 2012. Regarding production, in 2012, there was a total of 105,892 t of frozen products composed by: 14,823 t of aquatic invertebrates (squids, octopus, cuttlefish, molluscs and others); 7,477 t of hake; 3,731 t of fillets; 7, 669 t of sardine; 27, 161 t of codfish and 4,029 t of redfish. Dried and salted products account for 61,411 t with salted codfish contributing with 50,049 t. The contribution of the canning industry was 44,700 t in total distributed by: sardine canning in olive oil 4,549 t; sardine canning in other vegetable oils 5,458 t; sardine canning in tomato sauce 2,802 t; tuna canning in olive oil 3,003 t; tuna canning in other vegetable oils 10,467 t; mackerel, horse mackerel and others in olive oil 1,814 t; mackerel, horse mackerel and others in other vegetable oils 763 t (INE, 2014).
In terms of value, in 2012, the industry of frozen fish sold 329,949,000 Euros corresponding to 85,602 t; the industry of dried and salted fish contributed with 258,951 Euros (47,406 t) and the canning industry with 194,725 Euros (42,808 t).
1.3 Definitions
In order to clarify terms and expressions commonly used within this area, some of the most frequently used were chosen and the most adequate definitions found are as follows:
Waste is any substance or object which the holder discards or intends or is required to discard
29
Bio-waste means biodegradable garden and park waste, food and kitchen waste from
households, restaurants, caterers and retail premises and comparable waste from food processing plants (EC, 1998).
Discards or discarded catch is that portion of the total organic material of animal origin in the
catch, which is thrown away or dumped at sea for whatever reason. It does not include plant materials and post-harvest waste such as offal. The discards may be dead or alive (Kelleher, 2005, adapted from FAO, 1996).
By-catch is the total catch of non-target animals during fisheries. Discards are not a subset of
by-catch since the target species are often discarded (Kelleher, 2005).
Rejections in the auction are seafood that didn´t pass the veterinary sanitary inspection in the
auction (this data is sent to the Portuguese National Institute of Statistics (INE) by the General Directorate of Veterinary - DGAV) or that was impossible to commercialize (this data is sent to INE by the General Directorate of Natural Resources, Security and Maritime Services - DGRM - part of the Ministry of Agriculture, Sea, Environment and Territory Management) (INE, 2014).
Withdrawals from the auction
Seafood that did not reach the minimum selling price or that was not sold by any other reason (no buyer interested, for example).
Disposal means any operation which is not recovery even where the operation has, as a
secondary consequence, the reclamation of substances or energy (EC, 1998).
Animal by-products are entire bodies or parts of animals, products of animal origin or other
products obtained from animals, which are not intended for human consumption, including oocytes, embryos and semen (EU, 2009). Animal by-products including processed products that are destined for incineration, land filling or use in a biogas or composting plant are still under the scope of EC (1998).
Derived products are products obtained from one or more treatments, transformations or steps
of processing of animal by-products (EU, 2009).
Another definition of by-products found in this study is fish waste: discarded during processing for human consumption; also called fish scrap, fish offal, filleted offal, gurry (USA), trash fish or industrial fish (OECD, 2002).
For the purpose of data collection for this work, marine animal by-products produced or processed in Portugal were searched under both regulations - waste and animal by-product –
30 since their final destinations (disposal or valorisation) determine the institutions where data is collected and available.
There is an interesting proposal, recommending that by-products that are used in food should be called co-products, in order to avoid the eventually bad image of by-products in consumers’ minds (Olsen, 2013). With the same concern, another term - rest raw materials - has been recently introduced for by-products (Rustad et al., 2011).
By-products and derived products searched in this study are of category 2 (fish caused by mortality in aquaculture) and 3 (aquatic animals without signs of communicable disease to humans or animals, aquatic animal by-products originating from plants manufacturing products for human consumption, shells from shellfish with soft tissue or flesh (…) originating from animals which did not show any signs of communicable disease through that material to humans or animals) (EU, 2009).
Fish by-products can be divided in two large groups regarding spoilage and degradation levels: a) easily degradable by-products with high concentration of different endogenous enzymes (by-products containing viscera or blood) and b) relatively stable by-(by-products (heads, skin and bones) (Rustad et al., 2011).
Regarding “Fishery Products” several definitions appear in the literature as exemplified afterwards. In this work the definition of Gousset et al. (2001) will be considered, which includes the major part of aquatic animals. However, to perform this study the legal frame has to be considered (namely EU, 2004) that includes a different definition, excluding bivalve molluscs, live echinoderms, live tunicates, live marine gastropods, mammals, reptiles and frogs.
Fishery products all the animals or part of the animals, marine or from freshwater, from
fisheries or aquaculture, destined to human consumption. This very broad definition includes fishes, crustaceans, marine molluscs (cephalopods, bivalves, marine gastropods) and tunicates present in the living state, fresh, refrigerated, frozen, whole, prepared or transformed (Gousset et al., 2001).
Another definition of fishery products is all seawater or freshwater animals (except for live bivalve molluscs, live echinoderms, live tunicates and live marine gastropods, and all mammals, reptiles and frogs) whether wild or farmed and including all edible forms, parts and products of such animals (EU, 2004).
31 This definition is complemented with the next one – products of animal origin. The reason for this categorization is the different sanitary demands of each category: in the first case – fishery products – the animals are sold dead to the consumer and in the second – products of animal origin – they are intended to be supplied alive to the consumer, thus increasing their sanitary standards.
Products of animal origin “– food of animal origin, including honey and blood;– live bivalve
molluscs, live echinoderms, live tunicates and live marine gastropods intended for human consumption; and – other animals destined to be prepared with a view to being supplied live to the final consumer” (EU, 2004).
Seafood includes finfish, shellfish and molluscs. The term shellfish covers the bivalve molluscs
(oysters, cockles, clams and mussels), the gastropods (periwinkles, sea-snails) and the crustaceans (crab, lobster, shrimp) (Huss, 1994).
For the purpose of this study seaweeds were included in the category of seafood thus distinguishing it from fishery products.
The definition of Fishery products by Gousset et al. (2001) seems more complete and intuitive regarding its meaning.
1.4 Characteristics of marine by-products
Different fish species have specific processing yields and, consequently, generate different proportions of by-products, as shown in table 1.3.
Marine by-products are remarkable source of proteins, lipids, enzymes, pigments, minerals, vitamins and others, as summarized in table 1.4.
The fraction of by-products that is protein-rich are the cut-offs, backbones, heads, skin, roe, milt, stomachs, viscera and blood. Information on the available quantities, chemical composition and properties of both protein and lipid fraction, depending on the species, season and fishing ground, is very important for the industry in order to optimise the use of by-products. By-product protein content varies according to the by-product fraction (table 1.5). Protein content is generally expressed as crude protein, Nx6.25, which includes also the NPN (non-protein-nitrogen). The meat of white fish has an NPN value between 9 and 15% of the total N. NPN is composed in about 95% of free amino acids, dipeptides, trimethylamine oxide (TMAO) and
32 degradation products like urea, guanidine, nucleotides and their degradation products (Rustad, 2007).
Table 1.3– Amount of different by-products fractions (Rustad, 2007).
Species By-product fraction amount of total fish weight (%)
Head Backbone/frames Cut-offs Skin Roe Milt Viscera
Cod 20.2 9.7 8.2 4.2 0.7 1.3 5.6 Saithe 15.3 9.9 8.8 4.8 0.3 0.2 7.2 Haddock 18.9 10.6 9.3 4.5 0.7 0.1 6.2 Tusk 17.9 8.4 21.2 6.4 2.0 0.0 9.9 Ling 18.6 - - - 1.7 - 3.3 Atlantic Salmon 10.0 10.0 - 5.0 - - 14.0 Carp, wild 21-25 - 5-9 6-8 - - 3-4 Carp, cultured 20-21 - 6-8 8-11 - - 4-5
Fish roe is a protein rich fraction of by-products (16-30%). On the other hand, backbone is responsible for around one-third of the dry weight and is composed mainly of minerals (60-70%) and proteins (30%) (Rustad, 2007).
Table 1.4– Constituents of by-products (Shahidi, 2007).
The
proteins of marine by-products are of high quality due to their high digestibility and amino acid composition. Their recovery from the by-products can be done in different ways utilizing
33 mechanical separation from frames, alkaline or acid extraction or hydrolysis. When proteins are hydrolysed by fish endogenous enzymes, before or during the primary processing, quality deterioration may occur; on the other hand, under controlled conditions, this same hydrolysis may produce fish sauces or fish silage.
Table 1.5– Protein content in different by-product fractions (Rustad, 2007).
Species Protein content % of wet weight
Head Backbone/frames Cut-offs Skin Milt Viscera Cod - - 13-23 - - 9-13 Saithe - - 15-19 - - 12-19 Haddock - - 15-18 - - 7-11 Tusk - - 17-23 - - 3-12 Ling - - 13-23 - - 8-12 Carp, wild - - 14-22 - 14-27 15-23 Carp, cultured - - 12-17 - 19-25 26 Atlantic Salmon 11-13 10-15 - 8-12 1 - 5-7 Herring 13.1 - - - 18.0 - 1- Includes bellyflap
Furthermore, commercially available proteases can be added to fish by-products to produce protein hydrolysates with several applications namely situations where water solubility, water and lipid holding capacity and rheological properties are important (Shahidi, 2007). Protein hydrolysates can stimulate the immunologic activity, have anti-oxidant capacity and inhibit the activity of the angiotensine converting enzyme (ACE) (Je et al. 2004). Despite these important functional properties, fish proteins are not optimally utilized in the growing protein ingredient and health markets due to the challenges in the purification process that generate a loss of protein functionality (Rustad, 2007).
The quantity and chemical composition of different by-product fractions have seasonal variations. Falch et al (2007) found a higher proportion of viscera during the seasons of autumn
34 and spring. Other examples are the highest proportion of gonads of Gadidae species that spawn during the months of January to June in the Northern Hemisphere. On the other hand, roe proportions are higher in autumn and spring, reaching 2.2% of the round weight of fish on average during the spawning season (Rustad, 2007).
Rustad (2007) points out to the importance of treating the by-products in the same way as the main products (fillets, for example) in order to obtain the maximum quality. This author stresses the importance of not freezing the raw material since this process leads to the loss of both water-holding capacity and gel forming ability, especially in the case of mince. Also the time of freezing and the thawing conditions can reduce the functional properties of the by-products. Other important points in the maintenance of by-products quality are the handling on-board and sorting, especially regarding the reduction of enzymatic rate of degradation and microbial spoilage (Rustad, 2007).
In the case of fish protein hydrolysates (FPH), minced and surimi-based products preparation or extraction of lipids, enzymes and/or other bioactive compounds is very important to control the endogenous enzymes in the raw material and also to know how these activities are influenced by temperature (Rustad, 2007).
Another component of interest of marine by-products is the lipid fraction. Recent studies on the beneficial health impact of long chain polyunsaturated omega-3 fatty acids, specifically eicosapentaenoic acid (EPA) and docosahexaenoic acid (DHA), have increased the interest in seafood consumption thus stressing the importance in fish lipids especially those from the under-utilized by-product landing. The group of lipids includes fatty acids, fats, oils, waxes, phospholipids, glycolipids, steroids and a few vitamins. Fatty acids are the monobasic aliphatic carboxylic acid and can be divided in three categories: saturated, unsaturated (monounsaturated – MUFA and polyunsaturated – PUFA). Polyunsaturated fatty acids, that include: linoleic acid (also known as α-linoleic acid), the essential omega-6 fatty acid, from which it is possible to synthesise other omega-6 like fatty acids arachidonic acid; linolenic acid, the corresponding essential omega-3 fatty acid that gives origin to other omega-3 fatty acids like EPA and DHA (Kerry, 2007).
35 The concentration of fatty acids in fish tissue varies with diet, size, species, age, reproductive condition, geographical location and season (Ackman, 1989). Lipids are prone to oxidation and this process interferes with the nutritional quality, wholesomeness, safety, colour, flavour and texture of fish. This oxidation occurs particularly after death, when the antioxidants ingested by the fish are no longer present, and is mostly due to enzymatic hydrolysis. Oily fish are more prone to lipid oxidation and spoilage because of their high concentration of PUFA in the lipids. Lipid oxidation (rancidity) is also dependent on the levels of endogenous antioxidants, endogenous oxidative catalysts and external facts like heat, light, processing procedures, preservation and handling. For example, freezing practices when applied properly can reduce rancidity during storage because of a reduction on the ice crystal damage on the lipids membrane (where lipid oxidation occurs in the first place). If the freezing process is rapid, the formation and distribution of small ice crystals can reduce this initial damage related to freezing. Regarding frozen fish, vacuum packing and modified atmosphere packing (MAP) are processes to extend its shelf-life by reducing or eliminating the access to oxygen.
In order to diminish off-flavour production due to the formation of volatile compounds it is necessary to stop or slow down the oxidation process. The most common methods are the direct application of antioxidants (Kerry, 2007). The main limitation for shelf-life of marine oil is lipid oxidation, therefore this has to be considered in the production of marine lipids (Falch et al, 2007).
Kerry (2007) stresses the importance of research on the extracting methods of lipids from by-products in order to use them as potential functional ingredients. There is a growing interest not only on the extraction processes but also at the level of concentration and stability of fish oil. Besides reactions catalyzed by enzymes, microbial activity is another factor inducing fish spoilage since it is a good substrate for microbial growth. While fish muscle is sterile, intestines and gills have large amounts of bacteria, therefore it is necessary to separate these fractions from those less contaminated. Another source of pathogens present in raw material and processed products is their contact with fish handlers equipments or other environmental conditions. Bacterial activity can produce enzymatic degradation (for example of lipases, proteases, peptidases and reductases) thus causing the spoilage of by-products. Therefore, it is very important to produce by-products hygienically right after the careful handling of the fish.
36 However, the limited space on-board can be a limiting factor regarding the handling and further utilization of by-products.
1.5 Sources of marine by-products
1.5.1 On-board: discards, by-catch and on-board fish processing industry
The current on-board discards are constituted by low commercial value fish species, non-targeted species (by-catch) or undersized targeted species. The percentage of discards varies within the fishing methods (trawlers, long-liners etc.) since it depends on the selectivity of the fishing gears employed (Alonso et al., 2010).
Previously FAO (Alverson et al., 1994) estimated discards as being of around 27 million t per year (near one third of the total fish captures), however, Kelleher (2005) estimated the amount of discards in 7.3 million t per year during the period from 1992 to 2001 (around 8% of the total fish catch).
Discards are a purposeless waste of valuable living resources, responsible for the depletion of fish populations (Alonso et al., 2010). Fish trawler fleet is very important in catching and dispersing biomass since a significant portion of trawl catches is composed by non-target species, thus being returned to the sea. This input of discarded species to the foodweb is an important result of fishing practices (Bozzano and Sardà, 2002).
In fish trawlers fleet, great part of the fish (about half the non-commercial crustaceans and 98% of non-comercial cephalopods) is dead when discarded (Hill and Wassenberg, 1990). This low survival rate of discarded non-commercial invertebrates was also confirmed by Bergman and van Santbrink (2000).
Bozzano and Sardà (2002) consider the large quantities of dead fish, crustaceans and molluscs discarded in fishing areas to have potential repercussions on the surface, midwater and benthic communities of the affected areas.
The mass of discards that reach the bottom is regulated by the scavenging activity of seabirds (Camphuysen et al., 1995; Oro and Ruiz, 1997). In the water column some authors (Hill and Wassenberg, 1990) report significant rates of bait loss, while other authors (Castro et al., 1999)
37 consider this activity reduced off the coast of southern Portugal. Thus, the demersal community of the continental shelf, varying with the study area, receives a regular supply of organic matter in the form of fishery discards with its ecological impact for the benthic species and their energy supply to the community (Bozzano and Sardà, 2002).
Discards can change trophic links within communities due to the strong non-selective predation and the input of significant quantities of energy (Bozzano and Sardà, 2002). These energy inputs cause a greater abundance of consumers when compared to their feed only by in situ resources (Polis and Strong, 1996). Another aspect of continuous discards in the same area (North Sea) may emphasize secondary production because of the feeding activity of scavenger communities, thus allowing faster transfer of organic matter into the food web (Groenewold and Fonds, 2000). Discard amounts and composition vary greatly with the target species, the fishing season (Bozzano and Sardà, 2002) and the fishing area. For instance, in shallower fishing areas of the Catalan Sea discards can reach 50% of the total catch whereas in deeper water it may reach only 20% of the total catch (Carbonell et al., 1997).
Discards are done during fishing vessel movement thus being spread over large areas and becoming available to large numbers of scavengers. Little information is available, worldwide, on the possible effects of discards on the life cycles of many marine species (Bozzano ans Sardà, 2002). Nevertheless, various studies have shown the importance of benthic scavengers in consuming fishery discards and dispersing surface-derived organic carbon (Hill and Wassenberg, 1990; Ramsay et al., 1997; Bergman and van Santbrink, 2000; Fonds and Groenewold, 2000; Legezynska et al., 2000).
On the other hand, discarding juvenile fish, fish of little or no economic interest or fish that is over-quota is known to compromise future yields; while discarding mature fish is a waste of resources in short term and a reduction of the amount of adult fish that would otherwise support productivity (Jensen et al., 1988).
Generally, to reduce the level of discards aimed by national and European administrations, reflected in the reform of Common Fisheries Policy (CFP) a change is needed in the perception/attitude of the actors participating in the extractive sector towards the concept of keeping in the holds the whole catch (target species, by-catch and other marine organisms that
38 cannot be returned alive to the sea). The reform of CFP allows fishermen to actively participate in the process of designing measures to avoid by-catch in the first place and to land all commercial species that are caught. However difficulties are expected in the implementation of this objective (Pazo et al., 2014).
Discards are a key point of the Ecosystem Approach to Fisheries Management (EAFM), and a complex issue. Discarding practices relate to the core of fishing operations, from an economic, legal and biological view point. Nevertheless, besides all these challenges, there is a common agreement (among citizens, NGOs, the fishing sector, policymakers, scientists, etc.) that understands discards as being very negative endeavours for the implementation of effective solutions for this problem (Pazo et al., 2014).
FAO (2010) has recently developed, in a report, a technical consultation to set international guidelines on by-catch management and discard reduction (Pazo et al., 2014). These guidelines are intended to support states and Regional Fisheries Management Organizations or Arrangements (RFMO/As) in managing by-catch and reducing discards in conformity with FAO Code of Conduct for Responsible Fisheries (FAO, 1995). The scope of the guidelines, in this report, is global, covering all fishing activities in all seas, oceans and inland waters. Further, in the same report (FAO, 2010) and regarding the By-catch Management Planning (BMP), it is mentioned that states and RFMO/As should make sure BMP take in consideration both best practices and a reduction in discards developed in cooperation with relevant stakeholders (Pazo et al., 2014). Best practices include the development of measures to meet these objectives, adapted to the characteristics of each fishery in which by-catch and discard problems need to be addressed (Pazo et al., 2014).
Pazo et al. (2014) summarise the main FAO (2010) guidelines on by-catch management and reduction of discards:
- To minimise potential by-catch through spatial and/or temporal measures; - To minimise by-catch through modifications of fishing gears and practices;
- To maximise the release of alive by-catch while ensuring the safety of the fishing crew; - To make the best use of unavoidable by-catch according to FAO code (1995)
39 Besides discards, another source of marine by-products (biomass loss) is on-board fish processing industries. Especially fish evisceration and cleaning generates a considerable amount of waste like heads, bones, guts, skins etc. Normally, demersal species (e.g. monkfish, cod, conger, haddock, ling, etc) and some cartilaginous species like sharks are gutted on board, producing variable amounts of fish waste (mainly viscera) that are dumped at the sea (Alonso et al., 2010).
Besides the adverse effect on the trophic chain, on-board evisceration contributes to the accumulation of pollutants as PCBs, dioxins and heavy metals and the dispersion of parasites existent in the viscera (like Anisakis) in the fishing areas (Blanco et al., 2007). The percentage of marine by-products generated on-board varies according to the target species (for example, most fatty fish is processed on-board but most lean fish species are landed as whole fish), and according to the fishing areas (fishing fleets working in coastal waters tend to land the whole volume of captured fish to be processed in-land). However, estimations of average waste amounts vary between 15 and 30% of the total catch, but in some cases (skate fish) could reach 80% (Alonso et al., 2010).
In this regard, and to promote the responsible and sustainable management of the European fishing activity, the European Commission took several actions for the implementation of “no-discard” and “zero-waste” policies to be followed by the European fishing fleets in the near future. Some of these policies are: “to reduce unwanted by-catches and eliminate discards in European fisheries” (EC, 2007). As a result, non-target species or fish above quota (or below minimum market size) will no longer be discarded, but kept on board to be brought ashore (Alonso et al., 2010). These policies and their implementation were discussed with the Member States in 2007 and were approved by the EU parliament in 2008 (Alonso et al., 2010). Later, the European Commission (EU, 2013) established as objectives for the CFP, to: “gradually eliminate discards, on a case-by-case basis, taking into account the best available scientific advice, by avoiding and reducing, as far as possible, unwanted catches and by gradually ensuring that catches are landed”; “where necessary, make the best use of unwanted catches, without creating a market for such of those catches that are below the minimum conservation reference size”; “provide conditions for economically viable and competitive fishing capture and processing
40 industry and land-based fishing related activity”. It was also agreed that Member States should produce a “discard atlas” with the level of discards in each fishery (EU, 2013).
In the European Atlantic area, the amount of marine by-products generated in fishing vessels is difficult to estimate due to the lack of records of the amount of discarded species. While on board it is difficult to estimate the quantities of by-products since it depends on the different processes and on the species (Sotelo et al., 2011).
Generally, the catch is landed by the coast fleet having had refrigeration on-board or not and the fish can be gutted or round, according to the species, statutory regulations, temperature, season and if the by-products are utilized or not. Recently the landing of round fish, fresh and frozen, became a source of interest concerning the possibility of on-shore processing.This being the case, the raw material of several vessels could be processed in the same facilities, optimizing the process in economic terms. In the case of ocean trawlers, normally, the catch is frozen either round or gutted, but some of the vessels process the catch for fish filleting mainly. Fig. 1.8 shows the generation of by-products produced during filleting operation and presents a preservation technology (Falch et al, 2007).
Figure 1.8 - By-products generated during filleting of gadiform species with suggested methods of preservation and bulk production (Falch et al, 2007).
1.5.2 In-land
41 Together with by-catch and aquaculture mortality, fishing ports and auctions contribute to the generation of by-products in the form of whole aquatic animals as opposed to the fish processing industry that contributes with parts of animals.
At the fishing ports and auctions in the Atlantic area, usually the marine by-products are stored in containers and further collected by transporters (or directly by the fish meal producers) to the fish meal factories (Sotelo et al., 2011).
1.5.2.2 Fish processing industry: Fresh and frozen, cod salting and drying, canning
There has been a rapid progress in the technological development of food processing and packaging with processors of traditional products losing market share due to the long-term shifts in consumer preferences, processing and general fisheries industries. The processing industry became more intensive, concentrated in geographic areas, vertically integrated and connected with global supply chains. This is a reflection of the increasing globalization of the fisheries value chain, where the large retailers control the growth of international distribution channels. Another growing tendency is the outsourcing processing on a regional and world scale although outsourcing of production to developing countries maybe not be increasing significantly because of the restrictions on the sanitary and hygiene requirements that are a challenge to meet in developing countries as well as the recent growing labour costs. Another tendency is for processors to become more integrated with producers, particularly for groundfish, the Asian being an example, in which major processors have their own fleet of fishing vessels. Also large producers of farmed salmon, catfish and shrimp have their own advanced centralized processing plants. On the other hand, processors without purchasing or sourcing power of strong brands have difficulties due to the scarcity of domestic raw material, being forced to import fish to continue their business (FAO, 2012).
In 2010, 46.9% of the fish destined for human consumption was in live, fresh or chilled form, 29.3% frozen, 14.0% prepared or preserved and 9.8% cured. 55.2% of the total processed fish for human consumption was frozen accounting for 25.3% of the total fish production. Frozen proportion fish grew from 33.2% of the total production for human consumption in 1970 to a record of 52.1% in 2010. On the other hand, the share of prepared and preserved forms was