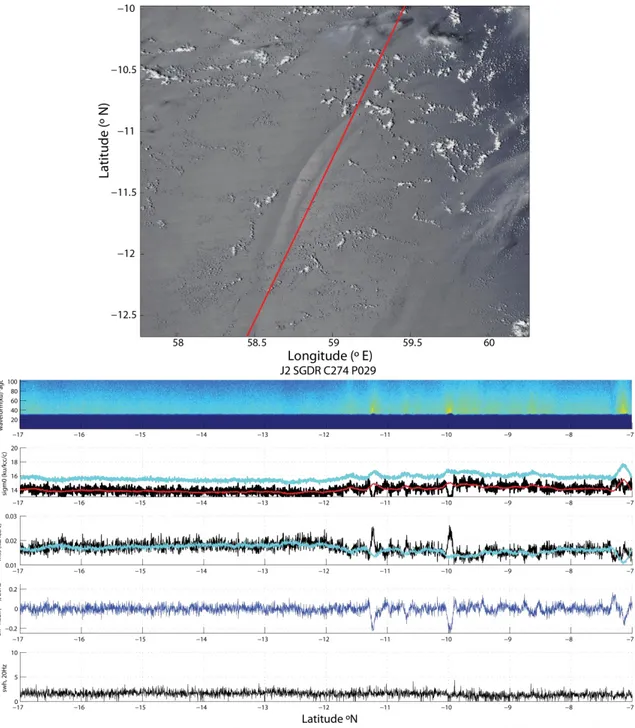
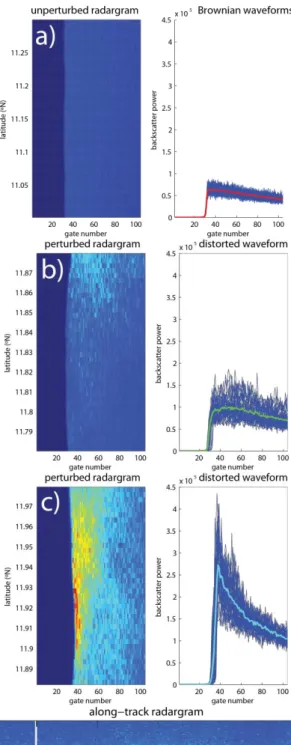
A note on radar altimeter signatures of Internal Solitary Waves in the ocean
Texto
Imagem


Documentos relacionados
In this study, we investigated the feasibility of using the C-band European Remote Sensing Satellite (ERS-1) synthetic aperture radar (SAR) data to estimate surface soil roughness in
Abstract — In this letter, a new transition between microstrip line and substrate integrated waveguide in Ku-band frequency is proposed.. This transition composed of one
Methods: Eight knees from cadavers were dissected in order to make measurements from the center of the anterolateral band to the roof (AL1), from the center of the anterolateral band
Percebe-se que os professores pesquisados não são resistentes às mudanças. Todavia, é necessário que as ins- tituições de ensino proporcionem estrutura física adequada
In conclusion, the daily evaluation of changes in simple parameters such as consistent increases in serum phosphate levels, unmeasured anions, and KU, with decreases in NaU and ClU
As the X-SAR scans from left to right, the Normalized Radar Cross Section (NRCS) first increases above the back- ground value due to scattering by the frozen hydrometeors in the
L-band SAR showed less contrast be- tween floating and grounded lake ice than C-band; however, since L-band is sensitive to ebullition bubbles trapped by lake ice (bubbles
Classifica- tion results for C-band simulated radar data using previous S-band MBFs are reported in Table 1, while the contingency table for C-band data, when new MBFs C-band