440
May 2017, Vol. 107, No. 5
The major burden of both chronic obstructive pulmonary disease (COPD) and pulmonary tuberculosis (PTB) occurs in low- and middle-income countries. Ninety percent of the estimated 3 million annual deaths from COPD, and a large majority of the 9 million cases of active PTB, occur in these countries.[1] In these populations, factors
other than cigarette smoking (e.g. biomass fuel and occupational exposures) contribute to the pathogenesis of COPD.[2] In a number
of large population-based cross-sectional studies, PTB has also been shown to be strongly associated with the presence of chronic airflow limitation (CAL).[3-6] In some studies, this association is almost as
strong as that for cigarette smoking.[5-7] In a community-based study
performed in South Africa (SA), 49.2% of adults aged ≥40 years who reported a history of PTB had evidence of CAL (Global Initiative for Chronic Obstructive Lung Disease (GOLD) stage 1 or higher).[8]
The mechanisms responsible for CAL following PTB are unclear. Resolution of PTB is characterised by exuberant fibrosis, resulting in bronchiectasis, fibrocystic areas and shrinkage of affected lobes. It has been assumed that CAL in healed PTB is caused by a combination
of bronchiectasis, large-airway (bronchial) stenosis and distortion of large airways,[9-12] but detailed study of the pathophysiology is
lacking. We have examined the pathophysiology of CAL in patients with previous PTB identified in an SA community-based prevalence study and describe a pattern of pathophysiology that may differ from that in patients with COPD not associated with previous PTB. These findings warrant further study in order to establish whether PTB-associated CAL should be regarded as a phenotype of COPD.
Methods
In a community-based cross-sectional study performed in 2005, we randomly sampled 15% of all non-institutionalised adults aged >40 years from two low-income suburbs of Cape Town, SA. The subjects were all coloured (i.e. of mixed ancestry)[13] and were
assessed for CAL using the Burden of Obstructive Lung Disease (BOLD) methodology.[14] One hundred and ninety-six subjects were
identified as having post-bronchodilator airflow obstruction on handheld spirometry (forced expiratory volume in 1 second (FEV1)/
Obstructive pulmonary disease in patients with previous
tuberculosis: Pathophysiology of a community-based cohort
B W Allwood,1,2 PhD; R Gillespie,1 MSc (Nursing); M Galperin-Aizenberg,3 PhD; M Bateman,1 MD; H Olckers,1 BTech Hons;L Taborda-Barata,4 PhD; G L Calligaro,1 MD; Q Said-Hartley,5 MD; R van Zyl-Smit,1 PhD; C B Cooper,6 PhD; E van Rikxoort,7 PhD; J Goldin,6 PhD; N Beyers,8 PhD; E D Bateman,1 PhD
1 University of Cape Town Lung Institute, Cape Town, South Africa
2 Division of Pulmonology, Department of Medicine, Faculty of Medicine and Health Sciences,Stellenbosch University, Cape Town, South Africa 3 Department of Radiology, Hospital of the University of Pennsylvania, Philadelphia, USA
4 CICS – Health Sciences Research Centre, University of Beira Interior, Covilhã, Portugal 5 Department of Radiology, Faculty of Health Sciences, University of Cape Town, South Africa 6 David Geffen School of Medicine, University of California, Los Angeles, USA
7 Radboud University Medical Center, Nijmegen, Netherlands
8 Desmond Tutu TB Centre, Department of Paediatrics and Child Health, Faculty of Medicine and Health Sciences, Stellenbosch University, Cape Town, South Africa
Corresponding author: B W Allwood ([email protected]
)
Background. An association between chronic airflow limitation (CAL) and a history of pulmonary tuberculosis (PTB) has been confirmed
in epidemiological studies, but the mechanisms responsible for this association are unclear. It is debated whether CAL in this context should be viewed as chronic obstructive pulmonary disease (COPD) or a separate phenotype.
Objective. To compare lung physiology and high-resolution computed tomography (HRCT) findings in subjects with CAL and evidence of
previous (healed) PTB with those in subjects with smoking-related COPD without evidence of previous PTB.
Methods. Subjects with CAL identified during a Burden of Obstructive Lung Disease (BOLD) study performed in South Africa were studied.
Investigations included questionnaires, lung physiology (spirometry, body plethysmography and diffusing capacity) and quantitative HRCT scans to assess bronchial anatomy and the presence of emphysema (<–950 HU), gas trapping (<–860 HU) and fibrosis (>–200 HU). Findings in subjects with a past history and/or HRCT evidence of PTB were compared with those in subjects without these features.
Results. One hundred and seven of 196 eligible subjects (54.6%) were enrolled, 104 performed physiology tests and 94 had an HRCT
scan. Based on history and HRCT findings, subjects were categorised as no previous PTB (NPTB, n=31), probable previous PTB (n=33) or definite previous PTB (DPTB, n=39). Subjects with DPTB had a lower diffusing capacity (Δ=–17.7%; p=0.001) and inspiratory capacity (Δ=–21.5%; p=0.001) than NPTB subjects, and higher gas-trapping and fibrosis but not emphysema scores (Δ=+6.2% (p=0.021), +0.36% (p=0.017) and +3.5% (p=0.098), respectively).
Conclusions. The mechanisms of CAL associated with previous PTB appear to differ from those in the more common smoking-related
COPD and warrant further study.
441
May 2017, Vol. 107, No. 5
RESEARCH
forced vital capacity (FVC) ratio <0.7), and form the study popu lation for the current study. The vital status of all subjects was established, and those still alive were invited to participate. Exclusion criteria were active tuberculosis (TB), advanced or untreated malignancy, dementia, substance abuse, or any other condition that in the opinion of the investigators would place the subject at undue risk.
Between March 2010 and February 2011, eligible subjects under-went clinical evaluation and completed the BOLD questionnaires and a questionnaire with more detailed questions about previous PTB. At a second visit, subjects completed the St George’s Respiratory Questionnaire (SGRQ), the Medical Research Council (MRC) dyspnoea score was calculated, and spirometry after respiratory medication withhold was performed using an nSpire spirometer (Ferraris, USA) before and after administration of both ipratropium bromide (80 μg) and salbutamol (400 μg) via a pressurised metered-dose inhaler. Diffusing capacity for carbon monoxide (DLCO) was
measured by the single-breath method using a VMAX 2130system (Sensormedics, USA). Two weeks later, spirometry before and after bronchodilator and whole-body plethysmography were performed according to American Thoracic Society/European Respiratory Society recommendations[15] by qualified respiratory technologists
blinded to patient clinical information, and a non-contrast high-resolution chest computed tomography scan (HRCT) was performed by a single experienced radiographer. Images were obtained at total lung capacity (TLC) and residual volume (RV). Quantitative analysis of scans using customised software (MedQIA, USA) was performed by investigators blinded to clinical information. Percentages of low-attenuation areas (LAAs) <–950 HU and high-attenuation areas (HAAs) >200 HU were used to determine the emphysema and fibrosis scores, respectively. On the RV scan, the percentage of LAAs <–860 HU was used to determine the gas trapping score. The corrected gas trapping score (CGTS) was calculated by subtracting the emphysema score (at TLC) from the gas trapping score (at RV).
Using Cirrus Lung 13.05 software (Diagnostic Image Analysis Group, Netherlands), the average wall thickness and percentage wall area of the 4th- and 5th-generation bronchi were measured, and the aggregated airway diameter for individual patients was expressed as the standardised thickness of an airway of inner perimeter 10 mm (Pi10).
Subjects with a history of treated PTB were designated as definite previous TB (DPTB). HRCT scans were viewed by two experienced radiologists for lesions suggesting previous PTB. Subjects without a history of PTB but with positive scans were designated as probable previous TB (PPTB). Subjects with neither a history of PTB nor HRCT scan evidence of PTB were designated as no previous TB (NPTB).
Ethics approval
Ethics approval for the study was obtained from the Human Research Ethics Committee of the University of Cape Town (ref. no 441/2009), Stellenbosch University (ref. no. N/09/11/328) and local health authorities (ref. no. 10165), and all the subjects provided written informed consent.
Statistical analysis
Statistical analysis of the between-group comparisons of lung physiology and imaging was performed using STATA version 12.1 (StataCorp, USA). Parametric and non-parametric tests were used in univariate analyses. Multivariate analysis involved linear regression with covariates stated in the relevant tables below. Missing data points were not imputed and were not included in the analysis. A significance level of p<0.05 was chosen, and all statistical tests were two-sided.
Results
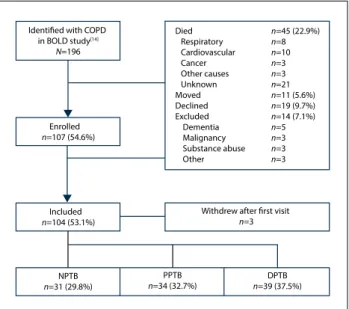
Of the 196 subjects identified with CAL in 2005, 45 (23.0%) had died, 11 (5.6%) had moved from the region, 19 (9.7%) declined participation, and 14 (7.1%) were excluded for medical reasons (Fig. 1); 107 subjects were therefore enrolled, of whom 3 withdrew after the first visit. The mean age was 63.1 years (range 46 - 83), 49 (45.8%) were men, and none were HIV-positive. Of the 104 parti-cipants, 39 (37.5%) were classified as DPTB, 34 (32.7%) as PPTB and 31 (29.8%) as NPTB.
The baseline demographics of the groups were similar (age, sex, smoking status, number of pack-years of smoking, cannabis use, symptoms of chronic bronchitis, or past diagnosis of asthma). Of the subjects with features of asthma (n=17), 12 (70.6%) were smokers. No subjects had significant exposure to biomass fuels (Table 1).
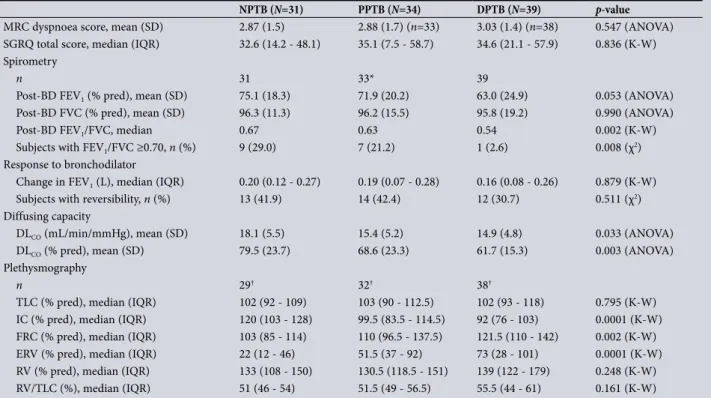
Total SGRQ and MRC dyspnoea scores were not significantly different between the groups. CAL was not confirmed in 17 of 103 subjects (16.5%), 9 NPTB, 7 PPTB and 1 DPTB. Between-group differences in mean percentage of predicted FEV1 (p=0.053), FVC (p=0.990), and FEV1 bronchodilator responsiveness were not
statistically significant (Table 2).
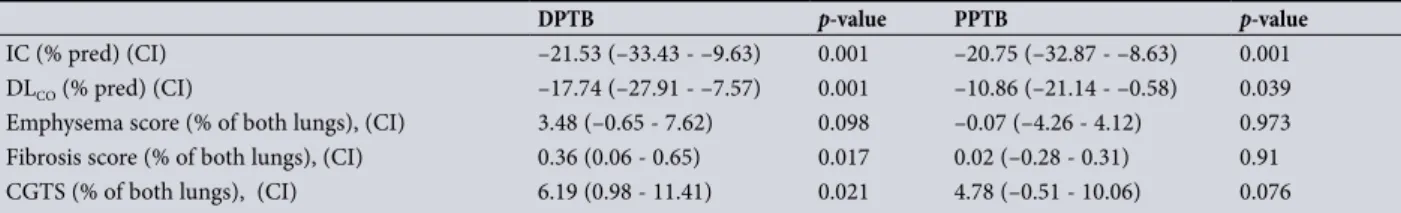
Inspiratory capacity (IC) was significantly lower in subjects with DPTB and PPTB than in those with NPTB, and expiratory reserve volume (ERV) and functional residual capacity (FRC) were higher. TLC, RV and RV/TLC were not different between the groups (Table 2 and Fig. 2). These differences remained when subjects without CAL were removed from the analysis (Table 3). On multivariate analysis, the IC was 21.5% (95% confidence interval (CI) –33.43 - –9.63) and 20.8% (CI –32.87 - –8.63) lower in the DPTB group and PPTB groups, respectively, compared with the NPTB group (Table 4).
The DLCO was significantly lower in subjects with both DPTB
and PPTB. On multivariate analysis, DLCO (% predicted) was 17.7% (CI –27.91 - –7.57) and 10.9% lower (95% CI –21.14 - – 0.58) in DPTB and PPTB, respectively, than in NPTB (Tables 2 and 4, Fig. 2).
HRCT fibrosis scores in DPTB, but not PPTB, were significantly higher than in NPTB, being 0.36% (95% CI 0.06 - 0.65; p=0.017) higher on multivariate analysis, but overall scores were low (Tables 4 and 5). Analysis by lobe confirmed that only in the right upper lobe (RUL) was the fibrosis score significantly higher (data not shown). Emphysema scores were non-significantly greater in the DPTB group, for both uni- and multivariate analysis (Tables 3 and 4).
Died n=45 (22.9%) Respiratory n=8 Cardiovascular n=10 Cancer n=3 Other causes n=3 Unknown n=21 Moved n=11 (5.6%) Declined n=19 (9.7%) Excluded n=14 (7.1%) Dementia n=5 Malignancy n=3 Substance abuse n=3 Other n=3
Identified with COPD
in BOLD study[14] N=196 Enrolled n=107 (54.6%) Included n=104 (53.1%) NPTB n=31 (29.8%) PPTB n=34 (32.7%) n=39 (37.5%)DPTB
Withdrew after first visit
n=3 IC (% pr ed) FE V1 (% pr ed) 140 100 60 20 200 150 100 50 30 15 0 –15 140 100 60 20 DLCO (% pr ed) CGT S (%) A B C D
442
May 2017, Vol. 107, No. 5
The mean gas trapping score on expir-ation was higher in both the DPTB (38.9%) and PPTB groups (32.8%) compared with the NPTB group (26.7%; p=0.006). The median CGTS (calculated by subtracting the emphysema score from the gas trapping score) in the DPTB group was higher than in the PPTB and NPTB groups on univariate
analysis (p=0.011), and also higher than in the NPTB group on multivariate analysis (p=0.021) (Tables 4 and 5).
No between-group differences in measures of airway thickness (Pi10, average wall thick-ness of the 4th- and 5th-generation bron-chi, average percentage wall area of the 4th- (WT4) and 5th-generation bronchi) were
observed (Table 5). However, the WT4 in the RUL in DPTB and PPTB subjects combined was higher than in NPTB subjects (median 0.80 mm; (interquartile range (IQR) 0.6 - 1.1) v. 0.67 mm (IQR 0.55 - 0.79); p=0.036).
Discussion
This study, performed in a low- to middle-income population with a high prevalence of TB, suggests that there are differences in the mechanisms of airflow limitation in subjects with previous TB compared with the more common smoking-related COPD. The most significant differences in TB-associated obstructive pulmonary disease (TOPD) were more evidence of static gas (air) trapping on lung function testing and quantitative HRCT, and a lower DLCO.
The physiological evidence for static gas trapping in TOPD was lower IC (21.5% lower), higher FRC and higher ERV com-pared with subjects with COPD without this history, while no differences in TLC, RV and RV/TLC were observed.
Together, these findings suggest a com-bination of pathologies in TOPD. First is
Table 1. Baseline characteristics according to PTB category
NPTB (N=31) PPTB (N=34) DPTB (N=39) p-value Age (years) Mean (range) 62.9 (46.4 - 82.7) 64.9 (51.3 - 79.0) 61.6 (47.9 - 81.9) Median 61.4 67.3 59.8 0.283 (K-W) Male, n (%) 12 (38.7) 14 (41.2) 23 (59.0) 0.169 (χ2) Cigarette smoking Current, n (%) 11 (35.5) 20 (58.8) 23 (59.0) Previous, n (%) 13 (41.9) 11 (32.4) 14 (35.9) Never, n (%) 7 (22.6) 3 (8.8) 2 (5.1) 0.125 (Fisher)
Pack-years, mean (SD), median (IQR) 20.8 (23.4),
13.1 (1.0 - 31.2) 22.9 (19.5),19.9 (9.5 - 35.5) 26.3 (24.2),22.0 (14.6 - 32.5) 0.270 (K-W) Cannabis smoking
Current/previous, n (%) 9 (29.0) 8 (23.5) 14 (35.9) 0.512 (χ2)
Joint-years, median (IQR) 0 (0 - 0.14) 0 (0 - 0) 0 (0 - 19) 0.421 (K-W)
Chronic bronchitis, n (%) 5 (16.1) 9 (26.5) 16 (41.0) 0.069 (χ2)
Features of asthma, n (%)* 7 (22.6) 6 (17.6) 4 (10.3) 0.341 (χ2)
Features of asthma with current/previous
smoking, n (%) 5 (16.1) 4 (11.8) 3 (7.7) 1.000 (Fisher)
Chronic respiratory medication use, n (%)
SABA 8 (25.8) 10 (29.4) 13 (33.3) 0.790 (χ2) SAMA 3 (9.7) 2 (5.9) 5 (12.8) 0.605 (χ2) LABA 1 (3.2) 2 (5.9) 1 (2.6) 0.746 (χ2) ICS 6 (19.4) 6 (17.7) 5 (12.8) 0.740 (χ2) Theophylline 3 (9.7) 3 (8.8) 4 (10.3) 0.043 (χ2) Comorbidity, n (%) Hypertension 17 (54.8) 15 (44.1) 17 (43.6) 0.589 (χ2) Diabetes 5 (16.1) 4 (11.8) 4 (10.3) 0.752 (χ2) Hypercholesterolaemia 6 (19.4) 2 (5.9) 2 (5.1) 0.089 (χ2) Arthritis 6 (19.4) 7 (20.6) 3 (7.7) 0.240 (χ2)
IQR = interquartile range; SABA = short-acting beta-agonist; SAMA = short-acting antimuscarinic agent; LABA = long-acting beta-agonist; ICS = inhaled corticosteroid;
K-W = Kruskal-Wallis test; χ2 = χ2 test; Fisher = Fisher’s exact test.
*Missing data for 1 patient.
Dementia n=5 Malignancy n=3 Substance abuse n=3 Other n=3 Enrolled n=107 (54.6%) Included n=104 (53.1%) NPTB n=31 (29.8%) PPTB n=34 (32.7%) n=39 (37.5%)DPTB
Withdrew after first visit n=3 NPTB PPTB DPTB ANOVA: p=0.0529 (n=103) NPTB PPTB DPTB K-W: p=0.0001 (n=99) NPTB PPTB DPTB ANOVA: p=0.003 (n=103) NPTB PPTB DPTB K-W: p=0.0105 (n=94) IC (% pr ed) FE V1 (% pr ed) 140 100 60 20 200 150 100 50 30 15 0 –15 140 100 60 20 DL CO (% pr ed) CGT S (%) A B C D
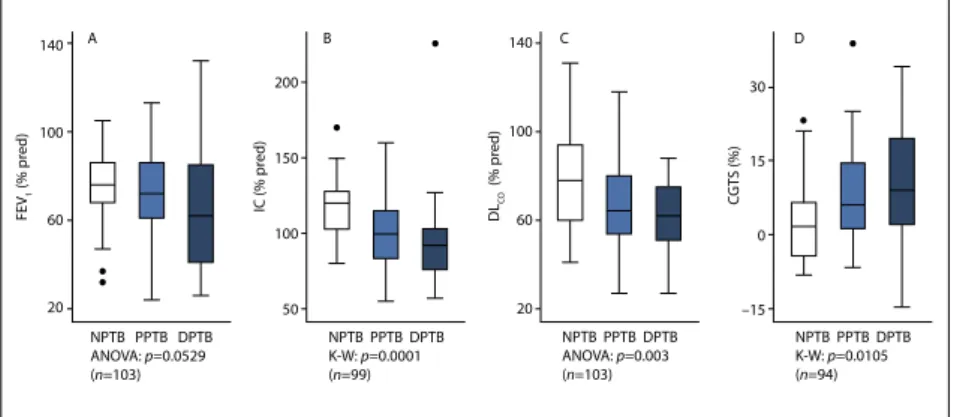
Fig. 2. Comparison of subjects with NPTB, PPTB and DPTB: (A) FEV1; (B) IC; (C) DLCO; (D) CGTS on
HRCT scan. Box-and-whisker plots. (CGTS = (gas trapping score on expiratory CT scan) – (emphysema score on inspiratory CT scan); % pred = percentage of predicted; ANOVA = analysis of variance; K-W = Kruskal-Wallis test.)
RESEARCH
emphysema with gas trapping only evident on expiratory HRCT scans. The gas trapping is probably caused by cicatricial narrowing of small airways, without major involvement of the larger airways in this population. This is supported by the lack of difference in quantitative measurements of larger airway dimensions on HRCT, which for technical reasons only includes the first five airway generations. Notably, there was no evidence of bronchiectasis or stenosis of large and medium-sized airways in any of the subjects. The observed
increase in the gas trapping score in TOPD measured by quantitative HRCT was also not accounted for by a greater emphysema score at TLC. Additionally, the small observed increase in the fibrosis score in TOPD subjects was mainly accounted for by the RUL (the lobe most frequently involved in PTB), but did not influence the TLC, implying lack of significant fibrotic restriction.
A second significant finding was the reduction in DLCO in subjects
with TOPD. Although commonly reduced in COPD and correlated
Table 2. Comparison of symptoms and lung physiology according to PTB status
NPTB (N=31) PPTB (N=34) DPTB (N=39) p-value
MRC dyspnoea score, mean (SD) 2.87 (1.5) 2.88 (1.7) (n=33) 3.03 (1.4) (n=38) 0.547 (ANOVA) SGRQ total score, median (IQR) 32.6 (14.2 - 48.1) 35.1 (7.5 - 58.7) 34.6 (21.1 - 57.9) 0.836 (K-W) Spirometry
n 31 33* 39
Post-BD FEV1 (% pred), mean (SD) 75.1 (18.3) 71.9 (20.2) 63.0 (24.9) 0.053 (ANOVA)
Post-BD FVC (% pred), mean (SD) 96.3 (11.3) 96.2 (15.5) 95.8 (19.2) 0.990 (ANOVA)
Post-BD FEV1/FVC, median 0.67 0.63 0.54 0.002 (K-W)
Subjects with FEV1/FVC ≥0.70, n (%) 9 (29.0) 7 (21.2) 1 (2.6) 0.008 (χ2)
Response to bronchodilator
Change in FEV1 (L), median (IQR) 0.20 (0.12 - 0.27) 0.19 (0.07 - 0.28) 0.16 (0.08 - 0.26) 0.879 (K-W)
Subjects with reversibility, n (%) 13 (41.9) 14 (42.4) 12 (30.7) 0.511 (χ2)
Diffusing capacity
DLCO (mL/min/mmHg), mean (SD) 18.1 (5.5) 15.4 (5.2) 14.9 (4.8) 0.033 (ANOVA)
DLCO (% pred), mean (SD) 79.5 (23.7) 68.6 (23.3) 61.7 (15.3) 0.003 (ANOVA)
Plethysmography
n 29† 32† 38†
TLC (% pred), median (IQR) 102 (92 - 109) 103 (90 - 112.5) 102 (93 - 118) 0.795 (K-W) IC (% pred), median (IQR) 120 (103 - 128) 99.5 (83.5 - 114.5) 92 (76 - 103) 0.0001 (K-W) FRC (% pred), median (IQR) 103 (85 - 114) 110 (96.5 - 137.5) 121.5 (110 - 142) 0.002 (K-W) ERV (% pred), median (IQR) 22 (12 - 46) 51.5 (37 - 92) 73 (28 - 101) 0.0001 (K-W) RV (% pred), median (IQR) 133 (108 - 150) 130.5 (118.5 - 151) 139 (122 - 179) 0.248 (K-W) RV/TLC (%), median (IQR) 51 (46 - 54) 51.5 (49 - 56.5) 55.5 (44 - 61) 0.161 (K-W)
SD = standard deviation; IQR = interquartile range; BD = bronchodilator; % pred = percentage of predicted; IC = inspiratory capacity; FRC = functional residual capacity;
ERV = expiratory reserve volume; ANOVA = analysis of variance; K-W = Kruskal-Wallis test; χ2 = χ2 test.
*One subject not able to perform spirometry.
†Five subjects not included in plethysmography for technical reasons.
Table 3. Lung physiology results according to PTB status for subjects with CAL at first visit*
NPTB PPTB DPTB p-value
Spirometry
n 22 26 38
Post-BD FEV1 (% pred), mean (SD) 69.6 (17.9) 68.5 (20.5) 62.7 (25.2) 0.423 (ANOVA)
Post-BD FVC (% pred), mean (SD) 97.0 (12.7) 97.9 (15.7) 96.2 (19.3) 0.926 (ANOVA)
Post-BD FEV1/FVC (median) 0.59 0.60 0.54 0.113 (K-W)
Diffusing capacity
n 22 26 38
DLCO (mL/min/mmHg), mean (SD) 17.9 (6.2) 15.1 (5.2) 14.9 (4.8) 0.088 (ANOVA)
DLCO (% pred), mean (SD) 78.3 (24.4) 67.0 (23.1) 61.7 (15.5) 0.013 (ANOVA)
Plethysmography
n 21 25 37
TLC (% pred), median (IQR) 103 (94 - 113) 106 (92 - 116) 102 (97 - 118) 0.996 (K-W) RV (% pred), median (IQR) 135 (117 - 156) 135 (124 - 157) 141 (125 - 179) 0.681 (K-W)
RV/TLC (%), mean (SD) 50.8 (7.0) 52.4 (6.5) 54.1 (10.1) 0.345 (ANOVA)
IC (% pred), median (IQR) 119 (103 - 127) 97 (85 - 112) 92 (78 - 103) 0.0004 (K-W)
ERV (% pred), median (IQR) 26 (14 - 63) 58 (37 - 101) 69 (37 - 90) 0.005 (K-W)
FRC (% pred), median (IQR) 105 (94 - 115) 114 (99 - 141) 122 (110 - 142) 0.046 (K-W)
BD = bronchodilator; SD = standard deviation; IQR = interquartile range; % pred = percentage of predicted; ANOVA = analysis of variance; K-W = Kruskal-Wallis test.
444
May 2017, Vol. 107, No. 5
with the presence of emphysema, in our study of patients with TOPD, the DLCO was 17.7% lower than in the control group with COPD,
although emphysema scores in these individuals were not significantly higher. An alternative hypothesis for this reduction in DLCO is the
attenuation of the pulmonary vasculature within the bronchovascular bundles surrounding the small airways, resulting in ventilation/ perfusion mismatch. Fibrosis in this location may compromise the pulmonary vasculature and increase pulmonary resistance, resulting in pulmonary hypertension, which is known to be more common after PTB than in the more common forms of COPD.[16,17]
The proposal that the small airways are the major site of pathology in healed PTB is supported by HRCT findings in the active phase of PTB, in which centrilobular or ‘tree-in-bud’ patterns are found in 95% of patients. These lesions are usually not evident on conventional chest radiographs, but are much more extensive than anticipated using HRCT scans.[18,19] An alternative hypothesis for CAL following
PTB is that persistence of mycobacterial antigens induces or acts as a co-factor with smoking and environmental factors such as bio mass fuel or pollution, sustaining chronic airway inflammation that in due course results in bronchial narrowing with or without paren chymal destruc tion. Serum levels of soluble inter leukin-2R, inter leukin-6, tumour necrosis factor-alpha, and inter feron-gamma in COPD
pati-ents with TB have been reported to be significantly higher than those in patients with COPD alone.[20,21]
Study limitations
Our study has a number of limitations. Firstly, the ideal study design to explore differences in mechanisms and answer questions surrounding temporality would be a prospective population-based cohort of subjects both exposed and not exposed to TB who subsequently develop CAL. Our CAL cohort was detected in the BOLD community-based survey of randomly selected subjects who were not seeking healthcare, resulting in a cohort with a wide range of severities of CAL, some with features of asthma as a confounding factor, but homogeneous in terms of ethnicity, income and education, and living within a relatively small geographical location. Their domestic, environmental and other exposures and the impact of other confounding factors, both known and unknown, were likely to have been similar. Fortuitously, the proportions of subjects in the three groups were similar, and the fact that the intermediate group (PPTB) showed features similar to the DPTB group for most endpoints supports the conclusions of the study.
A further weakness attributable to the design is the numerical (but not statistically significant) differences in FEV1 and smoking histories
Table 4. Multivariate analysis* – DPTB and PPTB v. NPTB
DPTB p-value PPTB p-value
IC (% pred) (CI) –21.53 (–33.43 - –9.63) 0.001 –20.75 (–32.87 - –8.63) 0.001
DLCO (% pred) (CI) –17.74 (–27.91 - –7.57) 0.001 –10.86 (–21.14 - –0.58) 0.039
Emphysema score (% of both lungs), (CI) 3.48 (–0.65 - 7.62) 0.098 –0.07 (–4.26 - 4.12) 0.973 Fibrosis score (% of both lungs), (CI) 0.36 (0.06 - 0.65) 0.017 0.02 (–0.28 - 0.31) 0.91 CGTS (% of both lungs), (CI) 6.19 (0.98 - 11.41) 0.021 4.78 (–0.51 - 10.06) 0.076
% pred = percentage of predicted; CGTS = (gas trapping score on expiratory CT scan) – (emphysema score on inspiratory CT scan). *Covariates adjusted for age, sex, cigarette smoking (pack-years), cannabis use (joint-years), features of asthma.
Table 5. Univariate analysis of quantitative lung imaging
NPTB PPTB DPTB p-value
Parenchymal assessment*
n 28 31 35
Lung volumes at TLC
RUL volume (% of TLV), median 22.6 20.1 19.8 0.102 (K-W)
LUL volume (% of TLV), median 23.4 24.4 24.3 0.804 (K-W)
Lung density scores
Emphysema score (% of both lungs), mean (SD) 24.0 (7.1) 24.3 (10.2) 28.6 (8.1) 0.062 (ANOVA) Fibrosis score (% of both lungs), median (IQR) 2.1 (1.8 - 2.5) 2.1 (1.7 - 2.4) 2.3 (2.0 - 2.7) 0.055 (K-W) Gas trapping (% of both lungs), mean (SD) 26.7 (13.0) 32.8 (15.5) 38.9 (15.1) 0.006 (ANOVA) CGTS (% of both lungs), median (IQR) 1.7 (–4.2 - 6.6) 6.1 (1.4 - 14.6) 9.1 (2.1 - 19.6) 0.011 (K-W) Airway assessment†
Pi10, median (IQR) 2.53 (2.2 - 2.74)
(n=30) 2.45 (2.26 - 2.89) (n=32) 2.36 (2.01 - 2.82) (n=37) 0.713 (K-W)
WA4%, median (IQR) 49.6 (46.1 - 55.9)
(n=30) 50.3 (45.1 - 56.3) (n=32) 50.9 (45.6 - 54.5) (n=37) 0.941 (K-W)
WA5%, median (IQR) 46.6 (42.5 - 52.6)
(n=30) 49.9 (42.5 - 54.2) (n=32) 45.7 (38.9 - 51.1) (n=39) 0.378 (K-W) WT4 (mm), median (IQR) 0.83 (0.72 - 0.92) (n=30) 0.83 (0.75 - 0.94) (n=31) 0.85 (0.79 - 0.96) (n=38) 0.197 (K-W) WT5 (mm), median (IQR) 0.69 (0.62 - 0.81) (n=30) 0.72 (0.62 - 0.79)(n=31) 0.65 (0.60 - 0.80)(n=37) 0.896 (K-W)
LUL = left upper lobe; RUL = right upper lobe; SD = standard deviation; IQR = interquartile range; CGTS = (gas trapping score on expiratory CT scan) – (emphysema score on inspiratory CT scan); WA4% and WA5% = average percentage wall area of 4th- and 5th-generation bronchi, respectively; WT4 and WT5 = average wall thickness of 4th- and 5th-generation bronchi, respectively; K-W = Kruskal-Wallis test; ANOVA = analysis of variance.
*Nine inspiratory scans technically unsuitable for quantitative assessment.
RESEARCH
between the DPTB group and the other two groups, which may have accounted for some of the other observed between-group differences in physiology. However, the pattern observed across endpoints suggests the within-group validity of the mechanisms of airflow limitation proposed in patients with DPTB, regardless of between-group comparisons. This is borne out by the consistency of findings in multivariate analysis (where smoking pack-years are adjusted for) and in sensitivity analyses, where subjects without CAL were removed. There are a number of possible reasons for the finding of absence of CAL, as defined by a low FEV1/FVC ratio, in 16.5% of subjects, who
had previously been found to be obstructed. These include discrepant rates of decline in FEV1 compared with FVC, measurement error, and
potentially physiological improvement. It is important to note that lung function improvement has been described in a small proportion of subjects in several of the larger COPD cohorts.[22,23]
Other weaknesses are the small sample size and potential selection bias. In the 2005 BOLD study, the response rate was 63%,[14] and in the
current follow-up study it was 53%, with 23% of eligible subjects having died. Some of the latter, in whom no cause of death was obtained, may have died from complications of CAL. The small sample size prevents assessment of other potential mechanisms of CAL in patients with COPD such as the role of chronic inflammation, potential synergic roles of smoking and retained mycobacterial antigens, bacterial colonisation and infections. Finally, the method of determining previous PTB status is a potential additional weakness. History alone tends to underestimate and HRCT probably overestimates the prevalence of TB.[6] Confirmation of bacteriologically proven PTB
was not possible in this community. Interferon-gamma release assays and tuberculin skin testing were not performed, as these have been shown to be uninformative in adults in a high-TB setting.[24,25] It was
also not possible to assess causality of CAL by PTB, or suscepti bility to PTB in COPD. There are, however, limited published data, some from longitudinal studies, suggesting that both relationships exist. [26-29]
However, in spite of these limitations we suggest that our study serves as an important first step towards investigating differ ences between TOPD and more common forms of COPD.
Conclusions
Globally, survivors of PTB may number many millions. Our popu-lation-based study provides a glimpse of the potential magnitude of the importance of TB as a cause of CAL in areas with a high prevalence of TB, and of possible disease mechanisms that distinguish TB-associated CAL from more common forms of COPD. We suggest that TOPD is characterised by gas trapping without overall hyperinflation, probably resulting from fibrosis surrounding small airways, and reduced diffusing capacity possibly reflecting pulmonary vascular (small-vessel) involvement. It may be appropriate to use the term TOPD for patients with this association, and to consider it a phenotype of COPD. This form of COPD requires further prospective study to examine whether these physiological and radiological differences translate into differences in prognosis or response to therapy.
Acknowledgements. We acknowledge the contribution of staff in the Lung
Clinical Research Unit of the University of Cape Town Lung Institute and the Desmond Tutu TB Centre, Stellenbosch University, and the subjects who participated in the study.
Author contributions. Study conception and design: BWA, EDB, CBC,
JG, NB; data acquisition: BWA, RG, MB, HO, LT-B, GLC, RvZ-S; image processing and analysis: MG-A, QS-H, JG, EvR; physiology analysis:
BWA, EDB, CBC; data interpretation: BWA, EDB, NB, JG, CBC, EvR; manuscript preparation: all.
Funding. Financial support was received from the UCT Lung Institute,
a Discovery Foundation Academic Scholarship, a South African Medical Research Council Scholarship and a South Africa Thoracic Society/AstraZeneca Scholarship. LT-B was funded by a grant from the Portuguese Foundation for Science and Technology (FCT): grant FCT-FRH/BSAB/976/2010.
Conflicts of interest. None.
1. World Health Organization. Chronic obstructive pulmonary disease (COPD). Fact Sheet No 315. http://
www.who.int/mediacentre/factsheets/fs315/en/ (accessed 14 October 2016).
2. Salvi SS, Barnes PJ. Chronic obstructive pulmonary disease in non-smokers. Lancet
2009;374(9691):733-743. http://dx.doi.org/10.1016/S0140-6736(09)61303-9
3. Amaral AFS, Coton S, Kato B, et al. Tuberculosis associates with both airflow obstruction and low lung
function: BOLD results. Eur Respir J 2015;46(4):1104-1112.
http://dx.doi.org/10.1183/13993003.02325-2014
4. Menezes AMB, Hallal PC, Perez-Padilla R, et al. Tuberculosis and airflow obstruction: Evidence
from the PLATINO Study in Latin America. Eur Respir J 2007;30(6):1180-1185. http://dx.doi.
org/10.1183/09031936.00083507
5. Caballero A, Torres-Duque CA, Jaramillo C, et al. Prevalence of COPD in five Colombian cities situated
at low, medium, and high altitude (PREPOCOL Study). Chest 2008;133(2):343-349. http://dx.doi.
org/10.1378/chest.07-1361
6. Lam KB, Jiang CQ, Jordan RE, et al. Prior TB, smoking, and airflow obstruction : A cross-sectional
analysis of the Guangzhou Biobank Cohort Study. Chest 2010;137(3):593-600. http://dx.doi.org/10.1378/
chest.09-1435
7. Idolor LF, de Guia TS, Francisco NA, et al. Burden of obstructive lung disease in a rural setting in the
Philippines. Respirology 2011;16(7):1111-1118. http://dx.doi.org/10.1111/j.1440-1843.2011.02027.x
8. Jithoo A. Respiratory symptoms and chronic obstructive pulmonary disease: Prevalence and risk factors in a predominantly low-income urban area of Cape Town, South Africa. PhD thesis. Cape Town: University of Cape Town, 2006.
9. Anno H, Tomashefski JF. Studies on the impairment of respiratory function in pulmonary tuberculosis. Am Rev Tuberc Pulm Dis 1955;71(3):333-348.
10. Snider GL, Doctor L, Demas TA, Shae AR. Obstructive airway disease in patients with treated pulmonary tuberculosis. Am Rev Respir Dis 1971;103:625-640.
11. Willcox PA, Ferguson AD. Chronic obstructive airways disease following treated pulmonary tuberculosis. Respir Med 1989;83(3):195-198.
12. Lopez-Campos JL, Calero C. Infectious causes of chronic obstructive pulmonary disease: ‘TB or not TB,
that is the question’. Respiration 2013;86(1):15-16. http://dx.doi.org/10.1159/000351792
13. De Wit E, Delport W, Rugamika CE, et al. Genome-wide analysis of the structure of the South African
coloured population in the Western Cape. Hum Genet 2010;128(2):145-153. http://dx.doi.org/10.1007/
s00439-010-0836-1
14. Buist AS, McBurnie MA, Vollmer WM, et al. International variation in the prevalence of COPD (the
BOLD Study): A population-based prevalence study. Lancet 2007;370(9589):741-750. http://dx.doi.
org/10.1016/S0140-6736(07)61377-4
15. Miller MR, Hankinson J, Brusasco V, et al. Standardisation of spirometry. Eur Respir J
2005;26(2):319-338. http://dx.doi.org/10.1183/09031936.05.00034805
16. Samuelsson S. Chronic cor pulmonale in pulmonary tuberculosis. Acta Med Scand 2009;142(5):315-324. http://dx.doi.org/10.1111/j.0954-6820.1952.tb13871.x
17. Walzer I, Frost TT. Cor pulmonale: A consideration of clinical and autopsy findings. Dis Chest 1954;26(2):192-198.
18. Im JG, Itoh H, Shim YS, et al. Pulmonary tuberculosis: CT findings – early active disease and sequential
change with antituberculous therapy. Radiology 1993;186(3):653-660. http://dx.doi.org/10.1148/
radiology.186.3.8430169
19. Long R, Maycher B, Dhar A, Manfreda J, Hershfield E, Anthonisen N. Pulmonary tuberculosis treated with directly observed therapy serial changes in lung structure and function. Chest 1998;113(4):933-943. http://dx.doi.org/10.1378/chest.113.4.933
20. Tang S, Cui H, Yao L, et al. Increased cytokines response in patients with tuberculosis complicated with
chronic obstructive pulmonary disease. PLoS One 2013;8(4):e62385. http://dx.doi.org/10.1371/journal.
pone.0062385
21. Ong CWM, Elkington PT, Friedland JS. Tuberculosis, pulmonary cavitation, and matrix
metalloproteinases. Am J Respir Crit Care Med 2014;190(1):9-18. http://dx.doi.org/10.1164/
rccm.201311-2106PP
22. Vestbo J, Edwards LD, Scanlon PD, et al. Changes in forced expiratory volume in 1 second over time in
COPD. N Engl J Med 2011;365(13):1184-1192. http://dx.doi.org/10.1056/NEJMoa1105482
23. Casanova C, de Torres JP, Aguirre-Jaíme A, et al. The progression of chronic obstructive pulmonary disease is heterogeneous: The experience of the BODE cohort. Am J Respir Crit Care Med
2011;184(9):1015-1021. http://dx.doi.org/10.1164/rccm.201105-0831OC
24. Ling DI, Pai M, Davids V, et al. Are interferon-γ release assays useful for diagnosing active tuberculosis
in a high-burden setting? Eur Respir J 2011;38(3):649-656. http://dx.doi.org/10.1183/09031936.00181610
25. Den Boon S, van Lill SWP, Borgdorff MW, et al. Association between smoking and tuberculosis
infec-tion: A population survey in a high tuberculosis incidence area. Thorax 2005;60(7):555-557. http://dx.doi.
org/10.1136/thx.2004.030924
26. Hnizdo E, Singh T, Churchyard G. Chronic pulmonary function impairment caused by initial and
recurrent pulmonary tuberculosis following treatment. Thorax 2000;55(1):32-38. http://dx.doi.
org/10.1136/thorax.55.1.32
27. O’Toole RF, Shukla SD, Walters EH. TB meets COPD: An emerging global co-morbidity in human lung
disease. Tuberculosis 2015;95(6):659-663. http://dx.doi.org/10.1016/j.tube.2015.08.005
28. Lee C-H, Lee M-C, Shu C-C, et al. Risk factors for pulmonary tuberculosis in patients with chronic
obstructive airway disease in Taiwan: A nationwide cohort study. BMC Infect Dis 2013;13:194. http://
dx.doi.org/10.1186/1471-2334-13-194
29. Inghammar M, Ekbom A, Engström G, et al. COPD and the risk of tuberculosis – a population-based
cohort study. PLoS One 2010;5(4):e10138. http://dx.doi.org/10.1371/journal.pone.0010138