UNIVERSIDADE DE LISBOA
FACULDADE DE CIÊNCIAS
DEPARTAMENTO DE BIOLOGIA ANIMAL
An evolutionary perspective on the circadian system in western
Iberian Squalius freshwater species
João Miguel Moreno
Mestrado em Biologia Evolutiva e do Desenvolvimento
Dissertação orientada por:
Professora Doutora Maria Manuela Coelho
I
Acknowledgements
Agradecimentos
Em primeiro lugar gostava de agradecer a todas as pessoas que, durante todo o meu percurso académico, contribuíram de alguma forma para o meu crescimento científico e, que de forma indireta, permitiram que eu chegasse até aqui.
Passo a agradecer, agora, aos meus colegas do grupo Evolutionary genetics do cE3c que, durante o projeto, contribuíram ativamente na discussão de ideias e que me fizeram companhia durante os períodos de trabalho na sala 12 e horas de almoço. Bora lá, amigos Squalius (e cetáceos)!
Agradeço também ao Tiago Jesus e ao David que ajudaram a rever o trabalho final.
Queria agradecer aos meus amigos por todo o apoio que me deram durante todo o meu percurso académico. No entanto, gostava de fazer um agradecimento extra a uma pessoa especial (e sim, tu sabes que me refiro a ti) por me ajudares a ultrapassar os piores momentos de todo este percurso. Foi também graças a ti que hoje atinjo este grande objetivo da minha vida. Este trabalho também é para ti!
Um enorme agradecimento à minha família (aos que estão e aos que já não estão entre nós), por me proporcionarem a oportunidade de poder traçar este caminho académico que escolhi e por terem sempre acreditado em mim, seja enquanto pessoa e/ou investigador. Estarão sempre comigo e este trabalho é também dedicado a vocês!
Por fim, faço um agradecimento especial à minha orientadora, a (grande) Professora Manuela Coelho, que sempre me ajudou em todos os momentos - bons e maus -, que sempre acreditou no meu potencial e, acima de tudo, esteve, em todos os momentos, disponível para ouvir as minhas ideias, que me deixou integrar duas áreas de investigação de que tanto gosto, que me estimulou a aprender mais e me ensinou grande parte do que hoje sei de Evolução (e de Squalius!). Jamais esquecerei todas as oportunidades que me proporcionou, mas também toda a paciência que teve comigo! Um grande obrigado.
II
Abstract
The circadian system is a biological timing system that improves the inherent ability of organisms to deal with environmental instabilities, creating oscillations that are highly synchronised with daily fluctuations of light in several biochemical processes. Temperature has been pointed as an integrant agent in several aspects of the circadian system. Fish, as ectothermic organisms, have an increased dependence on the environmental temperature to maintain and optimize the circadian system. Here we study the freshwater fish Squalius genus, which is represented in Portugal by four species distributed across a latitudinal gradient with variable environmental conditions of light and temperature. Squalius
carolitertii inhabits the Atlantic-type northern basins, while the sister species S. torgalensis and S. aradensis inhabit the Mediterranean-type southern basins. Additionally, S. pyrenaicus has a broader
distribution, inhabiting both Atlantic-type northern basins (e.g. Tagus) and Mediterranean-type southern basins (e.g. Almargem). This distribution gives the opportunity to study species adaptation to different environmental backgrounds. Analysis of S. torgalensis and S. carolitertii transcriptomes and comparison with light-induced zebrafish transcriptomes revealed four main gene families involved (Cryptochromes, Period, CLOCK and BMAL) in the circadian system, and one single-copy gene (timeless) whose function was possibly related to the circadian system. The cDNA of these identified genes was re-sequenced in S. torgalensis and S. carolitertii and sequenced de novo for S. pyrenaicus and S. aradensis. Characterisation of protein-protein interactions revealed that the studied proteins retain functions in the circadian system common to other vertebrates, but also display signals of diversification. Protein-protein interactions for TIMELESS revealed this protein presents a differentiation in its function towards the cell cycle regulation but retains the ability to act as a circadian regulator. Results of phylogenetic analysis of each family, based on predicted protein sequences for Squalius species, were, for some proteins (CRY1BA, PER1A, PER2, BMAL2 and TIMELESS), congruent with the phylogenies of other nuclear genes from these species. Moreover, by using an integrative approach involving tests to detect signatures of selection and a structural and functional protein analysis, it was possible to infer N-S patterns consistent with adaptation in these species, probably related with the different environmental conditions they experience. Additionally, S.
torgalensis seems to present a pattern of local adaptation in two proteins (CRY1AA and PER1A) that
could be explained by the specific environmental conditions experienced in Mira basin. Lastly, a well-supported convergence for some proteins (CRY1BB, CRY3, PER3, CLOCKA, CLOCKB, BMAL1A and BMAL1B) was found in southern populations of S. aradensis and S. pyrenaicus from Almargem. Signatures of selection supported this convergence in clocka, but for other genes, convergence was only exposed after protein characterisation. Convergence was evident because these proteins display similar features, specifically in physicochemical parameters and post-translational modifications patterns, congruent with the more similar environmental conditions they experience. Also, our results support that the evolution of circadian-related proteins in these species has been strongly driven by temperature, as thermostability was found to be the protein feature presenting most modifications in all protein.
III
Resumo
O ritmo circadiano constitui um importante sistema biológico que permite a sincronização de diversas funções biológicas dos organismos de acordo com as flutuações diárias de luz. Sendo assim, atua como um relógio endógeno por um período de ~24h, sendo regulado a nível molecular por redes de retroação compostas por elementos positivos e negativos que, respetivamente, ativam ou reprimem a expressão de genes alvo. Estas redes são mantidas por quatro famílias de genes (CRY, PER, CLOCK e BMAL). As proteínas CLOCK e BMAL atuam como um heterodímero (CLOCK:BMAL), ligando-se às E-boxes no ADN de forma a ativar a expressão dos genes alvo, incluindo os elementos negativos do ciclo, os genes cry e per. Após a tradução dos genes referidos, as proteínas CRY e PER formam também um heterodímero (CRY:PER), que interage com o heterodímero CLOCK:BMAL, levando à repressão da expressão génica, incluindo os próprios cry e per. O ciclo repete-se quando os níveis de CRY:PER são baixos o suficiente para o CLOCK:BMAL poder novamente ligar-se ao ADN e estimular a expressão génica. Adicionalmente, o gene timeless, que codifica para a proteína TIMELESS, mostrou ser uma parte central do ritmo circadiano em Drosophila, mas as suas funções nos vertebrados permanecem ainda pouco estudadas, tendo sido proposto que a proteína TIMELESS possa desempenhar um papel secundário no ritmo circadiano, ao servir de alternativa às proteínas PER. As consequências das interações moleculares que ocorrem no ritmo circadiano manifestam-se, entre outras, na otimização do metabolismo, regulação da expressão génica, e resposta a alterações ecológicas e ambientais. Todo o sistema do ritmo circadiano encontra-se, ele próprio, sincronizado pelas flutuações diárias de luz. Contudo, foi também proposto que a temperatura ambiental apresenta um papel fulcral na sincronização e manutenção do ritmo circadiano.
As famílias de genes envolvidas no ritmo circadiano têm vindo a ser extensivamente caracterizadas, em particular nos peixes, organismos que possuem um acrescido número de parálogos face a outros vertebrados. Para além disto, os peixes possuem diversas adaptações a nível do ritmo circadiano e temperatura, pois sendo ectotérmicos, apresentam uma maior dependência face à temperatura ambiental para desempenhar as suas funções fisiológicas.
O género Squalius encontra-se representado nos rios Portugueses por quatro espécies (S.
carolitertii, S. pyrenaicus, S. torgalensis e S. aradensis), distribuídas ao longo de um gradiente
latitudinal de luz e temperatura. S. carolitertii é a espécie que habita os rios da região a norte do Tejo (ex: Mondego), S. pyrenaicus apresenta uma distribuição mais alargada, habitando as bacias do centro e sul (ex: Tejo e Almargem), enquanto as espécies S. torgalensis e S. aradensis, se encontram confinadas a pequenas bacias no sudoeste de Portugal (ex. Mira e Arade). A esta distribuição encontra-se subjacente uma variação ambiental latitudinal, uma vez que as bacias das regiões norte e centro estão sob influência Atlântica, apresentando temperaturas mais baixas, enquanto as bacias da região sul se encontram sob influência Mediterrânea, apresentando, de um modo geral, temperaturas mais altas e onde ocorrem períodos de seca durante o Verão. Existe também uma variação na duração e intensidade da luminosidade ao longo deste gradiente latitudinal. Atendendo ao mencionado, estas espécies apresentam-se como um modelo de particular interesse no estudo da evolução adaptativa, nomeadamente ao nível do ritmo circadiano e sua relação com a temperatura.
No presente estudo, foram identificados os genes envolvidos no ritmo circadiano dos peixes dulciaquícolas do género Squalius com base numa análise dos transcriptomas de S. carolitertii e S.
torgalensis recentemente publicados, e sua comparação com resultados de outros transcriptomas de Danio rerio (aqui usado como organismo de referência), obtidos após a exposição a estímulos
luminosos. Identificaram-se quinze genes pertencentes às quatro grandes famílias já descritas: seis genes da família CRY (cry1aa, cry1ab, cry1ba, cry1bb, cry2 e cry3); quatro genes da família PER (per1a, per1b, per2 e per3); dois genes da família CLOCK (clocka e clockb); e três genes da família
IV BMAL (bmal1a, bmal1b e bmal2). Adicionalmente, foi identificado o gene timeless. Com exceção da família CLOCK, na qual não foi possível identificar o gene clock2, a constituição de todas as famílias encontra-se de acordo com o descrito para outros peixes, nomeadamente D. rerio. Os genes referidos foram sequenciados para todas as espécies em estudo, através de ADN complementar, tendo sido as sequências destes posteriormente utilizadas para prever as sequências das proteínas para as quais codificam.
Através das sequências das proteínas foi possível caracterizar os padrões de interação proteína-proteína, que revelaram que estas proteínas retêm as suas funções ancestrais como reguladores circadianos, exibindo no entanto, sinais de diversificação pós-duplicação que se observam através de interação das proteínas CRY e PER com outras proteínas cuja função se encontra mais relacionada com a resposta à temperatura. Isto, não só mostra a sua diversificação como também reforça a relação entre o ritmo circadiano e a temperatura na otimização das oscilações circadianas. Para a proteína TIMELESS, esta análise permitiu clarificar a sua função nas espécies estudadas, já que, apesar da proteína manter a capacidade de interagir com as proteínas CRY e, assim, manter uma potencial função como regulador circadiano, a maior parte das suas interações dão-se com proteínas relacionadas com a regulação do ciclo celular.
A análise filogenética de cada família de genes, conseguida a partir das sequências das proteínas previstas, permitiu mostrar as relações evolutivas das duplicações nestas espécies do género Squalius, confirmando que a história evolutiva dos genes destas famílias é idêntica ao já descrito para outras espécies de peixes.
Adicionalmente, integrando testes estatísticos para determinar as assinaturas de seleção a nível molecular (dN/dS) com a caracterização estrutural e funcional das proteínas, foi possível também estudar a adaptação destas espécies às diferentes condições de luz e temperatura a que estão sujeitas. Para as proteínas CRY1BA, PER1A, PER2, BMAL2 e TIMELESS, o padrão encontrado parece refletir a história evolutiva das espécies do género Squalius encontrada nas filogenias de outros genes nucleares.
Foi também encontrada, para outras proteínas, uma diferenciação Norte-Sul consistente a variação de luz e temperatura a que espécies estão sujeitas nos seus habitats. Para além disso, verificou-se que em S. torgalensis, para as proteínas CRY1AA e PER1A, os sinais desta adaptação local são notórios nos resultados dos testes de seleção, que mostram que, para estas proteínas, S.
torgalensis apresenta um forte sinal de seleção positiva. Além disso, a caracterização das proteínas,
nomeadamente através dos parâmetros físico-químicos e padrões de modificações pós-tradução, mostra que esta espécie se encontra particularmente diferenciada face às restantes. As evidências de adaptação local podem ser explicadas pelas condições particulares de luz e temperatura no rio Mira, nomeadamente, o maior ensombramento causado pela vegetação ripária e a temperatura média da água elevada, mas mais estável do que nos restantes rios do sul.
Encontrou-se, também, uma convergência entre as populações de S. aradensis e S. pyrenaicus de Almargem, nas proteínas CRY1BB, CRY3, PER3, CLOCKA, CLOCKB, BMAL1A e BMAL1B. As assinaturas de seleção permitiram suportar esta convergência no gene clocka, mas, nos restantes genes, esta convergência tornou-se evidente apenas após a caracterização das proteínas, uma vez que, nas referidas espécies, estas proteínas apresentam características semelhantes, nomeadamente a nível dos parâmetros físico-químicos e modificações pós-tradução. Estas características das referidas proteínas, refletem-se em valores de maior termoestabilidade nestas espécies, muito provavelmente relacionadas com o facto destas espécies habitarem rios com valores muito próximos de luz e temperatura.
V No geral, os resultados obtidos para a termoestabilidade da maior parte das proteínas estudadas, sugerem que a temperatura é um fator seletivo que se relaciona com a evolução destas proteínas nas espécies do género Squalius estudadas. Deste modo, também poderemos dizer que estas espécies constituem um bom modelo para a continuação destes estudos, nomeadamente ao explorar a relação entre o ritmo circadiano e a temperatura de forma mais detalhada.
Por fim, foi possível mostrar que a abordagem inovadora de integração dos resultados dos testes de seleção baseados no rácio dN/dS com a caracterização de proteínas agora apresentada, permite detetar sinais de seleção, cuja estatística associada a estes testes não permite, só por si, detetar.
Palavras-chave: Peixes de água doce Ibéricos; ritmo circadiano; adaptação; dN/dS; caracterização de proteínas
VI
Table of Contents
Acknowledgements ... I Abstract ... II Resumo ... III Table of Contents ... VI List of Tables and Figures ... VII List of Abbreviations ... XII1. Introduction ... 1
2. Materials and Methods ... 6
2.1. Sampling ... 6
2.2. Identification of circadian system related genes in Iberian freshwater fish ... 6
2.3. Gene sequencing and protein sequence prediction ... 7
2.4. Phylogenetic analysis ... 7
2.5. Analysis of signatures of selection ... 8
2.6. Functional analysis and structural organisation of the predicted proteins ... 8
3. Results ... 10
3.1. Evolution and characterisation of Cryptochrome Family ... 10
3.2. Evolution and characterisation of Period Family ... 14
3.3. Evolution and characterisation of CLOCK family ... 18
3.4. Evolution and characterisation of BMAL Family ... 21
3.5. Evolution and characterisation of TIMELESS Protein ... 24
4. Discussion ... 27
4.1. Evolution of circadian-related proteins in western Iberian Squalius ... 28
4.2. Evolution of circadian-related proteins according the N-S distribution ... 29
4.2.1. Adaptive convergence in Squalius aradensis and Squalius pyrenaicus from Almargem basin ... 31
5. Final Remarks... 33
References ... 34
VII
List of Tables and Figures
Figure 1.1. Overview of the core circadian system and output pathways [adapted from (Dunlap 1999)] ... 2 Figure 1.2. Spatial distribution of the four Portuguese Squalius species. Sampling sites are marked with red triangles: Mondego basin (1, Sótão river); Tagus basin (2, Ocreza river); Almargem basin (3, Almargem stream); Mira basin (4, Torgal stream); Arade basin (5, Odelouca stream). ... 5 Figure 3.1. A phylogenetic tree constructed by the Bayesian Inference method for CRY proteins with fly CRY as outgroup using the LG substitution model (Le & Gascuel 2008) with a discrete Gamma distribution (+G) with 5 rate categories. Values on branch nodes represent Bayesian posterior probabilities. Sc, Squalius carolitertii; SpT, Squalius pyrenaicus (Tagus population); St, Squalius torgalensis; Sa, Squalius aradensis; SpA, Squalius pyrenaicus (Almargem population); Dr, Danio rerio; Dm, Drosophila melanogaster. ... 11 Figure 3.2. Schematic diagrams of the full length Squalius CRY1AA, CRY1AB, CRY1BA,
CRY1BB, CRY2, and CRY3 proteins. In orange is represented the photolyase-like domain (PHR) and in green is represented the FAD-binding domain. Red dots represent sites under episodic positive selection and dots in grey represent sites under negative selection. ... 13 Figure 3.3. A phylogenetic tree constructed by the Bayesian Inference method for PER proteins with fly PER as outgroup using the JTT substitution model (Jones et al. 1992) with empirical amino acid frequencies from the data (+F). Values on branch nodes represent Bayesian posterior probabilities. Sc, Squalius carolitertii; SpT, Squalius pyrenaicus (Tagus population); St, Squalius torgalensis; Sa, Squalius aradensis; SpA, Squalius pyrenaicus (Almargem population); Dr, Danio rerio; Dm,
Drosophila melanogaster. ... 15 Figure 3.4. Schematic diagrams of the full length Squalius PER1A, PER1B, PER2 and PER3 proteins. In orange is represented the Period-Arnt-Sim (PAS_3/11) domain and in green the Period protein 2/3C-terminal region domain. Red dots represent sites under episodic positive selection and dots in grey represent sites under negative selection. ... 18 Figure 3.5. A phylogenetic tree constructed by the Bayesian Inference method for CLOCK proteins with fly CLOCK as outgroup using JTT substitution model (Jones et al. 1992) with empirical amino acid frequency (+F) using a discrete Gamma distribution (+G) with 5 rate categories. Values on branch nodes represent Bayesian posterior probabilities. Sc, Squalius carolitertii; SpT, Squalius pyrenaicus (Tagus population); St, Squalius torgalensis; Sa, Squalius aradensis; SpA, Squalius pyrenaicus
(Almargem population); Dr, Danio rerio; Dm, Drosophila melanogaster... 19 Figure 3.6. Schematic diagrams of the full length Squalius A) CLOCKA, and B) CLOCKB proteins. In orange is represented the basic helix-loop-helix (bHLH) motif, in green is represented the PAS fold domain and in blue is represented the Period-Arnt-Sim (PAS_11). Dots in grey represent sites under negative selection. ... 21 Figure 3.7. A phylogenetic tree constructed by the Bayesian Inference method for BMAL proteins with fly CYCLE protein as outgroup using JTT substitution model (Jones et al. 1992) using a discrete Gamma distribution (+G) with 3 rate categories. Values on branch nodes represent Bayesian posterior probabilities. Sc, Squalius carolitertii; SpT, Squalius pyrenaicus (Tagus population); St, Squalius torgalensis; Sa, Squalius aradensis; SpA, Squalius pyrenaicus (Almargem population); Dr, Danio rerio; Dm, Drosophila melanogaster. ... 22
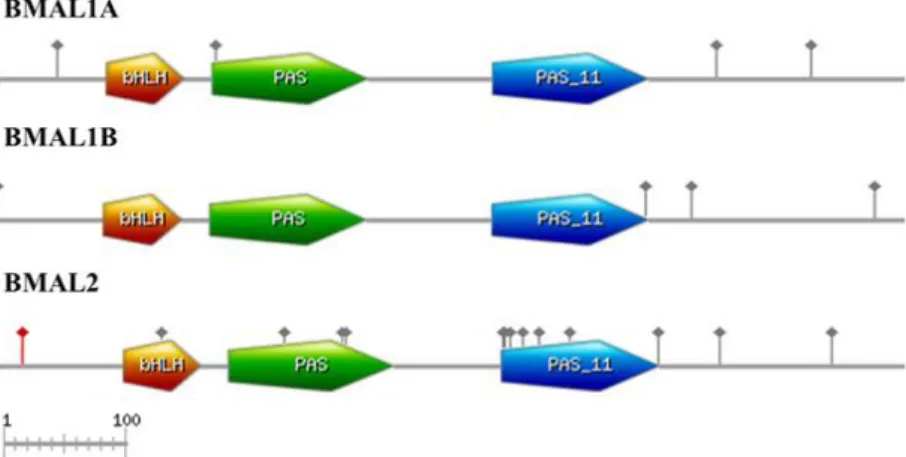
VIII Figure 3.8. Schematic diagrams of the full length Squalius BMAL1A, BMAL1B, and BMAL2
proteins. In orange is represented the basic helix-loop-helix (bHLH) motif, in green is represented the PAS fold domain and in blue is represented the Period-Arnt-Sim (PAS_11). Red dots represent sites under episodic positive selection and dots in grey represent sites under negative selection. ... 24 Figure 3.9. A phylogenetic tree constructed by the Bayesian Inference method for TIMELESS protein with D. rerio TIMELESS protein as outgroup and based on the JTT substitution model (Jones et al. 1992) with empirical amino acid frequency (+F). Values on branch nodes represent Bayesian posterior probabilities. Sc, Squalius carolitertii; SpT, Squalius pyrenaicus (Tagus population); St, Squalius torgalensis; Sa, Squalius aradensis; SpA, Squalius pyrenaicus (Almargem population); Dr, Danio rerio. ... 25 Figure 3.10. Schematic diagrams of the full length Squalius TIMELESS protein. In orange is
represented the TIMELESS domain and in green is represented the Timeless protein C terminal region. Red dots represent sites under episodic positive selection and dots in grey represent sites under negative selection. ... 26 Figure S1. Predicted CRY1AA physicochemical parameters. Each bar represents the mean values for each parameter of each population and error bars represent standard error. * p<0.05; ** p<0.01; *** p<0.001. ... 58 Figure S2. Predicted CRY1AB physicochemical parameters. Each bar represents the mean values for each parameter of each population and error bars represent standard error. * p<0.05; ** p<0.01; *** p<0.001. ... 58 Figure S3. Predicted CRY1BA physicochemical parameters. Each bar represents the mean values for each parameter of each population and error bars represent standard error. * p<0.05; ** p<0.01; *** p<0.001. ... 58 Figure S4. Predicted CRY1BB physicochemical parameters. Each bar represents the mean values for each parameter of each population and error bars represent standard error. * p<0.05; ** p<0.01; *** p<0.001. ... 59 Figure S5. Predicted CRY2 physicochemical parameters. Each bar represents the mean values for each parameter of each population and error bars represent standard error. * p<0.05; ** p<0.01; *** p<0.001. ... 59 Figure S6. Predicted CRY3 physicochemical parameters. Each bar represents the mean values for each parameter of each population and error bars represent standard error. * p<0.05; ** p<0.01; *** p<0.001. ... 59 Figure S7. Predicted PER1A physicochemical parameters. Each bar represents the mean values for each parameter of each population and error bars represent standard error. * p<0.05; ** p<0.01; *** p<0.001. ... 60 Figure S8. Predicted PER1B physicochemical parameters. Each bar represents the mean values for each parameter of each population and error bars represent standard error. * p<0.05; ** p<0.01; *** p<0.001. ... 60 Figure S9. Predicted PER2 physicochemical parameters. Each bar represents the mean values for each parameter of each population and error bars represent standard error. * p<0.05; ** p<0.01; ***
IX Figure S10. Predicted PER3 physicochemical parameters. Each bar represents the mean values for each parameter of each population and error bars represent standard error. * p<0.05; ** p<0.01; *** p<0.001. ... 61 Figure S11. Predicted CLOCKA physicochemical parameters. Each bar represents the mean values for each parameter of each population and error bars represent standard error. * p<0.05; ** p<0.01; *** p<0.001. ... 61 Figure S12. Predicted CLOCKB physicochemical parameters. Each bar represents the mean values for each parameter of each population and error bars represent standard error. * p<0.05; ** p<0.01; *** p<0.001. ... 61 Figure S13. Predicted BMAL1A physicochemical parameters. Each bar represents the mean values for each parameter of each population and error bars represent standard error. * p<0.05; ** p<0.01; *** p<0.001. ... 62 Figure S14. Predicted BMAL1B physicochemical parameters. Each bar represents the mean values for each parameter of each population and error bars represent standard error. * p<0.05; ** p<0.01; *** p<0.001. ... 62 Figure S15. Predicted BMAL2 physicochemical parameters. Each bar represents the mean values for each parameter of each population and error bars represent standard error. * p<0.05; ** p<0.01; *** p<0.001. ... 62 Figure S16. Predicted TIMELESS physicochemical parameters. Each bar represents the mean values for each parameter of each population and error bars represent standard error. * p<0.05; ** p<0.01; *** p<0.001. ... 63
Table 3.1. Cryptochrome genes identified with respective annotations obtained in functional annotation analysis. ENA accession numbers are for Squalius sequences obtained by Sanger
sequencing in this work ... 10 Table 3.2. Analysis of gene-wide positive selection in cry genes using the BUSTED method
implemented in Datamonkey webserver. A threshold of 0.1 was used for statistical significance. ... 12 Table 3.3. Period genes identified with respective annotations obtained in functional annotation analysis. ENA accession numbers are for Squalius sequences obtained by Sanger sequencing in this work ... 14 Table 3.4. Summary of gene-wide positive selection analysis in per genes using the BUSTED method implemented in Datamonkey webserver. A threshold of 0.1 was used for statistical significance. Rows shaded in grey correspond to genes whose test for positive selection was statically significant. ... 16 Table 3.5. Summary of branch-site positive selection analysis in per genes using the aBSREL method implemented in Datamonkey webserver. A threshold of 0.1 was used for statistical significance. Rows shaded in grey correspond results whose test for positive selection was statically significant. ... 16 Table 3.6. Clock genes identified with respective annotations obtained in functional annotation
analysis. ENA accession numbers are for Squalius sequences obtained by Sanger sequencing in this work ... 18 Table 3.7. Summary of gene-wide positive selection analysis in clock genes using the BUSTED method implemented in Datamonkey webserver. A threshold of 0.1 was used for statistical
X significance. Rows shaded in grey correspond to genes whose test for positive selection was statically significant. ... 19 Table 3.8. Summary of branch-site positive selection analysis in clock genes using the aBSREL method implemented in Datamonkey webserver. A threshold of 0.1 was used for statistical
significance. Rows shaded in grey correspond results whose test for positive selection was statically significant. ... 20 Table 3.9. Bmal genes identified with respective annotations obtained in functional annotation
analysis. ENA accession numbers are for Squalius sequences obtained by Sanger sequencing in this work ... 21 Table 3.10. Summary of gene-wide positive selection analysis in bmal genes using the BUSTED method implemented in Datamonkey webserver. A threshold of 0.1 was used for statistical
significance. Rows shaded in grey correspond to genes whose test for positive selection was statically significant. ... 23 Table 3.11. Summary of branch-site positive selection analysis in clock genes using the aBSREL method implemented in Datamonkey webserver. A threshold of 0.1 was used for statistical
significance. Rows shaded in grey correspond results whose test for positive selection was statically significant. ... 23 Table 3.12. Timeless gene identified with respective annotations obtained in functional annotation analysis. ENA accession numbers are for Squalius sequences obtained by Sanger sequencing in this work ... 24 Table 3.13. Summary of gene-wide positive selection analysis in timeless gene using the BUSTED method implemented in Datamonkey webserver. A threshold of 0.1 was used for statistical
significance. Rows shaded in grey correspond to genes whose test for positive selection was statically significant. ... 25 Table 3.14. Summary of branch-site positive selection analysis in timeless gene using the aBSREL method implemented in Datamonkey webserver. A threshold of 0.1 was used for statistical
significance. Rows shaded in grey correspond results whose test for positive selection was statically significant. ... 25 Table S1. Environmental conditions observed for each basin between 2001 and 2016. Temperature and pH data were obtained from snirh.pt (National Information System of Water Resources) and number of daylight hours was obtained from Time and Date AS (timeanddate.com; accessed in June 2018)... 40 Table S2. List of Danio rerio Uniprot accession ID for target proteins and ENA accession IDs for corresponding coding genes. ... 40 Table S3. List of primer pairs used in PCR to re-sequence circadian-related genes with Sanger method in Squalius species. ... 41 Table S4. PCR conditions for each pair of primers used in amplification of circadian-related genes. 42 Table S5. List of Drosophila melanogaster Uniprot accession ID for protein sequences used as
outgroup in phylogenetic analysis and ENA accession IDs for corresponding coding genes. ... 43 Table S6. Description and biological relevance of physicochemical parameters of proteins analysed 43 Table S7. Summary of the results obtained by MEME analysis for episodic positive selection. A threshold of 0.1 was assumed for significance level. The type of mutation was inferred by analysing
XI the physicochemical properties of the amino acids substituted and the ancestral form was inferred from zebrafish amino acid at that position. ... 44 Table S8. Summary of the results obtained by FEL analysis for pervasive negative selection in coding genes for CRY proteins. A threshold of 0.1 was assumed for significance level... 44 Table S9. Analysis of patters of post-translational modifications for CRY proteins. Rows shaded in grey correspond to PTMs with modifications in studied populations. ... 46 Table S10. Patterns of protein-protein interactions for CRY protein predicted with STRING with a threshold of 0.7 for score. Rows shaded in grey correspond to circadian-related proteins studied here; in orange are highlighted proteins related to temperature responses; in blue are highlighted putative circadian proteins with secondary functions ... 47 Table S11. Summary of the results obtained by FEL analysis for pervasive negative selection in coding genes of PER proteins. A threshold of 0.1 was assumed for significance level. ... 49 Table S12. Analysis of patters of post-translational modifications for PER proteins. Rows shaded in grey correspond to PTMs with modifications in studied populations. ... 51 Table S13. Patterns of protein-protein interactions for PER proteins predicted with STRING with a threshold of 0.7 for score. Rows shaded in grey correspond to circadian-related proteins studied here; in orange are highlighted protein related to temperature responses; in blue are highlighted putative circadian proteins with secondary functions ... 52 Table S14. Summary of the results obtained by FEL analysis for pervasive negative selection in coding genes of CLOCK proteins. A threshold of 0.1 was assumed for significance level. ... 53 Table S15. Analysis of patters of post-translational modifications for CLOCK proteins. Rows shaded in grey correspond to PTMs with modifications in studied populations. ... 54 Table S16. Patterns of protein-protein interactions for CLOCK proteins predicted with STRING with a threshold of 0.7 for score. Rows shaded in grey correspond to circadian-related proteins studied here. ... 54 Table S17. Summary of the results obtained by FEL analysis for pervasive negative selection in coding genes of BMAL proteins. A threshold of 0.1 was assumed for significance level. ... 55 Table S18. Analysis of patters of post-translational modifications for BMAL proteins. Rows shaded in grey correspond to PTMs with modifications in studied populations. ... 55 Table S19. Patterns of protein-protein interactions for BMAL proteins predicted with STRING with a threshold of 0.7 for score. Rows shaded in grey correspond to circadian-related proteins studied here; in blue are highlighted putative circadian proteins with secondary functions... 56 Table S20. Summary of the results obtained by FEL analysis for pervasive negative selection in coding gene of TIMELESS protein. A threshold of 0.1 was assumed for significance level. ... 56 Table S21. Analysis of patters of post-translational modifications for TIMELESS protein. Rows shaded in grey correspond to PTMs with modifications in studied populations. ... 57 Table S22. Patterns of protein-protein interactions for TIMELESS protein predicted with STRING with a threshold of 0.7 for score. Rows shaded in grey correspond to circadian-related proteins studied here; in green are highlighted proteins related with cell cycle regulation. ... 57
XII
List of Abbreviations
bHLH – basic helix-loop-helix
BLAST – Basic local alignment search tool
BMAL – Brain and Muscle ARNT (Aryl hydrocarbon Receptor Nuclear Translocator)-Like cDNA – Complementary deoxyribonucleic acid.
CLOCK – Circadian locomotor output cycles protein kaput CRY – Cryptochrome
DNA – Deoxyribonucleic acid GO – Gene ontology
HSF – Heat shock factor HSP – Heat shock protein KW – Kruskal-Wallis
PAS - Period-Aryl hydrocarbon receptor nuclear translocator- Single mind domain PCR – Polymerase chain reaction
pI – Isoelectric point PER – Period
PPI – Protein-protein interaction PTM – Post-translational modification RNA – Ribonucleic acid
1
1. Introduction
Organisms are exposed to daily fluctuations in their natural environment. To overcome environmental fluctuations, organisms developed biological timing systems to optimize their physiological and biochemical processes in space and time (Foulkes et al. 2016). These systems work as internal clocks and require a proper synchronization with environmental signals that specify the actual time of the day.
The circadian system is a universal biological timing system found virtually in all organisms (Paranjpe & Sharma 2005). Circadian system is synchronised by light–dark cycle of a day’s period and present oscillations with a period of ~24h called circadian rhythms. Oscillations are generated and regulated at molecular level, but the outcomes have been shown to influence several aspects of physiology, behaviour and ecology of organisms (Paranjpe & Sharma 2005; Vaze & Sharma 2013). In fact, circadian rhythms, when properly entrained by light, improve the inherent aptitude of organisms to survive under ever-changing environments by aiding them to efficiently anticipate periodic events, specifically light changes and climate seasons (Paranjpe & Sharma 2005; Vaze & Sharma 2013).
The molecular circadian system consists of a network of signalling transduction pathways regulated mainly by interconnected transcription-translation feedback loops (Figure 1.1) (Dunlap 1999; Pando & Sassone-Corsi 2002). The regulatory loops are sustained by the so-called core circadian genes and proteins and require about 24h to complete a cycle (Pando & Sassone-Corsi 2002; Foulkes et al. 2016). In vertebrates, several genes have been reported to be responsible for the maintenance and regulation of the circadian system (Foulkes et al. 2016). The core circadian-genes belong to four main gene families: Cryptochromes (CRY), Period (PER), CLOCK, and BMAL (Pando & Sassone-Corsi 2002). These gene families encompass several characterized genes (cry, per, bmal and clock) in vertebrates, namely in fish for which these families possess a larger number of circadian paralogs as compared to the other vertebrates (Toloza-Villalobos et al. 2015). In Danio rerio, there have been identified six cry genes (cry1aa, cry1ab, cry1ba, cry1bb, cry2, cry3), four per genes (per1a,
per1b, per2, per3), three bmal genes (bmal1a, bmal1b, bmal2) and, three clock genes (clocka, clockb, clock2) (Wang 2008a, 2008b, 2009; Liu et al. 2015). Cryptochrome genes encode for a class of
flavoproteins that are sensitive to blue light (Lin & Todo 2005) and the period genes encode for proteins that also display a strong but differential light responsiveness (Pando et al. 2001; Vatine et al. 2009; Vallone et al. 2004). They were found to be key agents in the entrainment of the circadian system, as they are photoreceptors responsible for transducing light signals to the core circadian machinery (Tamai et al. 2007). BMAL (Brain and muscle ARNT like) and CLOCK (Circadian locomotor output cycle kaput) families encode for canonical circadian proteins, a highly conserved bHLH (basic-Helix-Loop-Helix)-PAS (Period-Aryl hydrocarbon receptor nuclear translocator- Single mind) transcriptional factors and are the positive elements of the circadian system (Pando & Sassone-Corsi 2002; Foulkes et al. 2016).
In vertebrates, the whole network starts with the proteins CLOCK and BMAL. These act as heterodimers CLOCK:BMAL and bind to E-box enhancer elements in DNA to trigger transcription of target genes (Pando & Sassone-Corsi 2002; Foulkes et al. 2016). E-box enhancers are present in promoter regions of a vast spectrum of genes including the negative elements of the network, per and
cry genes (Nakahata et al. 2008). After activation of per and cry transcription and subsequently
2 PER:CRY which interacts with the CLOCK:BMAL heterodimers to inhibit their function and thereby downregulating expression of E-box-dependent genes (Ishikawa et al. 2002; Pando & Sassone-Corsi 2002). Hereafter, there is a reduction in the expression of per and cry, and levels of the negative elements drop. When PER and CRY proteins are reduced to critical levels, CLOCK and BMAL become again able to bind E-box elements and activate expression of these genes and the cycle is repeated (Reppert & Weaver 2001; Pando & Sassone-Corsi 2002). This loop of activation/repression takes ~24h to complete one cycle and it has been described as the fundamental molecular source of circadian rhythmicity (Reppert & Weaver 2001; Pando & Sassone-Corsi 2002). In addition, bmal genes are regulated and rhythmically expressed under the control of another feedback loop involving two orphan nuclear receptors, REV-ERBα and RORα (Preitner et al. 2002). Even though REV-ERBα and RORα regulate bmal expression, they are not considered to belong to the core-circadian apparatus. Lastly, timeless gene was described as having a possible role on circadian regulation in vertebrates (Barnes et al. 2003; Gotter 2006; Yoshizawa-Sugata & Masai 2007). Although its function has been widely described for several invertebrates (e.g. Drosophila melanogaster), there is a lack of information concerning its role in the circadian system of vertebrates, including for fish (Gotter 2006). Several authors hypothesize timeless function may mainly connected with the CRY/PER feedback loop, with TIMELESS protein serving as potential alternative to the PER protein in the negative phase of the cycle, as it happens in Drosophila circadian system (Gotter 2006). To complete the circadian regulatory network, further layers of regulation are provided by transcriptional and post-translational modifications (McClung 2011; Lim & Allada 2013), epigenetic regulation, and metabolic networks (Asher & Sassone-Corsi 2015). They allow to reinforce the core feedback loops and to increase their robustness.
3 As previously stated, light is crucial for circadian system and organisms possess photoreceptor proteins (CRY and PER) that perceive the light-dark changes and properly generate input pathways to transduce the signal to the circadian core (Vallone et al. 2004; Tamai et al. 2007; Vatine et al. 2009). Two studies in zebrafish characterized a light-induced transcriptome and revealed several genes whose expression depends on light, revealing a multi-level regulation of circadian rhythms by light-cycles (Weger et al. 2011; Ben-Moshe et al. 2014). This light-dependence was also recently shown for the Atlantic cod Gadus morhua (Lazado et al. 2014). The molecular explanation remains in light-induced
cry1aa and per2 circadian genes that encode for negative core elements of the circadian
transcription-translation loop with CRY1AA acting as a direct inhibitor of CLOCK:BMAL activation via preventing heterodimer formation (Ishikawa et al. 2002; Tamai et al. 2007) while PER2 plays a more complex role as either transcriptional coactivator or corepressor depending on its transcriptional regulatory targets (Wang et al. 2015). Photoreception is particularly interesting in fish as they exhibit several adaptations for this mechanism. Contrary to most vertebrates which only perceive light through the eyes, fish also possess a photosensitive pineal gland, dermal melanophores, and brain photoreceptors (Foulkes et al. 2016). In addition, fish possess independent peripheral photoreceptors and self-sustaining circadian oscillators, essentially in every tissue (Whitmore et al. 1998). Moreover, tissue and cell culture studies in zebrafish showed these peripheral clocks are directly entrained by light (Whitmore et al. 1998).
Circadian rhythms can also be entrained by temperature (Liu et al. 1998; Tsuchiya et al. 2003; Lahiri et al. 2005; Chappuis et al. 2013; Jerônimo et al. 2017). In mammals it was demonstrated that peripheral cells in vitro could sense the change of room temperature as a cue for entrainment of circadian system (Tsuchiya et al. 2003). In zebrafish, temperature has also an important role in circadian clock (Lahiri et al. 2005; Jerônimo et al. 2017), and it was proposed that temperature could entrain the phase of the system by driving expression levels of per3, and other clock genes (namely
cry2 and cry1ba) via an alternative hypothetical enhancer upstream the E-box (Lahiri et al. 2005). In
this model, per1b (formerly known as per4) promoter integrates temperature and light regulatory input from the E- boxes together with regulation by other temperature-driven elements (Lahiri et al. 2005). Recently, it was found in a transcriptome profiling of two Iberian freshwater fish (Squalius carolitertii and S. torgalensis) two differentially expressed genes (cry1aa and per1a) between a control condition and a thermal stress condition (Jesus et al. 2016). Subsequent studies with the mentioned genes reinforced the dependence on temperature for proper entrainment of the circadian system in these species by showing a response in expression of cry1aa and per1a genes in S. carolitertii when subjected to a simulated scenario of moderate climate change (Jesus et al. 2017). Other studies connected the circadian system with stress response through a network involving heat-shock proteins (HSP). When exposed to thermal stress organisms increase up to 10% the expression of HSPs (Söti et al. 2005). This activation is related to heat-shock factors (HSFs) that bind regions in the DNA called heat-shock elements (HSE). In normal situations, HSP90 binds HSF1 and prevents its migration for the nucleus, but in thermal stress, these two proteins dissociate and HSF1 is free to migrate to the nucleus and binds to HSE sequence. It was demonstrated that this pathway can affect the expression of
per2 in mammals as this gene possesses in its promoter a heat-shock element (HSE) sequence
(Kornmann et al. 2007; Tamaru et al. 2011; Chappuis et al. 2013). Other authors studying this same relation in zebrafish hypothesize that HSF1 activation is related to circadian regulation in at least two ways: (1) HSP activation improves the ability of the organism to deal with thermal stress, but HSP also interacts with BMAL1 to maintain the optimal function of the circadian system and (2) HSF1
4 activates other circadian-related genes as per2 that may result in synchronization of the circadian machinery and maintain the outputs of the circadian system fully functional (Jerônimo et al. 2017). In the same work, Jerônimo et al. (2017) identified the channel TRPV1 (Transient receptor potential cation channel subfamily V member 1), a thermo-sensitive receptor, as an integrant part of zebrafish circadian rhythm by playing a role in heat-mediated hsp90 and per2 responses. By blocking the channel with a TRPV1 inhibitor, the authors demonstrated that even though hsp90 expression was unaffected, per2 expression was partially downregulated (Jerônimo et al. 2017).
Several studies have been conducted to understand the circadian system at its different levels of organization. In fish, these studies are particularly interesting once they are a very diverse group of animals adapted to nearly all aquatic environments and possess a larger number of circadian paralogs as compared to the other vertebrates (Toloza-Villalobos et al. 2015). Some of these studies cover the evolutionary relationships of the core-clock gene families and the mechanisms driving their molecular evolution (Wang 2008a, 2008b, 2009; Liu et al. 2015), but several key questions are still opened, namely the reason for the preservation of these higher number of paralogs when compared to other vertebrates (Toloza-Villalobos et al. 2015). Toloza-Villalobos et al. (2015) described the possible evolutionary history of circadian-related gene families and pointed to a possible event of subfunctionalization among per genes. Even though neofunctionalization was been a widely assumed fate for these duplicated circadian-related genes during evolution, there are still some opened questions concerning the mechanisms driving molecular evolution in these gene families, which is clearly noted in functional analysis as several of the paralogs retain ancestral functions creating a redundant pool of circadian genes.
The genus Squalius Bonaparte, 1837 is represented in Portuguese rivers by four known species (S. carolitertii, S. pyrenaicus, S. torgalensis and S. aradensis) distributed across a latitudinal cline (Figure 1.2). S. carolitertii (Doadrio, 1988) inhabits the northern rivers of Portugal, S. pyrenaicus (Günther 1868) occurs in the Central and Southern drainages (e.g. Tagus and Almargem), while sister species S. torgalensis and S. aradensis (Coelho et al. 1998) are confined to small basins in the Southwest of Portugal. This distribution gains special interest from an evolutionary perspective since Portugal is at the frontier between two contrasting climate types: the Atlantic in the Northern region that is characterized by mild temperatures, and the Mediterranean in the Southern region typified by high temperatures and droughts (Table S1). The photoperiod is also variable along this latitudinal cline, and typically daytime is longer in southern region of Portugal for about 10 to 15 minutes when compared to the northern region. Moreover, these basins present differences in water pH, as southern basins are typically more alkaline than northern ones (Table S1). These environmental differences associated to distribution of Squalius species turn them into an excellent model to study evolutionary adaptation to different environmental backgrounds, in particular for studying adaptation of the circadian system to different environmental conditions of light and temperature.
5 Figure 1.2. Spatial distribution of the four Portuguese Squalius species. Sampling sites are marked with red triangles: Mondego basin (1, Sótão river); Tagus basin (2, Ocreza river); Almargem basin (3, Almargem stream); Mira basin (4, Torgal stream); Arade basin (5, Odelouca stream).
Here we present an integrative study on molecular evolution of circadian system in Portuguese
Squalius species. Transcriptomes of S. carolitertii and S. torgalensis previously published (Jesus et al.
2015) allowed the identification of circadian-related genes in these species by comparing them with transcriptomes of the reference organism Danio rerio. Phylogenetic analysis of gene families was performed using predicted protein sequences to elucidate evolutionary history of these families in the four species according the environmental gradient. Models to predict protein-protein interactions were used to investigate possible modifications in the function of duplicated genes and to provide insights on the fate of these duplications. Patterns of adaptation to the environmental conditions were studied using statistical tests to detect signatures of selection. However, as these tests do not have enough statistical power to detect all signatures of selection and do not identify impact of positively selected mutations in protein function, functional and structural features of the predicted proteins were inferred and compared between populations to better describe the mechanisms of adaptation of Squalius to the environmental cline of light and temperature. Specifically, physicochemical parameters as isoelectric point, instability and aliphatic index (see Table S6 for biological relevance), together with domains and post-translational modifications were predicted. Additionally, we characterised some features of TIMELESS in Squalius species, namely protein-protein interactions and family assignment using hidden-Markov models, with the purpose of providing insights on its function and clarify its relationship with circadian system.
6
2. Materials and Methods
2.1. Sampling
Muscle tissue from five wild adult fish of S. carolitertii and S. torgalensis species was already stored at -80ºC in RNAlater® (Ambion, Austin, TX, USA) from previous work (Jesus et al. 2017). They were sampled in Portuguese basins Mondego (40˚8’5.22"N; 8˚8’35.06"W) and Mira (37˚38'1.31"N; 8˚37’22.37"W), respectively. Samples of S. pyrenaicus were also stored at -80ºC from previous projects. This work includes two sampling sites: Almargem (37°09'50.7"N; 7°37'13.2"W) (Machado et al. 2016) and Tagus (39°43'48.2"N; 7°45'38.1"W) (Matos et al. 2016).
Squalius aradensis individuals were captured from Portuguese basin Arade (37º17'0.53''N;
8º29'7.31''W) under the license 421/2017/CAPT issued by Portuguese authority for Conservation of endangered species [ICNF (Instituto da Conservação da Natureza e das Florestas)]. After capturing, the specimens were transported alive to the laboratory in aerated containers and sacrificed upon arrival with an overdose of tricaine mesylate (400 ppm of MS-222; Sigma-Aldrich, St. Louis, MO, USA) with sodium bicarbonate (1:2) following the recommended ethical guidelines (ASAB/ABS, 2012) and European Union regulations. Efforts were made to minimize fish discomfort. Organs were stored in RNAlater® at -80ºC until further use. Distribution of the species and sampling sites are illustrated in Figure 1.2.
An environmental characterisation was done for each sampling site. Average water temperature and pH between 2001 and 2016 were retrieved from SNIRH [snirh.pt (National Information System of Water Resources); accessed in June 2018] and number of daylight hours was retrieved from Time and Date AS (timeanddate.com; accessed in June 2018). The data is summarised in table S1.
2.2. Identification of circadian system related genes in Iberian freshwater fish
Transcriptomes of S. torgalensis and S. carolitertii, already available and published (Jesus et al. 2015), were used to identify the circadian related genes in the study species. BLAST searches of both transcriptomes were conducted against two Danio rerio light-induced transcriptomes (Weger et al. 2011; Ben-Moshe et al. 2014) to identify potential genes related to the circadian system. An e-value threshold of 1×10⁻⁷ was used during the BLAST searches and only sequences with identity higher than
85% were retrieved to avoid the use of different duplicates or splicing isoforms. These light-responsive genes include several genes already characterised as components of the circadian system, but also several uncharacterised genes or genes unrelated to the circadian system. Due to this problem, and to avoid any false positive, an analysis of functional enrichment was accomplished. For this, a list of Danio rerio ENA accession numbers from the top blast results mentioned above was used to perform the enrichment analysis in DAVID functional annotation tool (Huang et al. 2007). An EASE score <0.05, a statistical test to examine the significance of gene–term enrichment with a modified Fisher's exact test, was used for all functional analyses performed in DAVID. Through this methodology we were able to find enriched GO terms among the genes retrieved. The most significant enriched GO terms for Biological Process and Molecular Function were filtered, first by rejecting all the genes with function unrelated to the circadian system, and among the circadian related genes using a threshold for adjusted p-values (Benjamini) of 0.05 to remove false positives. From the final list of genes only protein-coding genes whose function was related to the core circadian mechanism were maintained for further analysis (Table S2).
7
2.3. Gene sequencing and protein sequence prediction
Based on sequences retrieved from the transcriptomes, specific primers for Polymerase chain reactions (PCRs) were designed using PerlPrimer software v.1.1.19 (Marshall 2004) (Table S3) with the purpose of amplifying the same genes for all the studied species.
Total RNA was extracted from muscle samples of 25 individuals, 5 from each population. 1 mL TRI Reagent (Ambion, Austin, TX, USA) was added to 50–100 mg of muscle samples and, after homogenization with Tissue Ruptor (Qiagen, Valencia, CA, USA), RNA was extracted according to the TRI Reagent manufacturers protocol. TURBO DNase (Ambion, Austin, TX, USA) was employed to degrade any remaining genomic contaminants, followed by phenol/chloroform purification and LiCl precipitation (Cathala et al. 1983). Sample quality was checked using a NanoDrop™-1000 spectrophotometer (Thermo Fisher Scientific, Waltham, MA, USA) based on the 260nm/280nm and 260nm/230nm absorbance ratios. Samples concentration were determined with Qubit® 2.0 Fluorometer (Thermo Fisher Scientific, Waltham, MA, USA) to ensure enough quantity of homogeneous RNA for cDNA synthesis. Synthesis of cDNA was performed, according to manufacturer’s protocol, using a RevertAid H Minus First Strand cDNA synthesis kit (Thermo Fisher Scientific, Waltham, MA, USA) and stored subsequently at -20˚C until further use. PCRs were performed in 25 μL reactions containing 10–100 ng of cDNA, 2 mM MgCl2, 2 mM each dNTP, 10
μM each primer, Taq Polymerase (5 U/μL), and 1x Taq buffer using the thermocycler conditions described in Table S4. PCR products were confirmed using a 1% agarose gel electrophoresis, and after purification with ExoSAP-IT® PCR Product Cleanup (Affymetrix, Inc., Santa Clara, CA, USA), they were sequenced by Sanger sequencing.
Sequences were aligned and edited using Sequencher v.4.2 (Gene Codes Corp., Ann Arbor, MI, USA). Nucleotide sequences were deposited in European Nucleotide Archive (ENA) database under the accession numbers available in Tables 3.1, 3.3, 3.6, 3.9 and 3.12. CLC Sequence Viewer v.7.5. (CLC bio, Aarhus, Denmark) was used to predict protein sequences for in silico analysis. BLAST searches were conducted with resulting protein sequences against UniProt database (The UniProt Consortium 2015) to ensure their reliability. Protein sequences for Danio rerio were retrieved from UniProt database for each protein (Table S2), as well as Drosophila melanogaster homolog sequence for each gene family (Table S5). Protein sequences were aligned by gene family using the M-Coffee method, that combines several alignment algorithms (eg. MUSCLE, MAFFT and CLUSTAL) (Wallace et al. 2006) available in the T-Coffee web server (Di Tommaso et al. 2011). For each individual gene, nucleotide sequences of Squalius species were also aligned using M-Coffee.
2.4. Phylogenetic analysis
The most appropriate model for amino acid substitution for each data sets was determined with ProtTest v.3.0 (Abascal et al. 2005; Darriba et al. 2011), for both based on the Akaike information criteria and Bayesian information criteria. Phylogenetic trees were reconstructed for each gene family independently using Bayesian Inference method as implemented in MrBayes v.3.2.6 (Huelsenbeck & Ronquist 2001; Ronquist et al. 2012) using D. melanogaster protein sequences as outgroup. For
timeless gene, a phylogenetic analysis was also done using the mentioned approach but using Danio rerio as outgroup. 500,000 generations of Monte Carlo Markov Chain (MCMC) were run using as
8 priors the parameters determined in ProtTest for protein sequences. Trees were sampled every 500 generations during the analysis. The first 50,000 generations were excluded as burn-in after examining the variation in log-likelihood scores over time. Phylogenetic trees were constructed using protein sequences instead of nucleotide sequences to avoid bias from the third codon rapid evolution. Protein sequences used correspond to the direct translation of nucleotide sequences under the standard genetic code. All trees were edited in FigTree v1.4.2 (A. Rambaut, University of Edinburgh, UK; http://tree.bio.ed.ac.uk/software/figtree/).
2.5. Analysis of signatures of selection
Signatures of selection were examined based on the dN/dS (known as ω) statistics using four models implemented in HyPhy (Kosakovsky Pond et al. 2005) through the Datamonkey adaptive evolution webserver (Kosakovsky Pond & Frost 2005; Weaver et al. 2018 ; http://www.datamonkey.org/; accessed in August 2018), including (1) BUSTED (Branch-site Unrestricted Statistical Test for Episodic Diversification) (Murrell et al. 2015) that provides a gene-wide test for positive selection; (2) MEME (Mixed Effects Model of Evolution) (Murrell et al. 2012) a mixed-effects maximum likelihood approach to test the hypothesis that individual sites have been subject to episodic positive selection; (3) aBSREL (adaptive Branch-Site Random Effects Likelihood) (Kosakovsky Pond et al. 2011; Smith et al. 2015) for genes whose a signals of positive selection were detected with BUSTED or MEME, to test if positive selection has occurred on a proportion of branches; and (4) FEL (Fixed Effects Likelihood) (Kosakovsky Pond & Frost 2005b) that uses a maximum likelihood approach to infer nonsynonymous (dN) and synonymous (dS) substitution rates on a per-site basis for a given coding alignment and corresponding phylogeny and tests the hypothesis that individual sites have been subject to pervasive positive or negative selection.
2.6. Functional analysis and structural organisation of the predicted proteins
Homology methods available on several resources at the ExPASy Server (Gasteiger et al. 2005) were used to infer several properties of the proteins. Specifically, physicochemical parameters of the proteins were predicted using ProtParam (Gasteiger et al. 2005). Parameters estimated were isoelectric point (pI), instability and aliphatic index, and its biological significance is described in Table S6. Differences in physicochemical parameters were tested statistically in R v.3.2.3 (R Core Team 2015). Data was checked for normality (Shapiro-Wilk’s test). Due to lack of normality, a Kruskal-Wallis Rank Sum Test (KW) was performed to identify overall statistical differences in parameters across the populations. Pairwise Wilcoxon Rank Sum Tests were performed to compare the different groups and assess the origin of KW significance. Plots representing mean ± standard error for the five individuals per parameter and protein were constructed using the R package ggplot2 (Wickham 2016).
A sequence-based prediction of protein features (sequence domains and post-translational modification sites) was accomplished, using the online tool ScanProsite (de Castro et al. 2006 ; http://prosite.expasy.org/ accessed in March 2018) against the PROSITE database (Sigrist et al. 2002, 2013). Additional predictions of family assignment and sequence domains were accomplished using HMMER web server (Finn et al. 2011; Prakash et al. 2017; Potter et al. 2018 ; https://www.ebi.ac.uk/Tools/hmmer/) against Pfam (Finn et al. 2016), CATH-Gene3D (Dawson et al. 2017), TIGRFAMs (Haft et al. 2013), SUPERFAMILY (Oates et al. 2015) and PIRSF (Wu 2004) databases. These tools are mainly based on collections of Hidden-Markov Models to support the predictions (Eddy 1998, 2011). The number of predicted post-translational modification (PTM) sites
9 were compared between species for each protein to infer about possible modifications in protein regulatory mechanisms. Representative images of structural organization of domains and locations of sites under selection were created and edited in PROSITE tool MyDomains (Hulo et al. 2008).
Additionally, a sequence-based prediction of protein-protein interactions (PPI) was done using the online tool STRING (von Mering et al. 2003; Szklarczyk et al. 2015 ; https://string-db.org/cgi/input.pl accessed in August 2018). Interactors were predicted comparing Squalius predicted protein sequences against fish PPI databases using a threshold for score of 0.7.
10
3. Results
Analysis of S. torgalensis and S. carolitertii transcriptomes (Jesus et al. 2015) and comparison with light-induced zebrafish transcriptomes revealed four main gene families involved (Cryptochromes, Period, CLOCK and BMAL) in the circadian system, and one single-copy gene (timeless) whose main function was related to the circadian system. These gene families correspond to those already described for other fish species, specifically Danio rerio (Wang 2008a, 2008b, 2009; Liu et al. 2015). These identified genes were re-sequenced in S. torgalensis and S. carolitertii and sequenced de novo for S. pyrenaicus and S. aradensis. Non-redundant sequences were deposited in ENA under the accession numbers presented in Tables 3.1, 3.3, 3.6, 3.9 and 3.12. For CLOCK family we were unable to identify clock2 gene, previously characterized in other fish species, but identified two protein-coding genes (clocka and clockb). The most probable reason for this may be related to the lack of information in the transcriptome due to sequencing limitations or low expression levels of this gene in sequenced organs.
3.1. Evolution and characterisation of Cryptochrome Family
Six cry genes encoding for six proteins were identified (Table 3.1) and classified in three major groups (CRY1, CRY2 and CRY3) according to phylogenetic analysis (Figure 3.1). Among CRY1 group, four protein-coding genes were identified: cry1aa, cry1ab, cry1ba and cry1bb. CRY2 and CRY3 groups possess only one protein-coding gene each: cry2 and cry3, respectively. Phylogenetic analysis revealed a possible evolutionary convergence between S. aradensis and Almargem population of S.
pyrenaicus pointing to possible functional differences between the two populations of S. pyrenaicus
(Tagus and Almargem).
Table 3.1. Cryptochrome genes identified with respective annotations obtained in functional annotation analysis. ENA
accession numbers are for Squalius sequences obtained by Sanger sequencing in this work
Gene
symbol Gene name Biological process Molecular function
ENA accession
numbers · entrainment of circadian clock · protein binding
· response to light stimulus · negative regulation of transcription · response to hydrogen peroxide
cry1ab cryptochrome circadian
clock 1ab · negative regulation of transcription · non-annotated
LS999808 to LS999812 · response to light stimulus · non-annotated
· response to temperature stimulus · negative regulation of transcription
cry1bb cryptochrome circadian
clock 1bb · negative regulation of transcription · non-annotated
LS999818 to LS999822 · response to light stimulus · non-annotated
· response to temperature stimulus · negative regulation of transcription
cry3 cryptochrome circadian
clock 3 · signal transduction · photoreceptor activity
LS999671 to LS999675 Gene ontology annotation
cry1aa cryptochrome circadian
clock 1aa
LS999803 to LS999807
cry1ba cryptochrome circadian
clock 1ba
LS999813 to LS999817
cry2 cryptochrome circadian
clock 2
LS999666 to LS999670
11 Figure 3.1. A phylogenetic tree constructed by the Bayesian Inference method for CRY proteins with fly CRY as outgroup
using the LG substitution model (Le & Gascuel 2008) with a discrete Gamma distribution (+G) with 5 rate categories. Values on branch nodes represent Bayesian posterior probabilities. Sc, Squalius carolitertii; SpT, Squalius pyrenaicus (Tagus population); St, Squalius torgalensis; Sa, Squalius aradensis; SpA, Squalius pyrenaicus (Almargem population); Dr, Danio
rerio; Dm, Drosophila melanogaster.
For cry genes no signals of gene-wide positive selection were found. Even though some indications of gene-wide positive selection in cry1aa gene were found, these were not statistically significant. However, one site subjected to episodic positive selection in cry1aa gene was identified (Table S7). This site corresponds to a non-conservative non-synonymous mutation from a lysine to a glutamine (K275Q) in S. torgalensis and may have an impact in the overall charge of the protein due to a change from an uncharged to a charged amino acid. For all cry genes, several sites were found to be under pervasive negative selection (Table S8). Important to denote that several of these sites under negative selection are located inside functional domains of CRY proteins (Figure 3.2).
![Figure 1.1. Overview of the core circadian system and output pathways [adapted from (Dunlap 1999)]](https://thumb-eu.123doks.com/thumbv2/123dok_br/18189495.875237/16.892.167.726.668.985/figure-overview-core-circadian-output-pathways-adapted-dunlap.webp)