Dietary changes during the Great Recession in Portugal:
comparing the 2005/2006 and the 2014 health surveys
Ricardo Alves* and Julian Perelman
Escola Nacional de Saúde Pública, Centro de Investigação em Saúde Pública, Universidade NOVA de Lisboa, Av. Padre Cruz, Lisboa 1600–560, Portugal
Submitted 26 April 2018: Final revision received 30 November 2018: Accepted 21 December 2018 Abstract
Objective: We aimed at analysing changes in consumption of selected food groups in the Portuguese population before and after the Great Recession, which hit the country between 2008 and 2013.
Design: We used pooled cross-sectional data from the Portuguese National Health Interview Surveys of 2005/2006 and 2014. We modelled the probability of
consumption of soup, fish, meat, potatoes/rice/pasta, bread, legumes, fruit,
vegetables and sweets/desserts, as a function of the year, controlling for age, sex
and education, using logistic regressions. Then, we stratified the analysis by age
group and education level. Analyses were adjusted for survey weights. Setting: Portugal (2005/2006 to 2014).
Participants: Adults (n 43 273) aged 25–79 years.
Results: From 2005/2006 to 2014, there was a significantly lower consumption of
fish, soup, fruit and vegetables. Conversely, the consumption of legumes and
sweets/desserts was significantly higher in 2014. The changes in the selected food
groups were consistent across most education levels. Among people aged 65 years or above, there were no significant changes in most foods, except an increase in
the consumption of legumes and sweets/desserts. In contrast, people aged 25–39
and 40–64 years significantly decreased their intakes of fish and soup and increased their consumption of sweets/desserts.
Conclusions: The consistent results across education levels suggest that changes in
dietary habits are not linked to the economic downturn. By contrast, ourfindings
suggest a shift away from foods commonly linked to the Mediterranean diet, particularly among younger people.
Keywords Dietary habits Recession Mediterranean diet
Studies analysing the impact of economic recessions have shown a positive effect of weakened economic condition on some health risk behaviours. Unemploy-ment and the loss of income were observed, for exam-ple, to contribute to the reduction in alcohol and tobacco
consumption(1–4). However, the effect on eating
beha-viours is controversial and research on this topic has produced mixed results. Some evidence suggests that shorter working hours are associated with the reduction
of fast foods and prepared processed foods(5). During the
recent recession in the USA, evidence suggested that consumption of foods prepared away from home
declined and overall diet quality improved slightly(6).
Another recent study observed different results, stating that the high state-level unemployment had no sig-nificant impact on patterns of home food preparation and away-from-home eating, concluding that adults from low-income populations were resistant to food-related
behaviour change, even during major economic
recessions(7).
According to the Portuguese National Institute of Sta-tistics, the recent economic recession led to a steep increase in unemployment in Portugal, which almost
doubled between 2005 and 2014(8). This contributed to the
rise in rates of material deprivation† among the overall
population, and particularly among working-age
indivi-duals from 18 to 64 years old(8). In 2014, the prevalence of
individuals with some type of food insecurity reached nearly 46 % of the whole population. Of this group, about 16 % were considered as having either a moderate or
severe level of food insecurity(9). These data are especially
relevant considering that Portugal has one of the highest
ratios of income inequality in Europe(10). Hence, the
† The percentage of persons living in households where there was a lack of at least three of the nine items of economic deprivation (including not financially able to have a meat or fish meal or a vegetarian equivalent). *Corresponding author: Email [email protected]
© The Authors 2019. This is an Open Access article, distributed under the terms of the Creative Commons Attribution licence (http:// creativecommons.org/licenses/by/4.0/), which permits unrestricted re-use, distribution, and reproduction in any medium, provided the original work is properly cited.
Public
Health
recent economic recession in Portugal might have in flu-enced the eating behaviours of some sub-populations disproportionately.
Diet patterns and access to adequate nutrition are influenced by complex structural and socio-economic
factors(11). For instance, in low-income populations,
time scarcity is a major obstacle(7,12). Balancing work,
child care or daily commute is time-consuming and people struggle to have time to prepare healthy meals
at home(13,14), resorting to ready-to-eat processed foods
that are generally less healthy(15,16). In the USA and
Britain, there is evidence suggesting a discrepancy in prices between nutrient-rich foods and less nutritious alternatives, where less healthy foods tend to be more
resistant to inflation(16–18). This disparity in prices may
present an important constraint to a healthier diet among low-income groups.
On the one hand, we may suspect the impoverish-ment of the population to have improved the dietary pattern, due to shorter working hours providing more time for home-made foods. On the other hand, we may hypothesise a decline in the consumption of healthy foods, which are generally more expensive and thus less affordable in a period of economic downturn. Finally, it may be that these phenomena occurred simultaneously in different sub-populations; for exam-ple, the decreased consumption of healthy foods due to price might have been more likely among the worse-off, while the greater availability to cook might have been more likely among the younger people.
Meanwhile, there have been significant changes in
diet habits in Europe, particularly in Portugal(19).
Research suggests that in the last decades Portugal is drifting away from the Mediterranean diet, which is associated with better health outcomes. This diet is characterised by high intakes of vegetables, fruits and
whole grains, moderate consumption of fish and
white meat, and low consumption of red meat,
processed meats and foods rich in sugars(20–23).
Studies from 2007 and 2009 indicate that there has
been a decrease in intakes of vegetables, fish and
wholegrain products, and an increased intake of
pro-cessed foods(19,24).
In the present study, we examined the changes in consumption of selected food groups in Portugal, comparing the 2005/2006 and 2014 health surveys and analysing their socio-economic patterning. This aim is particularly significant considering the role of poor diet as a major risk factor for non-communicable diseases, such as
CVD, diabetes and cancer(25–28). In recent years,
increas-ing evidence from observational studies and randomised trials has shown an association between an unbalanced diet and intermediate outcomes including high prevalence
of hypertension(29), obesity(30) and ischaemic stroke
risk(31).
Methods
Study design and population
We did a secondary analysis of cross-sectional data from the National Health Interview Surveys of 2005/2006 and 2014. These surveys are cross-sectional studies based on representative samples of the non-institutionalised
popu-lation living in Portugal(32,33). The data from National
Health Interview Surveys are collected by the National Institute for Statistics and are available on demand for research purposes. The sample for the 2005/2006 survey was selected from the mother sample of the Population and Housing Census data from 2001. The methodology consisted of a systematic selection of primary units (areas) based on probability proportional to the number of
households(33). The 2014 survey followed a regional and
multistage stratified sampling scheme, in which the
pri-mary units (areas) were systematically selected based on probability proportional to the number of households, and the secondary units (households) were based on random
sampling within primary units(34).
The National Health Interview Survey of 2005/2006 was conducted from 7 February 2005 to 7 February 2006, with face-to-face interviews of all individuals residing in each of the housing units included. A total of 15 457 families were interviewed, corresponding to 41 193 residents with a
response rate of 76 % for the national territory(33). The
responses from the Portuguese National Health Interview Survey 2014 were collected between September and December 2014 through face-to-face interviews and via the Internet. A total of 18 204 valid responses were obtained, corresponding to an overall response rate of
80 %(32). Note that the individuals interviewed in the 2005/
2006 and 2014 questionnaires are not the same; that is, the analysis was based on repeated cross-sections and not on cohorts. Given that the methodology used to design the samples was similar, we opted to pool the data from the two surveys.
We only considered people above 25 and below 79 years of age. Younger people were not included to avoid considering people who did not conclude their education; and older people because the survey did not consider institutionalised persons, so that the sample might be biased for this sub-population.
Outcomes
All dependent variables were dichotomised: consumption of meat (‘yes’ and ‘no’); consumption of soup (‘yes’ and ‘no’); consumption of fish (‘yes’ and ‘no’); consumption of potatoes/rice/pasta (‘yes’ and ‘no’); consumption of bread (‘yes’ and ‘no’); consumption of legumes (‘yes’ and ‘no’); consumption of sweets/desserts (‘yes’ and ‘no’); con-sumption of fruit (‘yes’ and ‘no’ for the 2005/2006 survey
only); and consumption of vegetables (‘yes’ and ‘no’ for
Public
Health
the 2005/2006 survey only). These classes are the result of questions made in both 2005/2006 and 2014 surveys: participants were asked if they had eaten any of these foods groups in the main meals of the previous day. However, in the 2014 survey, fruit and vegetable intakes were measured in a different way; that is, people were asked about the number of days they consumed these foods in the last week (‘7 days a week’; ‘6–4 days a week’; ‘3–1 days a week’; ‘less than 1 a week’; ‘never’), instead of whether they had eaten fruits and vegetables or not, like in 2005. To identify fruit and vegetable consumption, we considered the percentage of individuals reporting to have consumed fruit and vegetables in the 24 h recall, for the 2005/2006 sample; and the number of individuals report-ing to have consumed fruits and vegetables on 7 d/week, for the 2014 sample. We acknowledge that the different measures in 2005/2006 and 2014 potentially bias the comparison, but the alternative was to remove fruit and vegetables from the analyses, which would represent a serious limitation given the relevance of these nutrients. Hence, the results for these two variables should be viewed with caution.
The consumption of soup could be seen as a possible proxy for the intake of vegetables. There is also evidence linking soup intake to a decreased risk of obesity in both
genders in Portugal(35). The main negative aspect with soup
consumption in Portugal is the high average sodium levels(36).
The food groups were selected due to their overall nutritional value, protective and detrimental health effects,
and relevance to the Mediterranean diet(20,21,37). The use
of these food groups can be presented as significant public
health indicators for the impact of dietary habits on the Portuguese population.
In this context, evidence shows that different dietary patterns or specific foods can lead to a considerable
varia-tion in the risk of premature death(38,39). For example, a
recent meta-analysis suggested that while the increasing intake of red and processed meats or sugar-sweetened beverages had a positive association with a higher risk of all-cause mortality, the consumption of whole grains, fruits,
vegetables, legumes orfish had an inverse association(39).
Explanatory variables and covariates
The explanatory variable was the year of the interview (2005/2006 and 2014), coded as a dichotomous variable. Covariates included sex (female; male), educational level
(no education (0–3 years of education); pre-primary
edu-cation (4 years of eduedu-cation); primary eduedu-cation (9 years of education); secondary education (12 years of
educa-tion); tertiary education (>12 years of education)) and age
(25–39 years; 40–64 years; ≥65 years). Statistical analysis
To analyse the primary outcome, we used logistic
regression to model the consumption of soup, fish, meat,
potatoes/rice/pasta, bread, legumes, fruit, vegetables and sweets/desserts, as a function of the year, controlling for age, sex and education. We adjusted OR and their 95 % CI for the independent variables, establishing the level of
significance at P < 0·05(40).
We then stratified the analysis with the same variables by education level and age, controlling for age/education level and sex. We divided the education level into three different groups: no education/pre-primary education; primary education/secondary education; and tertiary
education. We also stratified our population by three
dis-tinct age groups: 25–39, 40–64 and ≥65 years. The
dif-ferent associations of dietary intake and year were tested through interacting the year variable with education levels and with age categories. All analyses were adjusted for survey weights.
Analyses were conducted using the statistical software package Stata version 13.
Results
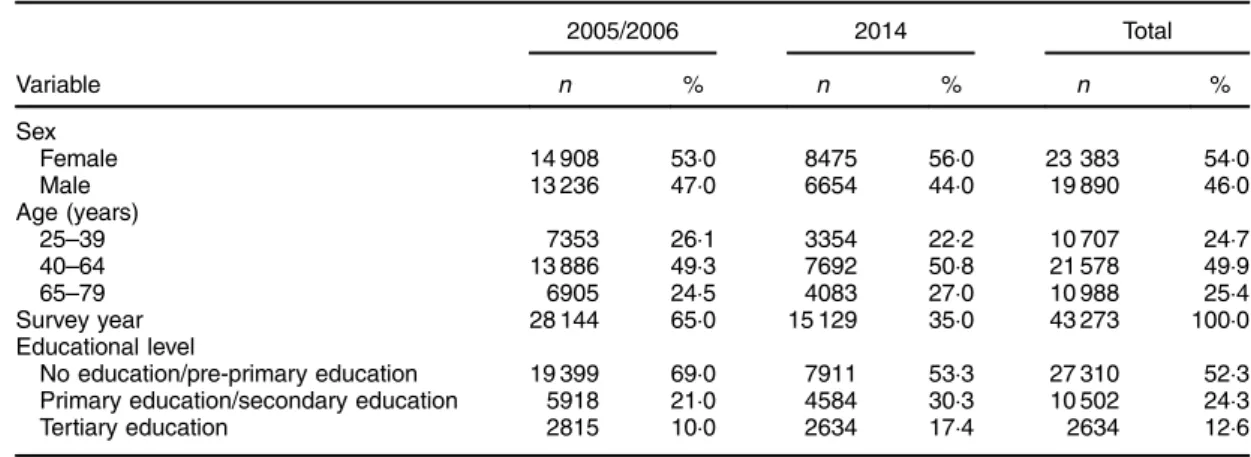
A total of 43 273 observations were included in the ana-lysis. Almost two-thirds of all participants were part of the 2005/2006 survey (Table 1). The percentage of individuals
with tertiary education increased from 10·0 % in 2005/2006
to 17·4 % in 2014.
In 2014, there was an overall decrease in the
con-sumption of fish, soup, fruit and vegetables and an
increase in the consumption of legumes and sweets/des-serts (Fig. 1). Compared with 2005/2006, there was in 2014
a significantly lower consumption of fish (49 v. 52 %,
OR= 0·81, P < 0·01), soup (64 v. 68 %, OR = 0·78, P < 0·01),
fruit (73 v. 82 %, OR= 0·50, P < 0·01) and vegetables (52 v.
78 %, OR= 0·45, P < 0·01). Conversely, the consumption of
legumes (32 v. 27 %, OR= 1·34, P < 0·01) and sweets/
desserts (37 v. 26 %, OR= 1·54, P < 0·01) were significantly higher in 2014. There were no significant changes in the consumption of meat, bread and potatoes/rice/pasta between the 2005/2006 and 2014 surveys.
Between 2005/2006 and 2014, the variation patterns in the consumption of key foods were similar among
younger generations (age groups 25–39 years and 40–64
years). Within these groups, there was a significantly lower
consumption of fish, soup, fruit and vegetables and a
higher intake of sweets/desserts (Fig. 2). The only differ-ence between these groups was in the consumption of legumes, which did not change among the youngest people (25–39 years). For people aged ≥ 65 years, there was a significant increase in the intake of legumes
(OR= 1·68, P < 0·01) and sweets/desserts (OR = 1·94,
P< 0·01). These changes were mostly consistent across
education groups (we did not observe significant differ-ences across educational categories), except for the con-sumption of soup, which decreased more among the
lowest educated people aged 40–64 years.
Public
Health
When comparing sub-populations with different edu-cation levels, we observed an increase in the consumption of sweets among the three categories, and of legumes among people with low and middle education. The con-sumption of soup declined only among the low educated,
and offish among those with middle education. Changes
were mostly consistent across age groups, except for the increase in legumes, which was higher among the low-and middle-educated elderly, low-and the decrease in soup, which was greater among the low-educated younger people.
Discussion
Keyfindings
During a time frame of approximately 9 years (2005/2006 to 2014), there were significant changes in the intake of key food groups in Portugal: there was a generalised
decrease in the consumption of soup, fish, fruit and
vegetables, and an overall increase in consumption of
legumes and sugar-containing foods. Meat, potatoes/rice/
pasta and bread did not experience significant changes
from 2005/2006 to 2014.
This pattern was observed among those aged 25–64
years, except the increase in legumes intake, which was not found among those aged 25–39 years. Among the
elderly aged ≥65 years, the decrease in fish and soup
consumption was not observed. These findings were
consistent across education categories, except soup that decreased more among the low-educated people aged 40–64 years.
Interpretation
The changes in consumption of selected food groups had similar patterns across education groups, except the con-sumption of soup, which did not change significantly during this period among the lowest educated people
aged 40–64 years. Whereas the drop in fish intake could
be attributed tofinancial constraints, this is not the case for
soup, which is generally cheaper and whose consumption also declined. Furthermore, the increase in sweets may be
79 % 52 % 68 % 90 % 93 % 27 % 26 % 82 % 78 % 79 % 49 % 64 % 89 % 92 % 32 % 37 % 73 % 52 % 1.004 0.811** 0.779** 0.973 0.912 1.336** 1.536** 0.502** 0.446**
Meat Fish Soup Potatoes/
rice/pasta
Bread Legumes Sweets/
desserts
Fruit Vegetables
Fig.1 (colour online) Unadjusted percentage consumption of key foods in 2014 ( ) v. 2005/2006 ( ), and adjusted OR ( ) for 2014 v. 2005/2006, controlling for age/education level and sex using binary logistic regression, among Portuguese adults (n 43 273) aged 25–79 years participating in the National Health Interview Surveys of 2005/2006 and 2014. *P < 0·05, **P < 0·01
Table 1 Baseline characteristics of participants from the Portuguese National Health Interview Surveys of 2005/2006 and 2014 2005/2006 2014 Total Variable n % n % n % Sex Female 14 908 53·0 8475 56·0 23 383 54·0 Male 13 236 47·0 6654 44·0 19 890 46·0 Age (years) 25–39 7353 26·1 3354 22·2 10 707 24·7 40–64 13 886 49·3 7692 50·8 21 578 49·9 65–79 6905 24·5 4083 27·0 10 988 25·4 Survey year 28 144 65·0 15 129 35·0 43 273 100·0 Educational level No education/pre-primary education 19 399 69·0 7911 53·3 27 310 52·3
Primary education/secondary education 5918 21·0 4584 30·3 10 502 24·3
Tertiary education 2815 10·0 2634 17·4 2634 12·6
Public
Health
in part explained by their affordability. However, the similar results observed in most education levels calls this explanation into question.
The more dramatic reduction in the overall consump-tion of fruit and vegetables from 2005/2006 to 2014 may derive from the different outcome measures used in the 2005/2006 and 2014 surveys. Thus, we will refrain from drawing strong conclusions about this decline. However, it is worth noticing that the variation in fruit and vegetable intake follows a similar pattern across education groups as
found for the remaining foods included in the
present study.
People aged ≥65 years did not significantly reduce
the intake of any food, except fruit and vegetables. This is despite the elderly being a particularly vulnerable
group, characterised by a high percentage of
low-educated people with lower average
earn-ings(41,42), and thus more exposed to an economic recession.
In Portugal, there is a robust association between income and level of education. The most educated people tend to have higher average earnings compared with the
lowest educated(41,43). Therefore, the findings could
sug-gest that most of these changes in the consumption of selected food groups were widespread, independently
from one’s level of education and income. However, we
cannot support the premise that loss of income was a driving factor behind the observed habits changes if we
consider that the recent economic recession
dis-proportionately affected the Portuguese population,
0 . 88 0 . 79 **0 . 62 0 . 84 1 . 01 . 101 1 . 52** **0 . 37 **0 . 35 0 . 91 **0 . 68 . 79*0 0 . 90 0 . 85 1 . 02 1 . 34** **0 . 41 **0 . 38 0 . 74 1 . 03 *0 . 72 1 . 07 0 . 90 1 . 09 . 201 **0 . 47 **0 . 42 0 . 91 *0 . 87 **0 . 78 0 . 95 0 . 85 0 . 96 1 . 60** **0 . 49 **0 . 44
Age group 25–39 years
1 . 07 **0 . 85 **0 . 72 0 . 92 **0 . 74 1 . 32** 1 . 60** **0 . 62 **0 . 46 1 . 07 **0 . 78 0 . 99 1 . 15 1 . 02 1 . 59** 1 . 50** **0 . 42 **0 . 39 0 . 84 **0 . 65 0 . 86 . 890 1 . 28 1 . 25 1 . 49** *0 . 59 **0 . 52 1 . 08 **0 . 83 **0 . 8 . 930 0 . 83 1 . 30** 1 . 72** **0 . 63 **0 . 50
Age group 40–64 years
0 . 99 0 . 97 0 . 95 1 . 03 . 041 1 . 77** . 88**1 **0 . 76 **0 . 65 1 . 63* 0 . 99 0 . 87 0 . 6 0 . 96 1 . 65* 1 . 56* *0 . 42 0 . 64 0 . 86 . 970 . 960 1 . 08 1 . 51 1 . 17 1 . 70 0 . 53 0 . 74 1 . 04 1 . 01 0 . 94 . 980 . 990 1 . 68** 1 . 94** **0 . 76 **0 . 69 Age group ≥ 65 years S NS NS NS NS NS NS NS NS NS NS NS NS NS NS NS NS NS NS NS NS NS NS NS NS NS NS
Meat Fish Soup Potatoes/ Fruit Vegetables
rice/pasta
Bread Legumes Sweets/ desserts
Meat Fish Soup Potatoes/ Fruit Vegetables
rice/pasta
Bread Legumes Sweets/ desserts
Meat Fish Soup Potatoes/ Fruit Vegetables
rice/pasta
Bread Legumes Sweets/ desserts
Fig.2 (colour online) Adjusted OR for consumption of key foods in 2014 v. 2005/2006 among different age groups, stratified by education level ( , no education/pre-primary education; primary education/secondary education; tertiary education; all groups), controlling for sex using binary logistic regression, among Portuguese adults (n 43 273) aged 25–79 years participating in the National Health Interview Surveys of 2005/2006 and 2014. *P < 0·05, **P < 0·01 (S, significant differences in changes across
sub-populations,P < 0·01;NSnon-significant differences in changes across sub-populations,P > 0·01)
Public
Health
where families with the lowest income lost almost twice as much of their earnings compared with families with higher
revenues(44).
A study conducted in Italy that examined adherence to a Mediterranean diet during the recent recession observed
different results(45,46). Wealth and education were major
determinants of the changes in dietary patterns. Less affluent groups (mainly living in urban areas) and the elderly had a higher decrease in adherence to this diet, therefore suggesting a role of the economic downturn on eating behaviours.
Although the present study did not specifically measure
adherence to the Mediterranean diet, our results may also be interpreted as resulting from the long-term decline in this adherence, rather than from short-term effects of the economic downturn. For example, the reduction in
intakes offish and soup and the increase in sweets are
likely related to a reduction in adherence to the Medi-terranean diet from 2005/2006 to 2014. This trend is in line with previous studies that showed Portugal has been drifting away from the Mediterranean diet in the last
decades(19,24). The only exception was in the
consump-tion of legumes, which increased significantly during this period.
The reduction of fish and soup was felt more
pro-minently among younger people, which seems to indicate that these younger generations were less
resistant to food-related behaviour changes. The
exception to this trend was the consumption of legumes, which did not increase among the younger
individuals. Again, thisfinding may be interpreted as a
more pronounced reduction in adherence to the Med-iterranean diet within younger generations when compared with the elderly.
This trend towards poorer adherence to this diet among younger people in Southern European countries is well
documented in a recent overview of studies(47). Most of
the research analysed in that review showed a tendency
for lower intakes of vegetables, fruits and fish and
increased consumption of products with low nutrient density like soft drinks and sweets.
One should also consider the role of the food supply
and availability of certain types of food product(48,49). In
Mediterranean countries, some research from the begin-ning of the 21st century has pointed out the increasing energy availability from non-Mediterranean foods like animal fats and sugar products, contrasting with the fall in energy availability provided from plant proteins and
cer-eals(48). Technical changes in the food industry, rapid
urbanisation and increasing dissemination of ready-to-eat outlets should also be considered and studied as possible
drivers of the observed dietary changes(49,50).
Further-more, additional studies are needed to understand if these changes could be influenced by economic constraints or other barriers such as lack of time, knowledge or skills to
prepare healthier meals, particularly among younger generations.
Limitations
The overall results of the present study should be viewed with caution. For instance, we could not evaluate the general quality of the products consumed and if there were changes to less/more healthy options of the same proteins/vegetables/carbohydrates over time. The col-lected data from the Portuguese National Health Interview Surveys of 2005/2006 and 2014 did not include questions regarding the types of foods consumed. The surveys did not specify whether people were eating meals prepared at home or resorting to away-from-home foods or processed foods. Hence, it was not possible to evaluate the general quality of the foods consumed.
This is also true regarding each food individually,
par-ticularly for the consumption of meat andfish: we did not
know the overall quality of these products, mainly if those
were processed meat andfish, which is crucial to a more
comprehensive assessment of the Mediterranean diet. This missing information is key to future analysis of diet pat-terns during economic recessions. We may hypothesise that economic constraints could lead vulnerable groups to less healthy options, switching from fresh products to cheaper high-energy-dense alternatives.
Another limitation concerns the methods used to assess food intake. In the Portuguese National Health Interview Surveys, participants were asked what they ate in the previous day, relying on the participant’s memory to measure the consumption of the selected food groups. Dietary records or food diaries are more comprehensive and detailed dietary assessment methods that report a high
validity and precision(51,52). Nevertheless, these methods
are less feasible in large representative samples of a national population. Working on a representative sample of the Portuguese population is a strength that counter-balances this limitation.
The present study’s results for the consumption fruit and
vegetable variables should be carefully considered and
analysed. As stated in the ‘Methods’ section, these
vari-ables were measured differently between the 2004/2005 and the 2014 surveys. It is likely that this may cause a bias towards a reported lower consumption in the 2014 sample.
Since it was not possible to access data about the income of study participants, conclusions regarding aver-age earnings were inferred from the level of education,
which are closely related in Portugal, but not
equivalent(41,43).
Additionally, there is also evidence suggesting that methods using self-report responses to measure dietary intake could be biased by social desirability or social
approval(53,54).
Public
Health
Finally, stratified analyses may provide non-significant differences between socio-economic groups due to small samples; in some cases, we observed differences between groups in the magnitude of estimates, which were how-ever not significant. We opted to not emphasise these differences in magnitude, in a conservative approach, but
larger databases may provide differentfindings.
Policy implications
These observed changes in eating habits in Portugal sup-port the urge for a review of past/current public health policies related to dietary habits. Public policies that tackle the structural factors behind the reduction in adherence to the Mediterranean diet should be put in place to reverse the trends shown in the present study.
Conclusions
Our study shows that there has been an overall reduction
in the consumption offish, soup, fruit and vegetables, and
an increase in meat and sweets. Although the Mediterra-nean diet was not directly assessed in the current study, the observed pattern may be indicative of a decline in adherence to this diet in the Portuguese population from 2005/2006 to 2014, particularly among younger people. The decline was felt consistently across educational levels, which differs from the available evidence from Southern Europe. Given the close link between education and income in Portugal and the disproportionate impact of economic crisis among the worse-off, these results seem to indicate that the observed changes are not linked to the
economic downturn. Therefore, our findings may be
interpreted as resulting from long-term declining adher-ence to the Mediterranean diet.
However, these results should be viewed with caution and future studies should take into consideration a more detailed account of the types of foods consumed. Bearing in mind the evidence on changing diet habits in Western societies, the role of the food industry, food supply and urbanisation should be studied as possible drivers for these changes.
Acknowledgements
Financial support: This research was financed by a
scholarship from NOVA-Saúde (‘Food insecurity in
Portu-gal – costs, burden, challenges and implications’). The
funder had no role in the design, analysis or writing of this article. Conflict of interest: None. Authorship: R.A., the principal investigator, was responsible for designing the study, analysing the data and writing the article. J.P., co-investigator, was responsible for designing the study and reviewing the article. Ethics of human subject participa-tion: Not applicable.
References
1. Kawachi I (2012) Economic crisis and smoking behaviour: prospective cohort study in Iceland. Bus Manag J 2, 1–7. 2. Ruhm CJ (2003) Good times make you sick. J Health Econ
22, 637–658.
3. Ruhm CJ (2005) Healthy living in hard times. J Health Econ 24, 341–363.
4. Freeman DG (1999) A note on economic conditions and alcohol problems. J Health Econ 18, 659–668.
5. Mercan MA (2013) A research note on the relationship between long working hours and weight gain for older workers in the United States. Res Aging 36, 557–567. 6. Todd JE (2014) Changes in Eating Patterns and Diet
Quality among Working-Age Adults, 2005–2010. Economic Research Report no. 161. Washington, DC: US Department of Agriculture, Economic Research Service.
7. Smith LP, Ng SW & Popkin BM (2014) Resistant to the recession: low-income adults’ maintenance of cooking and away-from-home eating behaviors during times of eco-nomic turbulence. Am J Public Health 104, 840–846. 8. Insituto Nacional de Estatística (2015) Anuário Estatístico de
Portugal 2014: enquadramento populacional. Lisboa: Instituto Nacional de Estatística.
9. Direção-Geral de Saúde (2015) Programa Nacional para a Promoção da Alimentação Saudável. Lisboa: Direção-Geral de Saúde.
10. European Commission (2017) Key Figures on Europe – 2017 Edition. Luxembourg: Publications Office of the Eur-opean Union.
11. Azétsop J & Joy TR (2013) Access to nutritious food, socioeconomic individualism and public health ethics in the USA: a common good approach. Philos Ethics Humanit Med 8, 16.
12. Davis GC & You W (2011) Not enough money or not enough time to satisfy the Thrifty Food Plan? A cost differ-ence approach for estimating a money-time threshold. Food Policy 36, 101–117.
13. Rose D (2007) Food Stamps, the Thrifty Food Plan, and meal preparation: the importance of the time dimension for US nutrition policy. J Nutr Educ Behav 39, 226–232.
14. Beatty TK, Nanney MS & Tuttle C (2014) Time to eat? The relationship between food security and food-related time use. Public Health Nutr 17, 66–72.
15. Monteiro CA, Levy RB, Claro RM et al. (2011) Increasing consumption of ultra-processed foods and likely impact on human health: evidence from Brazil. Public Health Nutr 14, 5–13.
16. Drewnowski A (2004) Obesity and the food environment: dietary energy density and diet costs. Am J Prev Med 27, 3 Suppl., 154–162.
17. Monsivais P & Drewnowski A (2007) The rising cost of low-energy-density foods. J Am Diet Assoc 107, 2071–2076. 18. Monsivais P, Mclain J & Drewnowski A (2010) The rising
disparity in the price of healthful foods: 2004–2008. Food Policy 35, 514–520.
19. da Silva R, Bach-Faig A, Raidó Quintana B et al. (2009) Worldwide variation of adherence to the Mediterranean diet, in 1961–1965 and 2000–2003. Public Health Nutr 12, 1676–1684.
20. Sofi F, Cesari F, Abbate R et al. (2008) Adherence to Med-iterranean diet and health status: meta-analysis. BMJ 337, a1344.
21. Sofi F (2009) The Mediterranean diet revisited: evidence of its effectiveness grows. Curr Opin Cardiol 24, 442–446.
22. Fidanza F, Alberti A, Lanti M et al. (2004) Mediterranean Adequacy Index: correlation with 25-year mortality from coronary heart disease in the Seven Countries Study. Nutr Metab Cardiovasc Dis 14, 254–258.
Public
Health
23. Castro-Quezada I, Román-Viñas B & Serra-Majem L (2014) The Mediterranean diet and nutritional adequacy: a review. Nutrients 6, 231–248.
24. Rodrigues SSP, Caraher M, Trichopoulou A et al. (2007) Portuguese households’ diet quality (adherence to Mediterranean food pattern and compliance with WHO population dietary goals): trends, regional disparities and socioeconomic determinants. Eur J Clin Nutr 62, 1263–1272. 25. World Cancer Research Fund & American Institute for Cancer Research (2007) Food, Nutrition, Physical Activity, and the Prevention of Cancer: A Global Perspective. Washington, DC: AICR.
26. Schwingshackl L, Hoffmann G, Lampousi A-M et al. (2017) Food groups and risk of type 2 diabetes mellitus: a sys-tematic review and meta-analysis of prospective studies. Eur J Epidemiol 32, 363–375.
27. Hunter DJ & Reddy KS (2013) Noncommunicable diseases. N Engl J Med 369, 1336–1343.
28. Ezzati M & Riboli E (2013) Behavioral and dietary risk fac-tors for noncommunicable diseases. N Engl J Med 369, 954–964.
29. Karppanen H & Mervaala E (2006) Sodium intake and hypertension. Prog Cardiovasc Dis 49, 59–75.
30. Malik VS, Schulze MB & Hu FB (2006) Intake of sugar-sweetened beverages and weight gain: a systematic review. Am J Clin Nutr 84, 274–288.
31. Boden-Albala B, Elkind MS V, White H et al. (2009) Dietary total fat intake and ischemic stroke risk: the Northern Manhattan study. Neuroepidemiology 32, 296–301. 32. Instituto Nacional de Estatística & Instituto Nacional de Saúde
Doutor Ricardo Jorge (2015) Inquérito Nacional de Saúde 2014: mais de metade da população com 18 ou mais anos tinha excesso de peso. Lisboa: Instituto Nacional de Estatística e Instituto Nacional de Saúde Doutor Ricardo Jorge. 33. Instituto Nacional de Estatística & Instituto Nacional de
Saúde Doutor Ricardo Jorge (2009) Inquérito Nacional de Saúde 2005/2006. Lisboa: Instituto Nacional de Estatística e Instituto Nacional de Saúde Doutor Ricardo Jorge. 34. Instituto Nacional de Estatística (2016) Inquerito Nacional
de Saúde 2014. Lisboa: Instituto Nacional de Estatística. 35. Moreira P & Padra P (2006) Educational, economic and
dietary determinants of obesity in Portuguese adults: a cross-sectional study. Eat Behav 7, 220–228.
36. Gonçalves C (2006) Occupational safety and hygiene sodium content in vegetable soups prepared outside the home: identifying the problem. In Proceedings of the International Symposium on Occupational Safety and Hygiene, pp. 278–281. Guimarães, Portugal: Portuguese Society of Occupational Safety and Hygiene.
37. Portugal, Ministério da Saúde, Direcção-Geral da Saúde (2005) Princípios para uma Alimentação Saudável. Lisboa: Direcção Geral de Saúde.
38. Schwingshackl L & Hoffmann G (2015) Diet quality as assessed by the Healthy Eating Index, the Alternate Healthy Eating Index, the Dietary Approaches to Stop Hypertension
score, and health outcomes: a systematic review and meta-analysis of cohort studies. J Acad Nutr Diet 115, 780–800. 39. Schwingshackl L, Schwedhelm C, Hoffmann G et al. (2017)
Food groups and risk of all-cause mortality: a systematic review and meta-analysis of prospective studies. Am J Clin Nutr 105, 1462–1473.
40. Marôco J (2014) Estatística com o SPSS Statistics, 6a ed. Pêro Pinheiro, Portugal: Report Number.
41. PORDATA (2017) Rendimento Médio Equivalente: por nível de escolaridade (Euro). Lisboa: Fundação Francisco Manuel dos Santos.
42. Instituto Nacional de Estatística (2017) Rendimento e Con-dições de Vida 2016: 2,6 milhões de residentes em risco de pobreza ou exclusão social em 2016. Lisboa: Instituto Nacional de Estatística.
43. Cantante F (2014) Desigualdades economicas multi-esca-lares: Portugal no contexto global. Anal Soc 49, 534–566. 44. Rodrigues CF, Figueiras R & Junqueira V (2016)
Desigual-dade do Rendimento e Pobreza em Portugal: as con-sequências sociais do programa de ajustamento. Lisboa: Fundação Francisco Manuel dos Santos.
45. Bonaccio M, Di Castelnuovo A, Bonanni A et al. (2014) Decline of the Mediterranean diet at a time of economic crisis. Results from the Moli-sani study. Nutr Metab Cardi-ovasc Dis 24, 853–860.
46. Bonaccio M, Bes-Rastrollo M, de Gaetano G et al. (2016) Challenges to the Mediterranean diet at a time of economic crisis. Nutr Metab Cardiovasc Dis 26, 1057–1063.
47. Grosso G & Galvano F (2016) Mediterranean diet adherence in children and adolescents in southern European countries. NFS J 3, 13–19.
48. Balanza R, García-Lorda P, Pérez-Rodrigo C et al. (2007) Trends in food availability determined by the Food and Agriculture Organization’s food balance sheets in Medi-terranean Europe in comparison with other European areas. Public Health Nutr 10, 168–176.
49. Alexandratos N (2006) The Mediterranean diet in a world context. Public Health Nutr 9, 111–117.
50. Drewnowski A & Popkin BM (1997) The nutrition transition: new trends in the global diet. Nutr Rev 55, 31–43. 51. Freisling H, Ocké MC, Casagrande C et al. (2015)
Compar-ison of two food record-based dietary assessment methods for a pan-European food consumption survey among infants, toddlers, and children using data quality indicators. Eur J Nutr 54, 437–445.
52. Ortega RM, Perez-Rodrigo C & Lopez-Sobaler AM (2015) Métodos de evaluación de la ingesta actual: registro o diario dietético. Nutr Hosp 31, 38–45.
53. Schoeller DA (1995) Limitations in the assessment of dietary energy intake by self-report. Metabolism 44, 18–22. 54. Hebert JR, Clemon L, Pbert L et al. (1995) Social
desirability bias in dietary self-report may compromise the validity of dietary intake measures. Int J Epidemiol 24, 389–398.