2018
UNIVERSIDADE DE LISBOA
FACULDADE DE CIÊNCIAS
DEPARTAMENTO DE BIOLOGIA VEGETAL
Evaluation of the physiologic response of heterotrophic
bacteria present in aquatic environments to the presence of
microcystins
Joana Filipa Rebouço Andrade
Mestrado em Microbiologia Aplicada
Dissertação orientada por:
Elisabete Maria Pinto Valério
ii
Evaluation of the physiologic response of heterotrophic
bacteria present in aquatic environments to the presence of
microcystins
Joana Andrade
(2018)
This thesis was fully performed at Instituto Nacional de Saúde Doutor Ricardo Jorge under the direct supervision of Elisabete Maria Pinto Valério in the scope of the Master in Applied Microbiology of the Faculty of Sciences Of the University of Lisbon.
iii
Previous notes
This work lead to the following communication:
Joana Andrade e Elisabete Valério (2018) Avaliação da resposta de bactérias heterotróficas presentes no meio aquático à presença de microcistinas. 17º Encontro Nacional de Ecologia (ENE), Évora, 15 e 16 de novembro de 2018. Panel communication with oral presentation.
iv
Acknowledgments
To all who supported me throughout this thesis, I would like to leave my honest acknowledgments:
To Doctor Elisabete Maria Pinto Valério, for all the teachings, support, dedication and understanding demonstrated during this year. For the given opportunity and vote of confidence. But also, for the lunches, long talks and funny moments. Thank you for the concern, support, friendship and encouragement shown during this year.
To Prof. Doctor Ana Maria Gonçalves Reis for the concern and aid provided to the realization of this thesis.
To prof. Doctor Lélia Chambel for the guidance during these two years.
To all my colleagues at the Biology and Ecotoxicology lab in INSA, to Pedro Teixeira, Sérgio Paulino, Arminda Vilares, Carina Menezes and Elsa Dias, for the friendship, help, and for all the fun times and coffee breaks.
To Prof. Doctor Ana Amorim and Prof. Doctor Ana Rita Matos who showed me a new side of biology that took me to this moment.
To Daniela for always being there, for unconditional friendship and all the adventures, for always listening to me when I needed, and for being my sister of heart. To Francisco for the moral support and friendship, for encouraging conversations and carefree lunches. For all the help during this year. To Tânia, who was always ready to listen to me and who helps me see the other side of things. To Joana, for her friendship and all the good times. To Paulo, for his friendship and many adventures. To Diana for her friendship, support and advises. For long talks and relaxed times. To Jorge, for all the support, care, teachings and encouragement throw the years. To Alexandra “Xana”, for the companionship and care. To Ricardo for his friendship and fun moments. To Ana, Manel, Patricia, João and Catarina for all the friendship and good moments.
To my cousins Mariana, Inês and Bea for the care, support and friendship. To my godparents for the support and love.
To my grandmother for the love and care.
To my brother, who no matter what is there for me, and for all his love. And to all my family for all the love and support.
And finally, to my parents. For all the unconditional love and support. For being my rock in every moment and to always staying by my side no matter what. To my mom, for the hugs, cuddle and caress and every word of worry. To my father, for all the advice, caress and silly moments.
v
Abstract
Microcystins (MC) are the hepatotoxins produced by cyanobacteria, which are photosynthetic organisms that usually colonize aquatic environments. Climate change has had a significant impact on the increased frequency of cyanobacterial blooms, which are often associated with the production of cyanotoxins. Studies show that the growth of aquatic heterotrophic bacteria that co-occur with cyanobacteria may not be affected by the presence of MC, or, on the other hand they may present a reduction in growth, never being totally inhibited by their presence (Miguéns, 2013; Pinto, 2016).
The aim of this study was to examine the effects of three microcystin variants (MCLR, MCRR, MCYR) on heterotrophic aquatic bacteria living in the same ecosystem as cyanobacteria. In particular, (1) to observe the impact of microcystins on the growth of heterotrophic bacteria, (2) the impact on the enzymes of the antioxidant system of these bacteria and (3) to screen the presence of mlr genes.
For this purpose, we performed the morphological and molecular characterization of 22 bacteria isolated from two reservoirs. It was intended to analyze the growth of bacterial isolates exposed to different concentrations of extract of each variant of MCs, and also to two concentrations of pure microcystin-LR. The search for the presence of MCs degradation genes (mlrA-D), was done using PCR. In order to analyze the effect of microcystins on the antioxidant system of the isolates, catalase (CAT) and superoxide dismutase (SOD1 and SOD2) activities were determined spectrophotometrically, at 240 nm and 550 nm, respectively, in the cells exposed to the different variants of microcystin.
None of the isolates grown in liquid medium was completely inhibited by the
exposure to microcystins, however, it was found that MCs can reduce the growth of most
bacteria tested. While some bacteria grew without any induced effect, others reacted
differently according to the variant and the concentration (in the same isolate). In some
cases a slight growth stimulation was observed. In most cases the growth stimulation
appears to be related with other molecules from the MC extracts. The results of the
determination of CAT and SOD activities revealed that only three isolates have catalase,
namely M17F, M17K and 594196, and only three isolates have superoxide dismutase,
M17C, M17D and 594196. In this study, a heterotrophic bacteria, M17C, mlr+, was also
isolated, and it’s mlr genes were amplified and sequenced. A new primer pair for the mlrA
was also proposed in this study.
In summary, the results from this study, showed that there is not a pattern characteristic of the species or genera analyzed, thus indicating that the response of the heterotrophic bacteria isolates to MCs is mainly related to strain characteristics. They corroborate previous studies, which indicate that the cluster of mlr genes is not the only cause to allow bacteria to grow in the presence of MC without being affected by them, even with no alteration in the main enzymes from the antioxidant system (CAT and SOD).
vi
Resumo
As cianobactérias são organismos fotossintéticos capazes de colonizar uma grande variedade de habitats, em que se destacam os ambientes aquáticos. Nestes ambientes aquáticos as cianobactérias habitam a zona fótica, que corresponde à camada superficial da água que recebe luz solar. Em ambientes hídricos eutrofizados e em condições ambientais favoráveis, como temperaturas elevadas e grande disponibilidade de nutrientes como fosfatos e nitratos, as cianobactérias podem atingir elevadas densidades celulares, um fenómeno conhecido por blooms ou florescências. As alterações climáticas têm tido um impacto significativo no aumento de frequência de blooms de cianobactérias.
Estes blooms podem levar a um decréscimo de oxigénio e à produção de toxinas por cianobactérias (metabolitos secundários, normalmente designados cianotoxinas). Hoje sabe-se que, até 70% dos blooms de cianobactérias são tóxicos (Kazuya et al, 2011).
O efeito das cianotoxinas é já bem conhecido em mamíferos, permitindo uma divisão das cianotoxinas pelo seu alvo principal, nomeadamente: (1) neurotoxinas, cujo principal alvo é o sistema nervoso, (2) dermatotoxinas, de que o principal alvo é a pele e (3) hepatotoxinas, em que o fígado é o alvo principal (Zanchett et al, 2013).
As microcistinas (MCs) são o tipo de hepatotoxinas mais produzidas por cianobactérias, sendo a microcistina-LR, microcistina-RR e microcistina-YR as variantes mais comuns destas toxinas. Os efeitos tóxicos destas cianotoxinas encontram-se amplamente estudados em organismos eucariotas, contudo os efeitos em microrganismos são ainda escassos.
As cianobactérias encontradas em ambientes aquáticos convivem com outros microrganismos, nomeadamente bactérias heterotróficas como Aeromonas spp. e Flavobacterium spp. Nos últimos anos, tem-se procurado perceber de que forma é que bactérias heterotróficas, existentes em águas superficiais onde ocorrem habitualmente blooms de cianobactérias se comportam perante a presença de MCs. Verificou-se que estas toxinas, em alguns casos não têm qualquer efeito no crescimento das bactérias, enquanto que noutros provocam uma diminuição do crescimento de vários isolados de espécies diferentes, não o inibindo totalmente (Miguéns, 2013). Estes estudos levaram à descoberta de bactérias heterotróficas aquáticas degradadoras de MCs. A primeira via de degradação de MCs foi descoberta por Bourne et al (2001) em bactérias do género Sphingomonas. Mais tarde, Bourne et al (2001), percebeu que o cluster de genes envolvido nesta via de degradação era composto por quatro genes, mlrA, mlrB mlrC e mlrD. Novos isolados de outras espécies foram identificados como detentores do cluster mlr. No entanto, o número de bactérias mlr+ tem-se mostrado reduzido. Mais recentemente bactérias heterotróficas aquáticas degradadoras de MCs, mlr-, foram detetadas (Manage et al, 2009) e o seu estudo parece indicar que, apesar de serem menos eficientes na degradação de MCs do que as bactérias mlr+, estas estão presentes em maior número. Em 2016, Lezcano et al, propôs que a degradação de MCs por bactérias mlr- poderá estar associada ao metabolismo xenobiótico, ideia que veio reforçar a observação feita por Kormas e Lymperopoulou (2013) segundo a qual a maioria das bactérias degradadoras de MCs consegue normalmente “biodegradar” outros produtos. Em 2017, Dziga et al propôs a primeira via de degradação de MCs mlr-, que se pensa envolver um consórcio de bactérias heterotróficas aquáticas. Não estão ainda descritos os genes associados, apenas os locais de corte da MCs são para já conhecidos.
Estudos mostram que a exposição de bactérias heterotróficas aquáticas a MCs induz, entre outros efeitos, stresse oxidativo (Li et al, 2009), induzindo a formação de espécies reativas de oxigénio (ROS), como resultado do metabolismo oxidativo (Pflugmatcher, 2004). Os ROS podem causar sérios danos nas células, como a peroxidação de membranas lipídicas, genotoxicidade, apoptose e necrose (Ding e Ong, 2003).
vii O objetivo deste estudo foi examinar os efeitos de três variantes de MCs (MCLR, MCRR, MCYR) em bactérias heterotróficas aquáticas que vivem no mesmo ecossistema que as cianobactérias. Nomeadamente (1) observar o impacto das MCs no crescimento das bactérias heterotróficas, (2) o impacto destas nas enzimas do sistema antioxidante das bactérias e (3) rastrear a presença de genes mlr.
Para tal, procedeu-se à caracterização morfológica e molecular das bactérias isoladas. Pretendeu-se analisar o crescimento de isolados bacterianos expostos a diferentes concentrações de extrato de cada variante de MCs, e ainda a duas concentrações de microcistina-LR pura. Pesquisou-se a presença de genes de degradação de MCs (mlrA-D), recorrendo a PCR e confirmando quais os produtos amplificados por sequenciação. Analisou-se o efeito das MCs no sistema antioxidante dos isolados, nomeadamente, a atividade enzimática da catalase (CAT) e da superóxido dismutase (SOD) sendo estas determinadas espectrofotometricamente a 240 nm e 550 nm, respetivamente, nas células expostas às variantes da MCs.
Neste estudo, das 22 bactérias isoladas das Albufeiras de Magos e Roxo, oito são Aeromonas spp. e cinco são Flavobacterium spp.
Nenhum dos isolados que cresceu em meio líquido foi totalmente inibido pela exposição a MCs, no entanto, verificou-se que as MCs podem reduzir o crescimento da maioria das bactérias testadas, sendo que algumas bactérias cresceram sem efeito algum induzido, enquanto outras reagiram de forma diferente consoante a variante e a concentração usada no mesmo isolado. Em alguns casos observou-se ainda uma ligeira estimulação do crescimento. A comparação de respostas a extratos de MCLR e MCLR pura parece indicar que outras moléculas presentes no extrato estão a influenciar o crescimento das bactérias heterotróficas. Por exemplo, na maioria dos casos em que houve uma aparente estimulação do crescimento do isolado causado pela MC, correspondeu à adição de extratos, verificando-se que a mesma estimulação não ocorria quando era adicionada microcistina pura ao meio.
Os resultados da determinação das atividades da catalase (CAT) e superóxido dismutase (SOD) revelaram que apenas três isolados têm catalase, nomeadamente, M17F, M17K e 594196, e apenas três isolados têm superóxido dismutase, M17C, M17D e 594196. Juntando estes resultados aos resultados anteriores (Miguéns, 2013 e Pinto, 2016) algumas conclusões foram possíveis. Em relação à catalase, (1) a maioria das bactérias estudadas não apresentam atividade CAT nestes três estudos (19 isolados foram testados e apenas em seis foi detetada atividade deste enzima). (2) A maioria dos isolados apresentou redução de atividade quando expostos ao extrato de MCLR e a maioria dos isolados apresentou aumento de atividade CAT quando expostos ao extrato de MCRR, podendo esta resposta ser causada pela diferente hidrofobicidade das variantes MC (sendo MCLR mais hidrofóbica que a MCRR) o que vai facilitar a sua entrada na célula causando assim mais dano. (3) Sphingomonas sp. isolado 594196, também parece ter uma resposta completamente diferente à exposição de variantes de MCs, em comparação com os outros isolados. Em relação à atividade SOD, (1) os resultados suportam a ideia de que a resposta da atividade SOD às MCs é uma característica de estirpe. (2) Outros mecanismos podem estar envolvidos na degradação de O2●-. Neste estudo foi ainda isolada uma bactéria heterotrófica mlr+,
denominada M17C, cujos quatro genes mlr foram sequenciados. Um novo par de primers mlrA foi ainda proposto neste estudo.
Em resumo, os resultados apontam para que a resposta dos isolados às MCs esteja relacionada com as características de cada estirpe e corrobora estudos anteriores que indicam que o cluster de genes mlr não é a única via que permite que bactérias cresçam na presença de MC sem serem afetadas por estas, mesmo quando não há resposta alterada nas principais enzimas do sistema antioxidante.
Conclui-se ainda que outros componentes do extrato de MC podem
estar a afetar as bactérias de diferentes maneiras, interferindo nos ensaios.
viii
Table of
Contents
Previous notes ... iii
Acknowledgments ... iv
Abstract ... v
Resumo ... vi
Abbreviations ... xi
1. Introduction ... 1
1.1. Cyanobacteria, blooms and its geographical localization ... 1
1.2. Microcystins ... 1
1.2.1. Chemistry and structure ... 2
1.2.2. Degradation of microcystins ... 2
1.3. Heterotrophic bacteria ... 3
1.4. Biodegradation and MC-degrading aquatic heterotrophic bacteria ... 3
1.5. Bacterial antioxidant system and oxidative stress ... 4
1.6. Aim of this study ... 5
2. Methods ... 6
2.1. Sampling reservoirs ... 6
2.2. Isolation of bacteria ... 6
2.3. Phenotypic characterization of the isolated bacteria ... 6
2.4. Molecular analyses ... 6
2.4.1. Molecular identification of the isolates ... 6
2.4.2. Microcystin degradation genes (mlr) amplification ... 7
2.4.3. Sequencing ... 7
2.4.4. Phylogenetic Analyses ... 8
2.5. Bacterial Cell Growth... 8
2.6. Determination of activities of antioxidant system enzymes ... 9
3. Results ... 11
3.1. Characterization and identification of the heterotrophic bacteria isolated ... 11
3.2. mlr gene identification ... 19
3.3. Effects of microcystins on the bacterial growth ... 19
3.4. Effects of microcystins on the bacterial antioxidant system ... 29
4. Discussion ... 33
4.1. Isolates characterization ... 33
4.2. mlr genes ... 33
4.3. Bacterial growth ... 35
4.4. Antioxidant system activity ... 36
ix 6. References ... 40 7. Annexes ... 44 7.1. Growth trial graphics from other isolates ... 44
Figures
Figure 1.1. Microcystin chemical structure (adapted from Neumann et al, 2016)………2 Figure 1.2. The degradative pathway of microcystin LR (adapted from Li et al, 2017) ………..3 Figure 2.1. Schematic representation of the microplate wells inoculation, containing microcystin
exposure in three replicates. Yellow - Blank. Orange - Negative control. Soft green - Microcystin-LR extract concentrations, Blue - Microcystin-RR extract concentrations. Red – Microcystin-YR extract concentrations. Dark green – Pure microcystin-LR concentrations………9
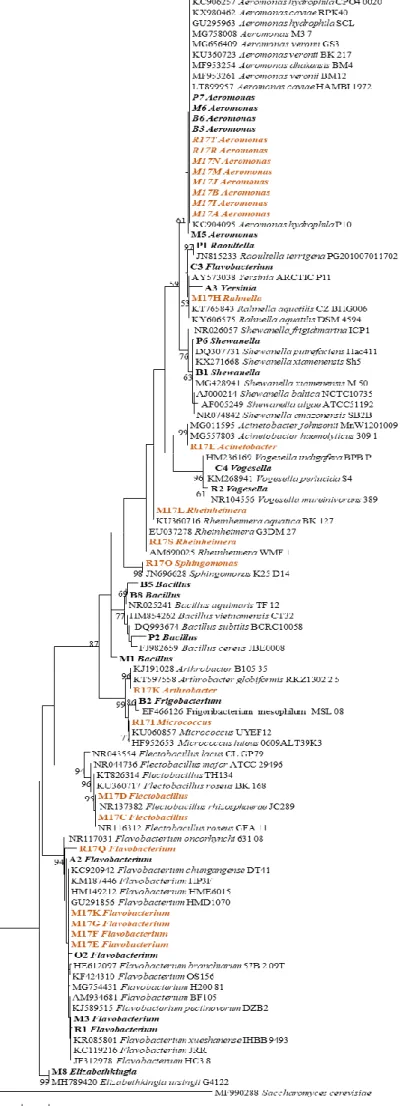
Figure 3.1. Molecular Phylogenetic analysis by Maximum Likelihood method with 1000
Bootstrap. In orange are the bacteria isolated in this study, and in bold are bacteria isolated in INSA-DSA previously to this study………18
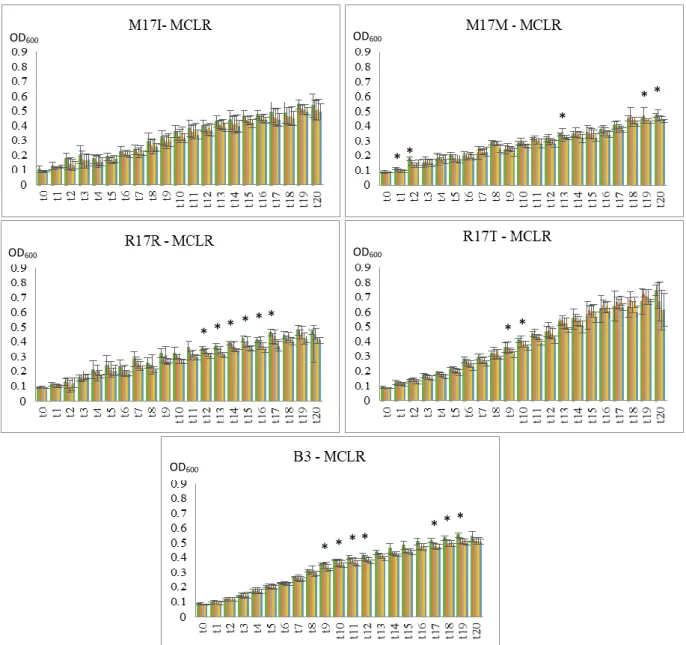
Figure 3.2. Graphs of growth curves from Aeromonas spp. isolates with MCLR. The values are
the mean ± standard deviation of two duplicated assays. (*) indicates a significant difference from the control (p < 0.05). (●) Control bacterial group, (●) 1 nM microcystin, (●) 10 nM microcystin, (●) 100 nM microcystin, (●) 1 µM microcystin ……….……..20
Figure 3.3. Graphs of growth curves from Aeromonas spp. isolates with MCRR. The values are
the mean ± standard deviation of two duplicated assays. (*) indicates a significant difference from the control (p < 0.05). (●) Control bacterial group, (●) 1 nM microcystin, (●) 10 nM microcystin, (●) 100 nM microcystin, (●) 1 µM microcystin……….….….20-21
Figure 3.4. Graphs of growth curves from Aeromonas spp. isolates with MCYR. The values are
the mean ± standard deviation of two duplicated assays. (*) indicates a significant difference from the control (p < 0.05). (●) Control bacterial group, (●) 1 nM microcystin………….…….…21-22
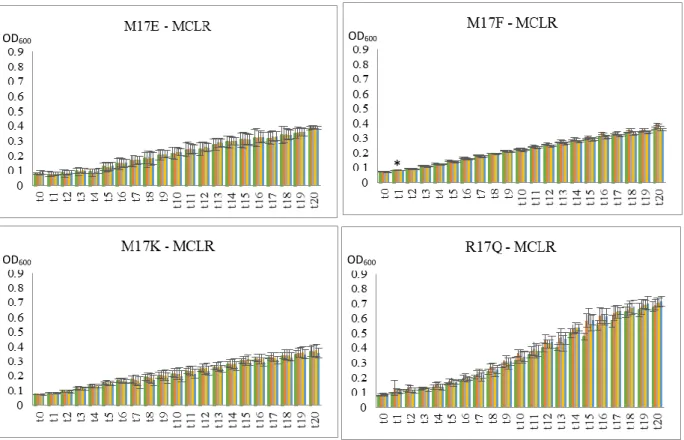
Figure 3.5. Graphs of growth curves from Flavobacterium spp. isolates with MCLR. The values
are the mean ± standard deviation of two duplicated assays. (*) indicates a significant difference from the control (p < 0.05). (●) Control bacterial group, (●) 1 nM microcystin, (●) 10 nM microcystin, (●) 100 nM microcystin, (●) 1 µM microcystin….………..22
Figure 3.6. Graphs of growth curves from Flavobacterium spp. isolates with MCRR. The values
are the mean ± standard deviation of two duplicated assays. (*) indicates a significant difference from the control (p < 0.05). (●) Control bacterial group, (●) 1 nM microcystin, (●) 10 nM microcystin, (●) 100 nM microcystin, (●) 1 µM microcystin…..………..23
Figure 3.7. Graphs of growth curves from Flavobacterium spp. isolates with MCYR. The values
are the mean ± standard deviation of two duplicated assays. (*) indicates a significant difference from the control (p < 0.05). (●) Control bacterial group, (●) 1 nM microcystin………..23
Figure 3.8. Graphs of growth curves from Flectobacillus spp. isolates with MCLR. The values
are the mean ± standard deviation of two duplicated assays. (*) indicates a significant difference from the control (p < 0.05). (●) Control bacterial group, (●) 1 nM microcystin, (●) 10 nM microcystin, (●) 100 nM microcystin, (●) 1 µM microcystin………..24
Figure 3.9. Graphs of growth curves from Flectobacillus spp. isolates with MCRR. The values
are the mean ± standard deviation of two duplicated assays. (*) indicates a significant difference from the control (p < 0.05). (●) Control bacterial group, (●) 1 nM microcystin, (●) 10 nM microcystin, (●) 100 nM microcystin, (●) 1 µM microcystin………..24
Figure 3.10. Graphs of growth curves from Flectobacillus spp. isolates with MCYR. The values
are the mean ± standard deviation of two duplicated assays. (*) indicates a significant difference from the control (p < 0.05). (●) Control bacterial group, (●) 1 nM microcystin………..24
Figure 3.11. Graphs of growth curves from Sphingomonas sp. isolate with the different MCs
x significant difference from the control (p < 0.05). (●) Control bacterial group, (●) 1 nM microcystin, (●)10 nM microcystin, (●)100 nM microcystin, (●)1 µM microcystin…………..25
Figure 3.12. Graphs of growth curves from all isolates with both MCLR extract and pure MCLR.
The values are the mean ± standard deviation of two duplicated assays. (*) indicates a significant difference from the control (p < 0.05).(●)Control bacterial group,(●)1 nM of MCLR extract, (●)1 nM of pure MCLR,(●) 1 µM of MCLR extract,(●)1 µM of pure MCLR...…………26-27
Figure 3.13. Graphs of growth curves from two isolates with MCLR extract, one isolated in 2012
and one isolated in 2017. The values are the mean ± standard deviation of two duplicated assays. (*) indicates a significant difference from the control (p < 0.05). (●) Control bacterial group, (●) 1 nM microcystin, (●) 10 nM microcystin, (●) 100 nM microcystin, (●) 1 µM microcystin……27
Figure 3.14. SOD role in the inhibition of NBT-diformazan formation. From Superoxide
Dismutase Assay Kit, R&S systems®………..32
Figure 4.1. biodegradation pathway suggested by Dziga et al (2017). The products C and D are
cyclic molecules, whereas the tetrapeptide is linear molecule. Colours indicate the regions of biotransformation. Adapted from Dziga et al, 2017………..34
Equations
Equation 4.1. Determine the % inhibition for the test samples………38
Tables
Table 2.1. Primers list used in this study……….7 Table 3.1. Major features of all 22 aquatic bacteria isolated from two Portuguese freshwater
reservoirs: Albufeira of Magos (M) and Roxo (R). (*) - The white scale in the image indicates a length of 10 μm. (**) – molecular identification………..12
Table 3.2. Unspecific genes amplified with mlr primers……….19
Table 3.3.Synopsis of data from all isolates growth trial. growth response (considering results
from all tested concentrations) to different microcystin variants when compared to control. (>) growth in stress condition increases compared to control, (=) growth in stress condition is equal to control, (<) growth in stress condition decreases when compared to control.(●) results with two duplicated assays, (●)results without duplicates ………...…28
Table 3.4. Summary of Catalase activity (U/mg) in the present study and from previous studies
taken at the ASBE-INSA lab……….29
Table 3.5. SODt relative activity. Results obtained in the present study and data from previous
studies………...30
Table 3.6. SOD1 and SOD2 relative activity. Results obtained in the present study and data from
xi
Abbreviations
ASBE Biology and Ecotoxicology lab BSA Bradford protein assay
CAT Catalase
GR glutathione reductase GST glutathione transferase
DSA Environmental Health Department
INSA National Institute of Health Doctor Ricardo Jorge
MCs microcystins
MCLR microcystin-LR (Leucine; Arginine) MLRR microcystin-RR (Arginine; Arginine) MCYR microcystin-YR (Tyrosine; Arginine) NBT- diformazan nitro blue diformazan
OATPs organic anion transport system
OD optical density
PCR polymerase chain reaction PP1 protein phosphatases 1 P2A protein phosphatases 2A ROS reactive oxygen species SOD superoxide dismutase SODt
SOD1
the sum of SOD1 and SOD2
Cu/Zn-SOD
1
1. Introduction
1.1. Cyanobacteria, blooms and its geographical localization
Cyanobacteria are a ubiquitous diverse group of phototrophic prokaryotes which inhabits mainly aquatic ecosystems, such as fresh and brackish water, oceans and hot springs and also terrestrial environment, like soils, deserts and glaciers. They also form symbiotic relations with fungi (lichens) and plants. Thus, cyanobacteria have a large geographical distribution (Sivonen and Jones,1999). In aquatic ecosystems, they live in community with other organisms, such as aquatic heterotrophic bacteria.
In optimal environmental conditions, high temperature and high availability of nutrients, such as phosphorus or nitrates, a rapid increase in cyanobacteria population leads to bloom formation. That is, a high biomass development that may lead to a thick horizontal and vertical layer of cells through the water column. These blooms may lead to oxygen decrease and toxin production by cyanobacteria (commonly nominated as cyanotoxins) causing severe biological impacts in the environment.
Eutrophication is an enrichment of water with limiting resources (like nitrogen and phosphorus) that causes structural changes to the ecosystem, for example: increased production of algae and aquatic plants, hypoxia and dead of fish and other animals. Eutrophication of natural and artificial water bodies has become a big concern over the last years. As high availability of nutrients entering the water course, mainly from runoffs from farm lands combined with waste waters both from urban and industrial activities (Giaramida et al, 2013), has increased, also because of higher temperatures and the construction of water barriers that raise the probability of water eutrophication (Churro et al, 2012).
With it, the occurrence and persistence of blooms of cyanobacteria has increased and raise concerns, as many of these microorganisms can produce toxins.
It is now known that up to 70% of cyanobacterial blooms are toxic (Kazuya et al, 2011). Cyanotoxin contamination of water occurs mostly when the bloom enters in decline and the cyanobacteria cell walls burst, releasing its contents, namely the cyanotoxins, into the water (Blom et al, 2001).
Cyanotoxins are currently divided according to the main target organ: neurotoxins, dermatoxins and hepatotoxins such as microcystins (MCs) and nodularins (Zanchett, 2013). The most widespread and frequently found cyanotoxins are MCs.
Hepatotoxic cyanobacterial blooms have been found practically everywhere in the world, Europe, mainly in Denmark, Finland, France, Germany, Ireland, Norway, Portugal, America in Brazil, Canada, USA, Asia in China and Japan, Africa and Australia (Sivonen and Jones, 1999)
1.2.
Microcystins
MCs represent a high risk to human and animal health, as such molecules have been shown to cause liver damage (MacKintosh et al, 1990) and tumour activity (Zhou et al, 2002). Its effects on eukaryotic cells are already well studied, but on the other hand, the effects of cyanotoxins on heterotrophic bacteria are still scarce (Christoffersen et al,2002).
As previously mentioned, microcystins are one of the main cyanotoxins and microcystin-LR (MCmicrocystin-LR), microcystin-RR (MCRR) and microcystin-YR (MCYR) are the major isoforms and most studied MCs (Li et al, 2009). These are cyclic peptides mostly produced by Microcystis aeruginosa, Planktothrix, Anabaena and Nostoc (Silvonen and Jones, 1999). MCs are especially capable of inhibiting the protein phosphatases 1 and 2A (PP1 and P2A) of both mammals and
2 higher plants (Mackintosh et al, 1990). They are hepatotoxins, meaning that, their main target is the liver by specific binding to the organic anion transport system (OATPs) in hepatocyte cell membranes, inhibiting type 1 and type 2A eukaryotic serine/threonine protein phosphatases (Valerio et al, 2009). They also target cells from the intestines and kidney and can be found in small amounts in the heart, spleen, brain, gonads and stomach (Wang et al, 2008).
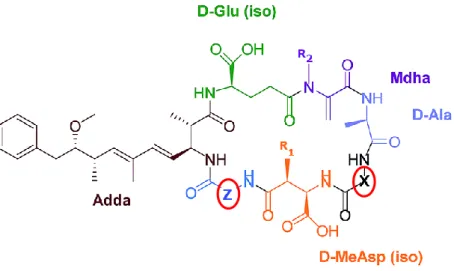
1.2.1. Chemistry and structure
There are up to 90 microcystin isoforms known presently. These vary in the degree of methylation, hydroxylation, epimerization, peptide sequence and toxicity (Pearson et al., 2010).
MC consist in a cyclic heptapeptide of cyclo-D-Ala-R1-D-MeAsp(iso)-R2-Adda-DGlu(iso)-Mdha (figure 1.1). Adda, a β-amino acid characteristic to microcystins and nodularins, is a (2S, 3S, 8S, 9S)-3-amino-9methoxy-2,6,8-trimethyl-10-phenyldeca-4(E),6(E)-dienoic acid, Mdha is N-methyldehydroalanine, and D-MeAsp is erythro-ꞵ-methyl-D-Asp (Imanishi et al, 2005). And two ‘non-conserved’ L-amino acids at positions Z and X (figure 1.1). These L-amino acids differ in isoforms and as amino acids have different polarity, their combination in MCs will affect MCs hydrophobicity. For instance, the MCs variants used in this study all have an arginine (R) on position Z. However, in position X, MCLR has a leucine (L), MCYR has a tyrosine (Y) and MCRR has a arginine (R). As leucine and tyrosine are both hydrophobic amino acids and arginine is a hydrophilic amino acid, MCLR and MCYR are both more hydrophobic than MCRR.
Most microcystins molecular weight vary between 909 and 1115 Da, e.g., MCLR weights 994 Da, MCRR weights 1037 Da and MCYR weights 1094 Da (Duy et al, 2000).
Figure 1.1. Microcystin chemical structure (adapted from Neumann et al, 2016).
1.2.2. Degradation of microcystins
MCs are chemically stable in water bodies due to its stable cyclic structure. This makes them resistant against physical and chemical processes such as high temperatures, above 40 ˚C, or extreme pH, above nine or bellow one (Rastogi et al, 2014;Harada et al, 1996).
Thus, photolysis (chemical reaction in which a chemical compound is broken down by photons) and biodegradation are the best processes known to inactivate cyanotoxins (Chen et al, 2010).
3
1.3. Heterotrophic bacteria
As referred before, cyanobacteria and aquatic heterotrophic bacteria share the same habitat, they represent the basic unit of the trophic web in these environments. Heterotrophic bacteria have a special role in several geochemical cycles in their aquatic habitats (Figueiredo et al., 2007). Therefore, it became important to understand how this tendency of more frequent and intense blooms of toxin producing cyanobacteria will affect these microorganisms. Furthermore, studies show that aquatic heterotrophic bacteria are able to degrade MCs, and a degradative pathway of microcystin-LR (mlr gene cluster) that can degrade MCs has already been described (Bourne et al, 2001).
1.4.
Biodegradation and
MC-degrading aquatic heterotrophic
bacteria
As MC-degrading bacteria were discovered it became important to understand how they work, since such bacteria could be the answer to the water treatment problem.
In 2001, Bourne et al, presented a pathway through which a Sphingomonas strain could degrade MCLR and use it as its sole carbon source. This pathway comprised three hydrolytic enzymes (Mlr A, B, C) (figure 1.2) and a transporter (MlrD). In this pathway it is believed MlrA has the most important function as this enzyme cleaves the aromatic ring of MCLR at the Arg-Adda bond, linearizing the molecule and reducing its toxicity by 160-fold. MlrB and MlrC cleave the molecule further until small peptides and amino acids. These enzymes were then found to belong to the same cluster now named mlr (Bourne et al, 2001).
After the discovery of this gene cluster, it became more usual to identify MC-degrading bacteria by screening the existence of mlrA gene in their genome (Jiang et al, 2011). However, through these last years it has been demonstrated that some bacteria are able to degrade MCs even in absence of mlr cluster (Manage et al, 2009).
These MC-degrading bacteria mlr- displayed a reduced efficiency in degrading MCs when compared to MC-degrading bacteria mlr+, having a longer lag phase and therefore taking more days to degrade the same amount of MCs. A study published in 2017 (Lezcano et al) suggested that in these bacteria lacking the mlr gene cluster, the MC degrading ability may be linked with their xenobiotic metabolism.
For instance, Sphingomonas acidaminiphila strain MC-LTH2 has been shown to degrade not only MCLR and MCRR but also completely degrade other compounds containing an Adda
Figure 1.2. The degradative pathway of microcystin LR (adapted from Li et al, 2017).
4 residue, under various conditions, even though mlrA wasn’t detected, suggesting another path for Adda compounds degradation (Yang et al, 2013).
Recently, Dziga et al (2017) presented a new pathway of MC degradation that does not involve the Mlr pathway. Although, the enzymes involved in the process haven’t yet been identified, the places of cleavage of the MC molecule differ significantly from mlr pathway can be observed. In the pathway, described by Dizga et al, the cleavage of the MC cyclic ring does not occur in the Adda-Arg bond but on the Leu-Asp-Arg bond.
Recalling the concerns about increasing blooms associated with climate change, Morón-López et al (2017) showed in a recent study that not only previous exposure to MCs, but also a higher intake of phosphorus, nitrate, and carbon sources, stimulates the MCs degradation both in mlr+ and alternative biodegradation pathways. Besides testing MC degradation relation with these abiotic factors, they also tested how temperature could affect MC degradation. After testing MC degradation at 22 ˚C, 27 ˚C and 32˚C, they reached the conclusion that temperature isn’t a major factor in MC degradation by alternative biodegradation pathways.
Although mlr- MCs degrading bacteria are not the most efficient ones in MCs degradation, their study is still rather important as it has been shown that these mlr- bacteria are in high abundance in nature (Lezcano et al, 2016) and that members from Sphingomonadales order (the one with more known mlr+ strains so far) are not the most abundant in this aquatic ecosystems (Mou et al, 2013), making it essential to know the full microbial diversity.
1.5. Bacterial antioxidant system and oxidative stress
Studies show that exposure to MCs induce, among other effects, oxidative stress (Li et al, 2009). This exposure may induce the formation of reactive oxygen species (ROS) such as superoxide anion radical (O2●-), hydrogen peroxide (H2O2) and hydroxyl radical (●OH) as a result
of oxidative metabolism (Pflugmatcher, 2004). ROS can cause serious damage in cells such as peroxidation of lipid membranes, genotoxicity, apoptosis and necrosis (Ding and Ong, 2003). Oxidative stress is characterized by a disruption of balance between the oxidative impact and the antioxidant defense system (Pflugmatcher, 2004). This disruption can be imposed on cells in one of three ways: (1) increase of the oxidants generation, (2) decrease in the antioxidant protection, or (3) failure to repair oxidative damage (Vassilakaki and Pflugmacher, 2008).
Under normal circumstances enzymes such as superoxide dismutase (SOD), catalase (CAT), glutathione transferase (GST) and glutathione reductase (GR), would clear ROS before any damage occurred in the cell. However, in case of oxidative stress lipid peroxidation, DNA damage and mutation may occur (Carmel-Harel and Storz, 2000). SOD and CAT were found in almost all organisms and are known as important antioxidant enzymes (Yang et al., 2008).
SOD converts unstable superoxide radicals to H2O2 and molecular oxygen (O2). H2O2 is
harmful to the cell but is the most stable form of ROS, avoiding greater damage to the cell until catalases and peroxidases (hydrogen peroxide removing enzymes) are available to further degrade it (Vassilakaki and Pflugmacher, 2008). In animal cells different types of SOD act in different cell compartments. For instance, there are three types of SOD containing Mn, Fe or Cu and Zn as prosthetic metals (Rahda, 2010). They are SOD1 (cytosolic Cu/Zn-SOD), SOD2 (mitochondrial
Mn-SOD), and SOD3 (extracellular Cu/Zn-SOD) (Trevigen manufacturer’s instructions). The
Fe-SOD and Mn-SOD types occur together in many eubacteria and plants. The Cu-Zn and Mn/Fe types of SOD have quite different mechanisms of action and contain different types and numbers of metal ions (Smith and Doolittle, 1992).
Catalase (CAT) is an enzyme whose function is to decompose H2O2. When H2O2 is in
high concentrations, CAT acts catalytically and converts H2O2 in O2 and H2O (Radha, 2010), but
5 removing H2O2 but oxidizing its substrate (Turkseven et al., 2005). Most of the catalases
characterized until now can be classified in two types: typical catalases and bifunctional catalase-peroxidases and both have been found in bacteria, such as Escherichia coli, Bacillus subtilis and Klebsiella pneumoniae, simultaneously (Kim et al., 1994). The typical CAT is active in a high pH range, i.e. 5-10, and is resistant to ethanol/chloroform (Kim et al., 1994). On the other hand, bifunctional catalase-peroxidase (only detected in bacteria) is pH dependent, with an optimal pH of 6-6.5 and is more sensitive to temperature, ethanol/chloroform and H2O2 then the typical CAT
(Kim et al., 1994).
1.6. Aim of this study
The aim of this study was to examine the effects of three variants of microcystins (MCLR, MCRR, MCYR) on aquatic heterotrophic bacteria that live in the same ecosystem as cyanobacteria, namely:
(1) isolate and identify heterotrophic bacteria from reservoirs where cyanobacterial blooms are observed;
(2) assess microcystins impact on bacterial growth;
(2) observe their impact on enzymes of the antioxidant system (catalase and superoxide dismutase) of these heterotrophic bacteria;
6
2. Methods
2.1. Sampling reservoirs
Sampling was performed on May 24th, October 3rd and October 23rd 2017 using 1000 mL
sterile bottles. The sampling occurred at Albufeira de Roxo, Albufeira de Magos and Albufeira de Roxo, respectively.
Water samples were transported either in a cooler box, in the dark to prevent cyanobacteria growth and the increase of water temperature.
The isolates were named, for this study, with letters and numbers. The first letter represented the place of isolation (M – from Albufeira de Magos, R – from Albufeira de Roxo). The number, 17, represents the year of isolation, therefore, isolates are either M17 or R17. To differentiate each isolate from the same reservoir, another letter was added to the end, for instance the first isolate from Albufeira of Magos was named M17A.
2.2. Isolation of bacteria
The bacteria were isolated from water samples from each reservoir by plating beads method, where 100 µL of each sample was spread using sterile glass beads in non-selective medium plates, Reasoner’2A medium (R2A medium) with 1.5% agar. The plates were then incubated at 20 ˚C ± 2 ˚C in the dark, until colonies were observed, for two days (R17E; R17I; R17K; R17O; R17Q-R17T), three days (M17A-F) and six days (M17G-N).
Among the colonies present in the plates, white and mucus (possible Aeromonas) and strong yellow pigmentation (possible Flavobacterium) were preferably selected, however, some other (nine isolates) with pink and softer yellow pigmentation were also selected.
2.3. Phenotypic characterization of the isolated bacteria
Bacterial isolates were characterized according to their colony color and texture at macroscopic level and cell shape and gram staining at microscopic level.
In order to classify the isolates according to their Gram group, microscope slides of each isolated bacteria were prepared using an automated Gram stainer system (Previ™ color Gram, Biomerieux). This standardized coloration improved bacteria differentiation in comparison with manual staining method.
The microscope slides were also used to assess bacterial shape. The isolates were assigned to the following possible shapes: coccus, bacillus and coccobacillus (Cabeen and Jacobs-Wagner, 2005). Cell observation was performed under an Olympus BX60 fluorescence microscope coupled with a CCD camera (Olympus DP11).
2.4. Molecular analyses
2.4.1. Molecular identification of the isolates
Bacterial DNA extraction was performed with Invisorb®Spin Plant Mini Kit (INVITEK)
following the manufacturer’s instructions. The nucleic acids concentration and purity was assessed using a NanoDrop 1000 Spectrophotometer (Thermo Scientific) using 1.5 μL of each sample. Then an aliquot of all samples was prepared to achieve a DNA concentration of 50 ng/µL. Aliquots of 3 μL of template DNA were used for PCR amplification of 16S rRNA gene. PCR was performed in a 25 μL reaction mixtures containing 1x PCR buffer (Invitrogen), 0.05 mM dNTPs, 0.52 mM of each primer, 0.05% W-1 detergent, 3 mM MgCl2 (Invitrogen) and 0.06 U of Taq
polymerase (Invitrogen). The universal bacterial primers 16S_8F and 16S_1492R were designed by Chaves (2005) and the expected amplified fragment has about 1500bp of length. The reactions
7 were performed in a Tpersonal thermocycler (Biometra®) with a hot lid (95 ˚C). The temperature profile had five steps, an initial denaturation (94˚C for 5 min); 35 cycles of denaturation (94 ˚C for 45 s), annealing temperature (49 ˚C for 45 s), extension (72 ˚C for 50 s); and a final extension step (72 ˚C for 5 min). The PCR products were separated by electrophoresis in a 1% (w/v) agarose gel at 85 V for 45 min, using TBE 1x as buffer. GelRed, which is a safer fluorescent nucleic acid dye than ethidium bromide, was incorporated in the gel to allow the PCR amplicons visualization. The gel image was acquired using a gel transilluminator system (UVITEC).
2.4.2. Microcystin degradation genes (mlr) amplification
Bacterial DNA extraction was performed as described in the previous section. Aliquots of 3 μL of template DNA were used for PCR amplification of the different mlr genes. PCRs were performed in a 25 μL reaction mixtures containing 1x PCR buffer (Invitrogen), 0.05 mM dNTPs, 0.52 μM of each primer, 0.05% W-1 detergent, 3 mM MgCl2 (Invitrogen) and 0.06 U of Taq
polymerase (Invitrogen). The primers presented below in table 2.1 were designed by Saito et al, 2003; Ho et al 2007; Yang et al 2014. The reactions were performed in a Tpersonal thermocycler (Biometra®) with a hot lid (95 ˚C). The temperature profile included an initial denaturation (94 ˚C for 5 min); 35 cycles of denaturation (94 ˚C for 30 s), annealing temperature (specified to each primer pair and presented in table 2.1), extension (72 ˚C for 60 s); and a final extension step (72 ˚C for 5 min). The PCR products were separated by electrophoresis in a 1% (w/v) agarose gel at 85 V for 45 min, using TBE 1x as buffer. GelRed was incorporated in the gel to allow the PCR amplicons visualization. The gel image was acquired using a gel transilluminator system (UVITEC).
Table 2.1. Primers list used in this study
2.4.3. Sequencing
To prepare the PCR products for sequencing, two steps were performed. The first had the purpose of neutralizing/removing unincorporated primers and nucleotides. Thus, illustra™ ExoProStar™ 1-Step Kit was utilized by adding 2 µL of illustra™ ExoProStar 1-Step to 5 µL of PCR mix, which was incubated for 15 min at 37 ˚C and then incubated at 80 ˚C for 15 min (the product was then stored at -20 ˚C until the sequencing step). The second step was a pre-sequencing reaction using BigDye terminator, it was performed in a 10 μL reaction mixture
Primer Sequence (5' - 3') Annealing
temperature Fragment size Reference mlrAF_Saito 5´-GACCCGATGTTCAAGATACT- 3´ 47 ˚C 807 bp Saito et al, 2003 mlrAR_Saito 5´-CTCCTCCCACAAATCAGGAC- 3´ mlrBf1_Ho 5´-CGACGATGAGATACTGTCC- 3´ 47 ˚C 448 bp Ho et al, 2007 mlrBr1_Ho 5´-CGTGCGGACTACTGTTGG- 3´ mlrCf1_Ho 5´-TCCCCGAAACCGATTCTCCA- 3´ 59 ˚C 666 bp Ho et al, 2007 mlrCr1_Ho 5´-CCGGCTCACTGATCCAAGGCT- 3´ mlrDf1_Ho 5´-GCTGGCTGCGACGGAAATG- 3´ 59 ˚C 671 bp Ho et al, 2007 mlrDr1_Ho 5´-ACAGTGTTGCCGAGCTGCTCA- 3´
8 containing 1 µL of BigDye; 1 µL of BigDye Buffer (10x); 0.4 µL of primer (for the desired gene); 2 µL of purified PCR product, and 5.6 µL ultrapure water. The PCR temperature profile was constituted by 25 cycles of 96 ˚C for 10 s, 50 ˚C for 5 s and 60 ˚C for 4 s. The samples were sent for sequencing at the UTI-DGH Laboratory of INSA. In some bacterial isolates, there were some nonspecific PCR products amplification that could not be eliminated using column-based purification kits without concomitant lost of the amplicon of interest. Therefore, in those cases the ilustra™ ExoProStar™ 1-Step step wasn’t performed, and the bands of interest were excised from the gel. In order to do so, the specific bands were cut from the 1% (w/v) agarose gel with a scalpel blade under UV light and purified with ilustra™ GFX™ PCR DNA and Gel Band Purification Kit, according to the manufacturer’s instructions.
Bacterial sequences obtained were corrected using BioEdit program (Hall, 1999) and afterwards compared to the GenBank nucleotide data library using Basic Local Alignment Search Tool (BLAST) software (Altschul et al., 1990) at the National Center of Biotechnology Information Website (http://blast.ncbi.nlm.nih.gov/Blast.cgi). This step allowed to determine the sequences with higher similarity and other close sequences to be selected for the posterior phylogenetic analyses. Furthermore, sequences from previous studies (Miguéns, 2013; Pinto, 2016) were also used.
2.4.4. Phylogenetic Analyses
An alignment of approximately 800 bp nucleotides of the 16S rRNA gene from 23 isolates was used in the phylogeny. Alignments were made with BioEdit Sequence Alignment Editor version 7.0 (Hall, 1999) and visually corrected.
Phylogenetic trees were constructed based on Maximum likelihood statistical method with a bootstrap of 1000 replications using Mega6 software version 1.0 (Tamura, 1993). The sequence from Saccharomyces cerevisiae was used as outgroup.
2.5. Bacterial Cell Growth
Bacterial growth was assessed in a 96-well microplate bioassay. Each isolate was inoculated in Nutrient Broth medium and each of the three variants of microcystins (MCLR, MCRR and MCYR) purified extracts, or a pure MCLR was added into the culture medium to yield a final concentration of 1 nM, 10 nM, 100 nM and 1 μM (MCLR and MCRR extracts); 1 nM and 1 μM (MCLR pure) and 1 nM of MCYR. For the MCYR extracts, it was only possible to test one concentration (1 nM) due to stock limitation in the laboratory. The concentrations used in the present study were selected from previous studies held at the DSA-ASBE (INSA).
Pre-inoculums were prepared in 20 mL of Nutrient Broth medium in 100 mL Erlenmeyer flasks. Cells were incubated overnight at 20 ˚C, on Orbital Shaker SO3 at 300 rpm. The growth experiments were initiated the day after. Pre-inoculums initial optical density (OD) was measured in a colorimeter 257 (Sherwood) at 660 nm wavelength. Microplates were inoculated as illustrated in figure 2.1. Thus, the blank was inoculated with 200 μL of Nutrient Broth medium. Each MC three replicates were inoculated, with an initial cell density of 0.1 and a final volume of 200 µL (nutrient broth + cell suspension + 20 µL of toxin). The control condition (negative control) was inoculated with nutrient broth + cell suspension (OD i of 0.1). The microplates were incubated at
20 ˚C with stirring.
Optical densities of the isolated bacteria on the microplate assay were measured at 600 nm, each 30 min during ten hours, using a microplate absorbance Multiskan Ascent Thermo Labsystems, with a previous slow shaking for 5 s prior to measurement. Growth curves of each isolate were made with the optical densities measurements, with Excel™ program version 16.0
9 (Microsoft Office™). The results were expressed as means ± SD. All data were evaluated by F test and student´s t test with a significant level of p < 0.05 (Fowler, 1998) to verify significant differences.
2.6. Determination of activities of antioxidant system enzymes
The oxidative stress was assessed for some representative isolates with the determination of the activity of two antioxidant system enzymes, catalase (CAT) and superoxide dismutase (SOD). The isolates were chosen taking into account some factors, Sphingomonas paucimobilis 594196 (isolated in May 2017) was chosen since microcystins degradation was primarily identified in the Sphingomonas genera. The isolates M17C and M17D belong to the same genera, Flectobacillus, but one presents the mlr cluster and the other doesn’t, so both were tested to see if there were differences between them. Besides these three, three Flavobacterium and three Aeromonas where chosen since both genera were favored in the initial selection of this work, with allow the recovery of several isolates to compare. Thus, to determine enzymatic activities, the control group (not exposed to MCs) and cells exposed to microcystins at a concentration of 10 nM of MCLR extract, or MCRR extract or purified MCLR, were grown overnight in 15 mL Nutrient Broth medium during 12 hours. The small amount of MCYR made it impossible to test this variant in this trial. The pellets, primarily divided in two tubes, (one with 10 mL for the SOD trial and other with 5 mL for the CAT trial) were obtained by centrifugation at 4 ˚C for 20 min at 4500 rpm, washed with PBS pH 7.4 (1x) (Gibco®), and kept at ‐ 80 ˚C until use. To extract the proteins, the pellets were thawed in ice and resuspended in 300 µL of sodium phosphate buffer 50 mM. Cells were disrupted using 100 μL microspheres (Sigma) with six alternate cycles of 1 min in ice and 1 min vortex.
Figure 2.1. Schematic representation of the microplate wells inoculation, containing microcystin exposure in three replicates. Yellow - Blank. Orange - Negative control. Soft green - Microcystin-LR extract concentrations, Blue - Microcystin-RR extract concentrations. Red – Microcystin-YR extract concentrations. Dark green – Pure microcystin-LR concentrations. Grey – water.
10 For SOD trial, ice-cold chloroform/ethanol was added to the samples, and mixed for 30 s. By using this technique, many proteins precipitated during cellular debris removal.
Cellular debris were removed by centrifugation for 20 min at 9000 rpm, the supernatant was recovered (note: SOD samples formed 2 phases – as icecold chloroform/ethanol was added – and the aqueous phase (on top) was recovered without touching the interphase).
The amount of total protein in the samples was estimated by Bradford method in microplate, where the absorbance of the samples was read at 600 nm and compared against a standard curve of a standard protein solution (BSA), with the following concentrations 0.125, 0.25, 0.50, 0.75, 1.00, 1.50 and 2.00 mg/mL. The samples were prepared according to the Quick Start™ Bradford Protein Assay Manual instructions (BioRad).
CAT activity was measured by the decomposition of H2O2, which was monitored directly
by the absorbance decrease at 240 nm. The reaction mixture of 3 mL contained 50 mM sodium phosphate buffer (pH 7.0); 1 mL of 0.2% H2O2 and 5 µg or 10 µg or15 μg of the enzymatic extract
of each isolate.
SOD activity of Cu/Zn-SOD (SOD1) and Mn-SOD (SOD2) was measured by the
inhibition of the rate of formation of nitro blue diformazan (NBT-diformazan) using the Superoxide Dismutase assay kit (Trevigen) according to the manufacturer´s instructions. To assess SOD2 activity, an aliquot of 100 µL of sample was separated to a new Eppendorf and KCN was added to a final concentration of 2 mM. The cyanide ion inhibits more than 90% of SOD1
activity, according Superoxide dismutase assay kit (Trevigen) manufacturer’s instructions. To determinate the absorption of SOD activity, 5 μg of the enzymatic extract of each isolate was used in the reaction mixture and followed in a spectrophotometer (UNICAM UVNis Spectrometer UV4), to determine the rate at 550 nm.
11
3. Results
3.1. Characterization and identification of the heterotrophic bacteria isolated
The colonies’ color and texture were macroscopically verified, and summarized in table 3.1. The bacterial isolates assigned as either white, pale white, pale yellow, yellow or pink regarding color and as either mucous, very mucous or slightly mucous regarding texture.
The bacterial shape was assessed in a microscopic slide with a suspension of bacterial cells from each isolate. They were classified into coccus, bacillus, coccobacillus and long rods (table 3.1).
Furthermore, the isolates were divided into Gram-positive and Gram-negative using a light microscope to observe the microscope slides prepared in the automatized system Previ™ color Gram (Biomerieux) (table 3.1).
Bacterial sequences were corrected with BioEdit software (Hall, 1999) and then compared in BLAST software at https://blast.ncbi.nlm.nih.gov/Blast.cgi. In figure 3.1 is the phylogenetic tree produced in MEGA6 (Tamura et al, 2013), to further assess the isolates phylogenetic position and obtain their molecular identification, which is also showed in table 3.1.
Note: some previously isolated and identified bacterial isolates (not present in table 3.1)
were also used in this study. Namely, Sphingomonas sp. isolate 594196; Aeromonas sp. isolate B3 (Miguéns, 2013); Aeromonas sp. isolate M6 (Miguéns, 2013); Flavobacterium sp. isolate M3 and Shewanella isolate B1 (Miguéns, 2013).
12
Table 3.1. Major features of all 22 aquatic bacteria isolated from two Portuguese freshwater reservoirs: Albufeira of Magos (M) and Roxo (R). (*) - The black scale in the image indicates a length of 10 μm.
Isolate Molecular
identification Macroscopic image
Colony coloration
Morphologic
features Microscopic image*
Gram
staining Cellular shape
M17A Aeromonas sp. Pale white Mucous Gram - Cocobacilli
M17B Aeromonas sp. Pale white Mucous Gram - Cocobacilli
M17C Flectobacillus
13
Isolate Molecular
identification Macroscopic image
Colony coloration
Morphologic
features Microscopic image*
Gram
staining Cellular shape
M17D Flectobacillus
sp. Pink Mucous Gram - Long rods
M17E Flavobacterium
sp. Yellow Mucous Gram - Bacilli
M17F Flavobacterium
sp. Yellow Mucous Gram - Bacilli
M17G Flavobacterium
sp. Yellow
Slightly
14
Isolate Molecular
identification Macroscopic image
Colony coloration
Morphologic
features Microscopic image*
Gram
staining Cellular shape
M17H Rahnella
aquatilis White Mucous Gram - Cocci
M17I Aeromonas sp. White Slightly
mucous Gram - Cocobacilli
M17J Aeromonas sp. White Slightly
mucous Gram - Cocobacilli
M17K Flavobacterium
15
Isolate Molecular
identification Macroscopic image
Colony coloration
Morphologic
features Microscopic image*
Gram
staining Cellular shape
M17L Rheinheimera
aquatica Yellow Very mucous Gram - Bacilli
M17M
Aeromonas sp.
White Slightly
mucous Gram - Cocobacilli
M17N Aeromonas sp. White Slightly
mucous Gram - Cocobacilli
R17E Acinetobacter
16
Isolate Molecular
identification Macroscopic image
Colony coloration
Morphologic
features Microscopic image*
Gram
staining Cellular shape
R17I Micrococcus
luteus White Mucous Gram + Cocci
R17K Arthrobacter
globiformis Pale yellow
Slightly
mucous Gram + Cocci
R17O Sphingomonas
sp. Yellow Mucous Gram - Bacilli
R17Q Flavobacterium
sp. Yellow
Slightly
17
Isolate Molecular
identification Macroscopic image
Colony coloration
Morphologic
features Microscopic image*
Gram
staining Cellular shape
R17R Aeromonas sp. White Mucous Gram - Cocobacilli
R17S Rheinheimera
aquatica Yellow Very mucous Gram - Bacilli
18
Figure 3.1. Phylogenetic analysis obtained using Maximum Likelihood method with 1000 Bootstrap. Saccharomyces cerevisiae was used as outgroup. In orange are the bacteria isolated in this study, and in bold are bacteria isolated in DSA-ASBE previously to this study. Each isolate only has the genera identification.
19
3.2. mlr gene identification
The presence of mlr gene cluster was screened in all isolates. All the genes of mlr cluster (mlrA; mlrB; mlrC and mlrD) were only identified in isolate M17C. However, none of the other isolates presented mlr genes amplification. Some other amplifications were verified, but after sequencing, Blastn (nucleotide-nucleotide) and Blastx (nucleotide-protein) verification, it was confirmed that these weren’t, in fact, mlr or possible related genes (data showed in table 3.2).
Table 3.2. Unspecific genes amplified with mlr primers. (ND – not detected)
mlrA mlrB mlrC mlrD
Similarity with
Aeromonas
M17I ND Chromosome partitioning
protein ParB ND
Non-specific amplification M17J ND Non-specific amplification ND Non-specific amplification
M17N ND ND ND Non-specific
amplification
R17R ND ND ND Non-specific
amplification
Acinetobacter R17E DNA-binding
response regulator ND ND MFS – transporter
Rahnella M17H ND MATE family afflux
transporter ND ND
Rheinheimera M17L ND No significant similarity
found ND ND
Shewanella B1 Potassium
transporter ND ND ND
Sphingomonas 594196 ND Hypothetical protein ND ND
3.3. Effects of microcystins on the bacterial growth
The isolates were exposed to four different concentrations (1 nM, 10 nM, 100 nM and 1 μM) of two microcystin variant extract (MCLR, MCRR), one concentration of MCYR (1 nM), and to two concentrations of pure MCLR (1 nM and 1 μM). Several behaviors were displayed such as a growth reduction, growth increase or no growth effect and different effects according to each concentration of the same variant when compared to the control group, where no microcystins were added.
Initial tests showed that some of the studied bacteria took too many hours to reach stationary phase, so in order to make this study possible a period was defined for the trial: 10 hours from t0 to t20 (interval between tx and tx+1 was 30 min). All graphics presented in the growth
trial results were the mean of two biological replicates (duplicates). These duplicates were performed in different days with different pre-inoculums. The (*) indicates a significant difference between growth with MC stress and control (p<0.05). Yet, in some measured times, the difference between stress condition and control condition, didn't translate into a statistically significant difference due to biological replicates differences.
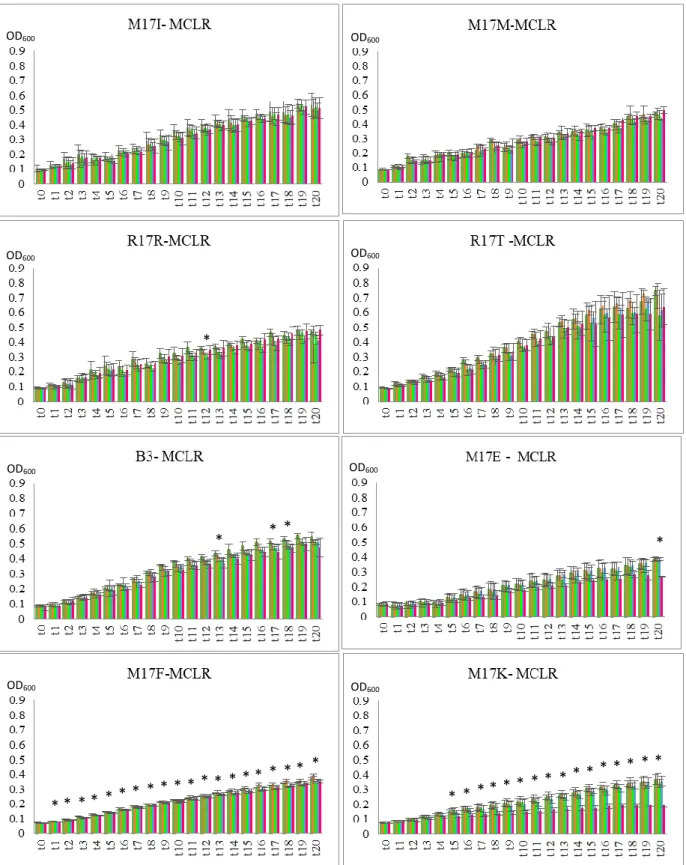
In Aeromonas spp. isolates, M17I, M17M, R17R, R17T and B3 (figure 3.2; 3.3; 3.4) most stress provoked a slight decrease in growth but, only in M17M with 1 µM (t19, t20), R17R with
100 nM and 1 µM (after t12) and B3 with 1000 nM (after t9) with MCLR extract, and in R17R
with MCRR extract (100 nM – after t9; and 1000 nM – t20) and MCYR extract (after t12) the
decrease in growth was statistically significant (p < 0.05). The growth of R17T, when exposed to MCRR, shows a different response to the stress, as it shows a slight increase in growth (not statistically significant).
20
Figure 3.3. Graphs of growth curves from Aeromonas spp. isolates with MCRR over time (t0-t20). The values are the
mean ± standard deviation of two duplicate assays. (*)indicates a significant difference from the control (p < 0.05). (●) Control bacterial group, (●) 1 nM microcystin, (●) 10 nM microcystin, (●) 100 nM microcystin, (●) 1 µM microcystin.
Figure 3.2. Graphs of growth curves from Aeromonas spp. isolates with MCLR over time (t0-t20). The values are the
mean ± standard deviation of two duplicate assays. (*)indicates a significant difference from the control (p < 0.05). (●) Control bacterial group, (●) 1 nM microcystin, (●) 10 nM microcystin, (●) 100 nM microcystin, (●) 1 µM microcystin.
* * * * * * * * * * * * * * * * * * * * * OD600 OD600 OD600 OD600 OD600 OD600 OD600
21
Figure 3.3. (continuation). Graphs of growth curves from Aeromonas spp. isolates with MCRR over time (t0-t20). The
values are the mean ± standard deviation of two duplicate assays. (*)indicates a significant difference from the control (p < 0.05). (●) Control bacterial group, (●) 1 nM microcystin, (●) 10 nM microcystin, (●) 100 nM microcystin, (●) 1 µM microcystin.
Figure 3.4. Graphs of growth curves from Aeromonas spp. isolates with MCYR over time (t0-t20). The values are the
mean ± standard deviation of two duplicate assays. (*)indicates a significant difference from the control (p < 0.05). (●) Control bacterial group, (●) 1 nM microcystin.
* * * * * * * * * * * * * OD600 OD600 OD600 OD600 OD600 OD600 OD600
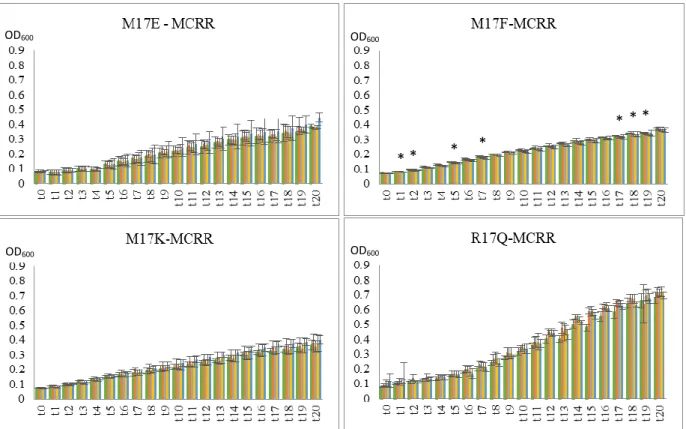
22 In Flavobacterium spp. isolates, M17E, M17F, M17K and R17Q, the results diverged more (figure 3.5; 3.6; 3.7). For instance, M17F exposed to MCLR extract shows a slight increase in growth when compared to control conditions both with 1 nM and 10 nM (not statistically significant) and no difference at 100 nM or 1 µM. When exposed to MCRR there is a slight decrease in growth, with significantly statistic meaning (p < 0.05), at a 100 nM concentration starting at point t17, and the same occurs with the exposure to MCYR. When exposed to
microcystins extract, M17E showed no relevant difference in growth compared to control with all the three MC variants. M17K and R17Q appear to have no relevant difference in growth when exposed to MCYR extract and also MCLR and MCRR extract (M17K). However, when exposed to MCLR or MCRR extract R17Q seems to reveal a slight increase in growth.
Figure 3.4. (Continuation) Graphs of growth curves from Aeromonas spp. isolates with MCYR over time (t0-t20). The
values are the mean ± standard deviation of two duplicate assays. (*)indicates a significant difference from the control (p < 0.05). (●) Control bacterial group, (●) 1 nM microcystin.
Figure 3.5. Graphs of growth curves from Flavobacterium spp. isolates with MCLR over time (t0-t20). The values are
the mean ± standard deviation of two duplicate assays. (*)indicates a significant difference from the control (p < 0.05). (●) Control bacterial group, (●) 1 nM microcystin, (●) 10 nM microcystin, (●) 100 nM microcystin, (●) 1 µM microcystin. * * * * * * * * * * OD600 OD600 OD600 OD600 OD600
23
Figure 3.6. Graphs of growth curves from Flavobacterium spp. isolates with MCRR over time (t0-t20). The values are
the mean ± standard deviation of two duplicate assays. (*)indicates a significant difference from the control (p < 0.05). (●) Control bacterial group, (●) 1 nM microcystin, (●) 10 nM microcystin, (●) 100 nM microcystin, (●) 1 µM microcystin.
.
Figure 3.7. Graphs of growth curves from Flavobacterium spp. isolates with MCYR over time (t0-t20). The values are
the mean ± standard deviation of two duplicate assays. (*)indicates a significant difference from the control (p < 0.05). (●) Control bacterial group, (●) 1 nM microcystin.
* * * * * * * * * * * * * * * 1 * OD600 OD600 OD600 OD600 OD600 OD600 OD600 OD600
24 In Flectobacillus spp. isolates (figure 3.8; 3.9; 3.10), M17C and M17D, there were no significant differences between the control condition and the stress provoked by any of the microcystins extract, although, in M17C with MCLR extract at 1 nM, M17C appears to have a slightly improved growth (which isn’t statistically relevant).
Figure 3.8. Graphs of growth curves from Flectobacillus spp. isolates with MCLR over time (t0-t20). The values are the
mean ± standard deviation of two duplicate assays. (*)indicates a significant difference from the control (p < 0.05). (●) Control bacterial group, (●) 1 nM microcystin, (●) 10 nM microcystin, (●) 100 nM microcystin, (●) 1 µM microcystin.
Figure 3.9. Graphs of growth curves from Flectobacillus spp. isolates with MCRR over time (t0-t20). The values are the
mean ± standard deviation of two duplicate assays. (*)indicates a significant difference from the control (p < 0.05). (●) Control bacterial group, (●) 1 nM microcystin, (●) 10 nM microcystin, (●) 100 nM microcystin, (●) 1 µM microcystin.
Figure 3.10. Graphs of growth curves from Flectobacillus spp. isolates with MCYR over time (t0-t20). The values are
the mean ± standard deviation of two duplicate assays. (*)indicates a significant difference from the control (p < 0.05). (●) Control bacterial group, (●) 1 nM microcystin.
OD600 OD600
OD600 OD600
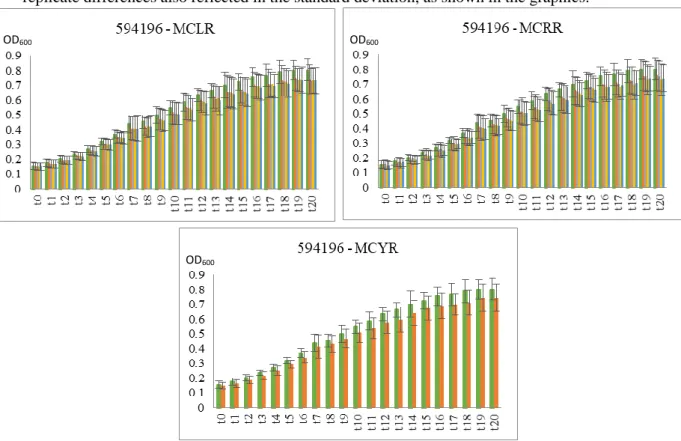
25 In Sphingomonas sp. isolate 594196 (figure 3.11), all growth conditions seem to be affected by the microcystin extracts. However, none is statistically significant, due to biological replicate differences also reflected in the standard deviation, as shown in the graphics.
In figure 3.12. it can be observed the graphics representing the growth response to two concentrations of pure MCLR (1 nM and 1µM) in contrast to MCLR extract and control condition. The stimuli provoked by pure MCLR seems to be more aggressive than MCLR extract, causing a decrease in growth except in isolates M17F and M17M where the response is similar, R17R where a slight increase of growth is observed and in 594196 whose growth was already affected by MCLR extract.
The growth with 1 nM pure MCLR medium doesn’t appear to cause effects in growth when compared to the control condition except in isolates 594196, M17E, M17F, M17M, R17T and B3, (and with significantly statistic meaning (p < 0.05) for M17F). On the other hand, at 1 µM, pure MCLR seems to affect most of the tested bacteria causing a decrease in growth, these decrease in growth has significant statistic meaning (p < 0.05) at M17C (t4 to t20), M17E (t20),
M17K (t5 to t20) and B3 (t7 to t20). M17M and R17R appears not to be affected or be slightly
affected by 1 µM of pure MCLR.
Figure 3.11. Graphs of growth curves from Sphingomonas sp. isolate with the different MCs variants over time (t0-t20).
The values are the mean ± standard deviation of two duplicate assays. (*)indicates a significant difference from the control (p < 0.05). (●) Control bacterial group, (●) 1 nM microcystin, (●) 10 nM microcystin, (●) 100 nM microcystin, (●) 1 µM microcystin.
OD600 OD600
26
Figure 3.12. Graphs of growth curves from all isolates with both MCLR extract and pure MCLR over time (t0-t20). The
values are the mean ± standard deviation of two duplicated assays. (*) indicates a significant difference from the control (p < 0.05). (●) Control bacterial group, (●) 1 nM of MCLR extract, (●) 1 nM of pure MCLR, (●) 1 µM of MCLR extract, (●) 1 µM of pure MCLR. * * * * * * * * * * * * * * * * * * * * * * * * * * * * * * * * * * * * * * * * * OD600 OD600 OD600 OD600 OD600 OD600 OD600 OD600