Journal of Environmental
Analysis and Progress
Journal homepage: www.jeap.ufrpe.br/10.24221/jeap.5.2.2020.2828.194-206 ISSN: 2525-815X
Modeling runoff response to land-use changes using the SWAT model in the
Mundaú watershed, Brazil
Carolyne Wanessa Lins de Andrade Farias
a, Suzana Maria Gico Lima Montenegro
b, Abelardo
Antônio de Assunção Montenegro
c, José Romualdo de Sousa Lima
d, Raghavan Srinivasan
e, Charles
Allan Jones
ea Universidade Federal Rural de Pernambuco-UFRPE, Unidade Acadêmica de Serra Talhada-UAST. Av. Gregório Ferraz
Nogueira, S/N, José Tomé de Souza Ramos, Serra Talhada, Pernambuco, Brasil. CEP: 56909-535. E-mail: [email protected].
b Universidade Federal de Pernambuco-UFPE. Av. Prof. Moraes Rego, 1235, Cidade Universitária, Recife, Pernambuco,
Brasil. CEP: 50670-901. E-mail: [email protected].
c UFRPE. Rua Dom Manuel de Medeiros, S/N, Dois Irmãos, Recife, Pernambuco, Brasil. CEP: 52171-900. E-mail:
d Universidade Federal do Agreste de Pernambuco-UFAPE. Avenida Bom Pastor, S/N, Boa Vista, Garanhuns,
Pernambuco, Brasil. CEP: 55292-270. E-mail: [email protected].
e Texas A&M University, College Station, Texas 77843, US. E-mail: [email protected]; [email protected].
A R T I C L E I N F O
Received 24 Oct 2019 Accepted 20 May 2020 Published 28 May 2020
A B S T R A C T
Land-use change has a significant influence on runoff process of any watershed, and the deepening of this theme is essential to assist decision making, within the scope of water resources management. The study was conducted for Mundaú River Basin (MRB) using the Soil and Water Assessment Tool (SWAT) model. The study aims to assess the issue of land-use change and its effect on evapotranspiration, surface runoff, and sediment yield. Input data like land use, topography, weather, and soil data features are required to undertake watershed simulation. Two scenarios of land use were analyzed over 30 years, which were: a regeneration scenario (referring to use in the year 1987) and another scene of degradation (relating to use in the year 2017). Land use maps for 1987 and 2017 were acquired from satellite images. Overall, during the last three decades, 76.4% of forest was lost in the MRB. The grazing land increased in 2017 at a few more than double the area that existed in 1987. Changes in land use, over the years, resulted in an increase of about 37% in the water yield of MRB. Changes have led to increased processes such as surface runoff and sediment yield and in the decrease of evapotranspiration. The spatial and temporal distribution of land use controls the water balance and sediment production in the MRB.
Keywords: Land use, water balance, SWAT model, Mundaú watershed.
Introduction
In the last decades, around the world, there has been a severe change in land-use and, consequently, modification in the hydrological and ecological behaviors (Khare et al., 2017). Generally, land-use change has been carried out by human activities (Sajikumar & Remya, 2015). Agriculture increases, deforestation, intensive grazing, and urbanization are some examples of human activities that resulted in a land-use change (Worku et al., 2017).
In a watershed, alteration in land use is essential because of its effect on the hydrological and ecological characteristics within the area.
Land-use change is one of the leading causes of the surface runoff variation in a watershed due to the alterations caused in the precipitation interception, evapotranspiration, and soil hydraulic conductivity (Munoz-Villers & McDonnell, 2013; Yan et al., 2013). The quantity, intensity, and velocity of runoff increased due to a continuous increase in deforestation, agriculture, and other anthropogenic practices (Booth, 1991; Abbas et al., 2015).
Knowledge about the influence of land-use change in a watershed plays a fundamental role in the governments to articulate policy options to minimize its effects (Worku et al., 2017). In developing countries such as Brazil, whose
economies are mostly dependent on agriculture and with rapid human population growth, land-use changes are widespread (Tufa, Abbulu & Srinivasarao, 2014). Deforestation – mainly the conversion of forest to agricultural land – has a high rate of both Brazil and Indonesia, which had the highest net loss of forest in the 1990s (FAO, 2010).
The Mundaú River Basin (MRB), which is a representative watershed of the Brazilian Northeast, has experienced many land-use transformations over the years. The basin was initially formed by typical vegetation (Atlantic Forest and Caatinga), which was decreased over time, being replaced by pasture and agriculture, mainly sugarcane. The urban expansion was also one of the causes of the transformations that occurred in MRB.
In this context, supporting tools to study the impacts of land-use change on water quantity and quality are essential to the implementation of policies and assist in the management of water resources. Researchers in various fields have required to improve and implement multiple instruments, including hydrological models, such as the Soil and Water Assessment Tool (SWAT) (Bressiani et al., 2015).
The model was developed to analyze the impacts of land-use changes on water runoff, sediment yield, and water quality in large watersheds (Arnold et al., 1998). SWAT is a versatile model that considers different hydrological and agronomic components and has been applied by many governmental and private institutions, like universities and other institutions interested in supporting decision-making in the management of water resources (Bressiani et al., 2015).
In Brazil and the world, several studies have been developed aiming to verify the effects of the land-use changes on the runoff (Coelho et al., 2014; Rodrigues et al., 2015; Pereira et al., 2016; Zhang et al., 2016; Kundu et al., 2017; Marhaento et al., 2017; Fontes Júnior & Montenegro, 2019) and sediment yield (Anaba et al., 2017; Blainski et al., 2017; Worku, Khare & Tripathi, 2017). Coelho et al. (2014) detailed analysis of spatial and temporal dynamics of land use and occupation of the stream São Paulo watershed, located in the semiarid region of Pernambuco State, from 1991 to 2010. Rodrigues et al. (2015) analyzed the dynamics of flow and water flow in the Pará River Basin, Minas Gerais, Brazil, aiming to evaluate the impact caused by changes in land use in water availability. Marhaento et al. (2017) studied changes in the water balance of a tropical catchment in Indonesia due to land-use change
using a modeling approach. Fontes Júnior & Montenegro (2019) investigated the impacts of reforestation of the arboreal Caatinga on the availability of water in a representative basin of the Northeast semiarid with strong anthropic influence, considering a period of severe water scarcity from 2012 to 2015.
In this context, the study aims to assess the issue of land-use change and its effect on evapotranspiration, surface runoff, and sediment yield of the study watershed.
Material and Methods Study area
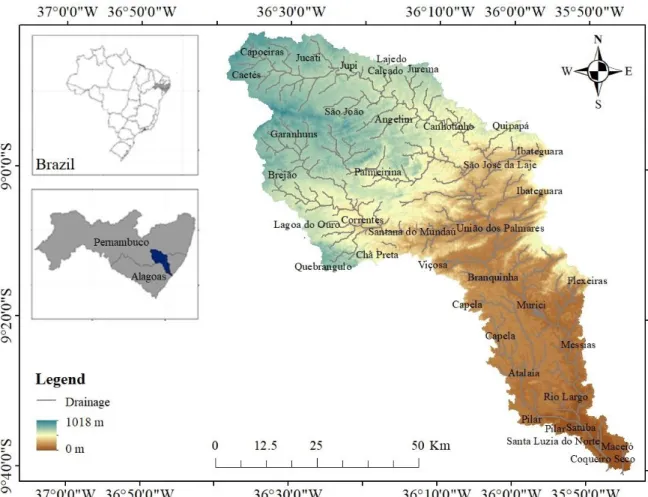
The area of the Mundaú River Basin (MRB) extends over 4,090.39 km². It ranges between southern latitude 8°42'-9°36' and western longitude 35°47'-36°39' (Figure 1), with 52.2% of the area present in the State of Pernambuco, where is the upstream, and 47.8% in Alagoas, where is the downstream (APAC, 2015).
The main economic activity in this basin is agriculture and livestock, which is maintained by the water availability within the watershed.
The MRB is predominantly rural, has substantial agricultural activity, including a large dairy and broilers breeding industry. It also has substantial sugarcane production and processing industry. The MRB also has areas of Caatinga vegetation, characterized by seasonally dry shrubs and forests (Leal et al., 2005), as well as Atlantic Forest vegetation, characterized by seasonally dry and tropical forests (Werneck, 2011). Mangroves and coastal vegetation are also found in the region. The drainage area of the basin involves 34 municipalities, with part or all of the territory included into this, being 19 municipalities in the State of Alagoas and 15 municipalities in the state of Pernambuco. According to Pernambuco State Agency for Water and Climate (APAC), the Angelim, Correntes, Palmerina, and São João towns are completely inserted in the basin. Brejão, Calçado, Capoeiras, Jucati, Jurema, Jupi, and Lajedo are partially inserted into the basin. In Alagoas, Murici, União dos Palmares, São José da Laje, Santana do Mundaú, Satuba and Branquinha have a part into the basin.
The climate, according to the classification of Köppen, is Aw (Tropical, with the dry season in winter). Most of the MRB is classified considering the amount of rainfall, as semi-humid and a small portion classified as semiarid, with an average temperature of 24ºC. The average annual rainfall in the MRB is 800 mm (Alvares et al., 2014), with precipitation declining as the distance from the coast increases.
Figure 1. Location map of the Mundaú River Basin (MRB) and their municipalities. Font: Andrade et al. (2020).
The basin has considerable relevance through the high hydrological variability. There were episodes of peaks flows with flood problems, such as that in Santana do Mundaú, Alagoas, in 2010, causing damage in several areas. The basin also has experienced severe droughts, since part of it is already in the semiarid portion of Pernambuco, such as the recent exceptional drought of 2012, the highest of the last 50 years.
Hydrological modeling
The Soil and Water Assessment Tool
(SWAT), freely available at
(http://swat.tamu.edu/), is physically based and semi-distributed, continuous-time, the hydrological, long-term simulation model developed by United States Department of Agriculture Research Service (Arnold et al. 1998). The hydrological cycle in SWAT is based on the water balance equation (Equation 1):
𝑆𝑊𝑡= 𝑆𝑊0+ ∑𝑡𝑖=1(𝑃 − 𝑄𝑠− 𝐸𝑇 − 𝑊𝑠− 𝑄𝑔𝑤) Eq. (1)
where: SWt is the final soil water content in time t (mm), and SW0 is the initial soil water content in time t (mm); t is time (days), P is precipitation in time t (mm), Qs is a surface runoff in time t (mm),
ET is the actual evapotranspiration in time t (mm), Ws is percolation in time t (mm), and Qgw is the baseflow in time t (mm) (Neitsch et al., 2005).
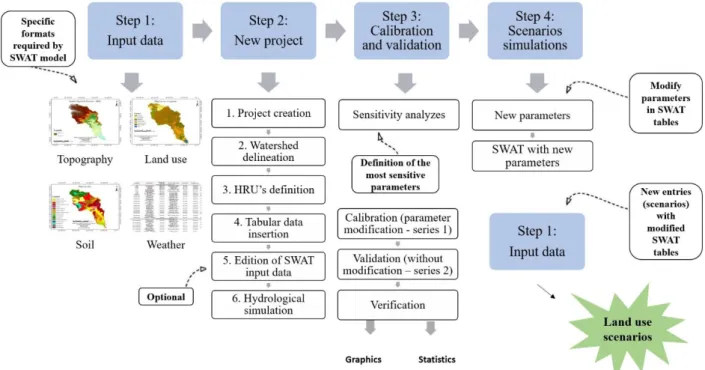
The conceptual framework of the SWAT model and its setup are shown in Figure 2. The SWAT model requires four main types of input data, including three maps and one data series (Step 1). The collection of all data used for hydrological modeling from different sources was performed in a previous study (Andrade, 2018). The digital elevation model (DEM) was obtained from the Shuttle Radar Topography Mission (SRTM), available at Brazilian Agricultural Research Corporation (EMBRAPA) Satellite Monitoring, where archives are available on the altimetry of Brazil. The land use map of the MRB was constructed using satellite images and image processing tools from LANDSAT 5 and 8, obtained from the National Institute of Space Research (INPE). The soil types map was obtained from data provided by the EMBRAPA, based on the information supplied by the Agroecological Zoning of Pernambuco (ZAPE) and Alagoas (ZAAL), which offers maps in the scale of 1: 100,000. The hydrological data were obtained from the National Water Agency (ANA) and the Pernambuco State Agency for Water and Climate
(APAC). The complete daily weather data series were obtained from the National Institute of Meteorology (INMET), using weather stations located in the cities of Garanhuns and Maceió. More information can be found in Andrade (2018). In step 2, all input data is entered into the SWAT model. The model is coupled with the Geographic Information System (GIS). After the creation of the project, the first data to be inserted in the model is DEM, to delimit drainage network and watershed (Watershed Delineation). The SWAT must be configured to delineate sub-basins with defined areas, and then generate the Hydrological Response Units (HRU's). Considering the division of the sub-basins, the
SWAT is based on the concept of area necessary for the formation of a watercourse.
On the other hand, the subdivision in HRU's is made from similar characteristics of soil use, soil type, and slope found in an area; in this way, HRU's have similar properties. The calculations of the variables were done separately in each HRU, to be summed and represent each sub-basin (Silva, 2014). Then, tabular data were included with the series of precipitation data and other meteorological data. After this phase, the input data can be edited to improve the characterization of the study area. After these steps, the simulation with the model can be performed.
Figure 2. Conceptual framework of the Soil and Water Assessment Tool (SWAT) model and its setup. Font: Andrade et al. (2020).
The SWAT needs calibration and validation about evapotranspiration, percolation, interception, water storage, and surface runoff. The calibration and validation procedures of the MRB (Step 3) was performed previously by Andrade (2018) using the SWAT-CUP. The SWAT-CUP is an independent software developed for uncertainty and sensitivity analyses, calibration, and validation processes, based on SWAT simulations. The program contains five calibration procedures, 11 objective functions, and includes applications such as visualization of the study area (Abbaspour et al., 2007). The results related to the performance of the model and its statistical indices can also be verified in Andrade (2018).
Once calibrated and validated, the model can be used to simulate scenarios of land-use changes (Step 4), which is precisely the focus of
this study: verify the impact of land-use changes dynamics on evapotranspiration, surface runoff, and sediment yield. The values of the calibrated parameters of the result generated in the SWAT-CUP must be transferred to the SWAT model. With the modified values, the whole process described from stage 1 is done again, considering, now, the changes that occurred under the different scenarios adopted for evaluation.
Land-use scenarios
The source for the land use data for the years 1987 and 2017 was generated from downloaded Landsat 5 and 8 imageries from http://www.dgi.inpe.br/CDSR/. The details of Landsat data are presented in Table 1. Initially, the images were converted into Universal Transfer
Mercator and geo-referenced to a datum in which Brazil has been selected by WGS 84.
Table 1. Sources of Landsat images. Font: http://www.dgi.inpe.br/CDSR/.
Images Landsat 5 Landsat 8 Resolution (m) 30 x 30 m 30 x 30 m Sensor TM OLI Path 214/215 214/215 Row 66/67 66/67 Year 1987 2017
Classification Landsat images, supervised classification was done adopting the maximum likelihood classifier. Seven land use classes were identified: i) Water, ii) Urban Area, iii) Atlantic Forest, iv) Caatinga, v) Pasture, vi) Agriculture, and vii) Sugarcane.
For modeling runoff response to land-use changes, two scenarios of land use were analyzed over 30 years, which were: a regeneration scenario (referring to use in the year 1987) and another
scenario of degradation (relating to use in the year 2017).
Concerning statistical analyzes, we performed boxplots and data on the mean annual evapotranspiration, surface runoff, and sediment yield was subjected to analysis of variance (F test) and test of Tukey for comparison of means at 0.05 level of significance.
Results and Discussion
Land-use changes in the Mundaú River Basin
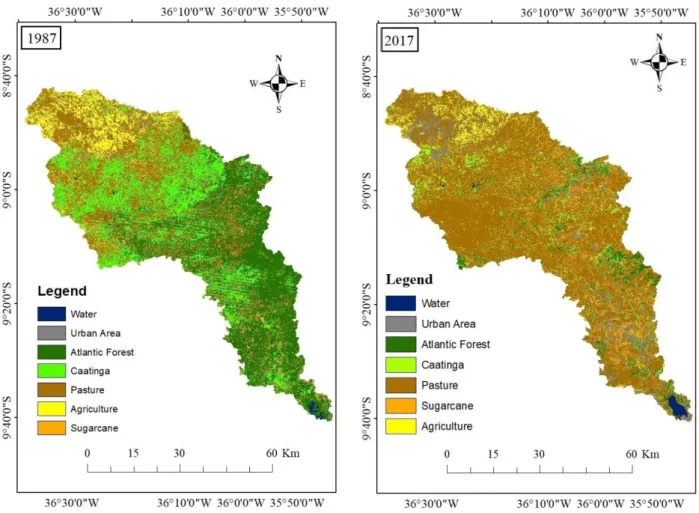
The proportion of land-use dynamics and corresponding percentage shared during the regeneration (referring to use in the year 1987) and degradation (relating to use in the year 2017) scenarios have been presented in Figure 3 and Table 2. The study watershed has a total area of about 4,090.39 km². Figure 3 shows that it is clear that the forests – Atlantic Forest and Caatinga – were the most present types of land use in 1987, presenting 33.26 and 22.23% of the area, respectively. In 2017, it was noticed that the highest percentage of land use is exclusively by pastures, with 64.21%.
Figure 3. Land-use classes for Mundaú Basin in the regeneration (1987) and degradation (2017) scenarios. Font: Andrade et al. (2020).
It is confirmed that an increase in pasture and sugarcane has been in the area in the last years. From 1987 to 2017, urban expansion was also one of the causes of transformations in the land use of MRB. Considering the development in agricultural products and practices, the areas of cultivation and the activities of livestock have grown over time, as well as urban expansion. These modifications characterized significant losses of native vegetation, destruction of part of extensive forests, for replacement by such activities. According to Silva (2002), there is a low percentage of forest occupation of Atlantic Forest around the world due to indiscriminate deforestation, especially those that occurred in the '60s and '80s, which destroyed essential species of fauna and flora.
As can be seen in Figure 3, the share of forest cover in the study watershed comprised of densely vegetated natural forest, plantation, and shrubs in the regeneration scenario. According to Tucci & Clarke (1997) and Bruijnzeel (1996), forests have higher interception capacity than pastures. In this way, the direct evaporation of the intercepted water tends to be higher with the presence of native forests; processes such as infiltration and percolation of water in the soil also tend to increase.
On the other hand, deforestation causes an increase in the average flow of a watershed, which can lead to problems such as extreme flood events. Such effects may become irreversible over the years when there are intense agriculture and utilization of mechanization in the area.
Table 2. Land-use areas in the regeneration (1987) and degradation (2017) scenarios of the Mundaú River Basin. Font: Andrade et al. (2020).
Scenario Regeneration (1987)
Degradation (2017) Land use Area
(km²) Area (%) Area (km²) Area (%) Water – WATR 10.5 0.3 26.8 0.7 Urban Area – URBN 146.4 3.6 343.6 8.3 Atlantic Forest – FRSE 1372.2 33.3 276.1 6.7 Caatinga – RNGB 917.4 22.2 264.0 6.4 Pasture – PAST 1223.4 29.7 2649.5 64.2 Sugarcane – SUGC 106.7 2.6 327.3 7.9 Agriculture – AGRL 349.4 8.5 238.8 5.8
Figure 4 shows land-use types and percentage area of Mundaú watershed from 1987
to 2017. Overall, during the last three decades (1987–2017), 1749.6 km² (76.4%) of forest were lost in the MRB. On the other hand, grazing land increased 1426.1 km², arriving in 2017 at little more than double the area that existed in 1987. The share of sugarcane land, for the study, watershed rose from 2.6% in 1987 to 7.9% during 2017. The urban portion also rose from 3.6% in 1987 to 8.3% during 2017. Generally, during the study periods, the share of agricultural land was more or less constant, with a slight reduction observed in 2017. The water bodies such as spring, streams ponds, and small rivers accounted for a share of only 0.3% during 1987 and increased to 0.7% during 2017 (Table 2).
Figure 4. Land-use types and area coverage of Mundaú watershed from 1987 to 2017. WATR = Water, URBN = Urban area, FRSE = Atlantic Forest, RNGB = Caatinga, PAST = Pasture, SUGC = Sugarcane, AGRL = Agriculture. Font: Andrade et al. (2020).
The percentage change in land use class of Mundaú watershed from 1987 to 2017 is shown in Figure 5.
Figure 5. Percentage change in land use class of Mundaú watershed from 1987 to 2017. Font: Andrade et al. (2020).
The pasture increased by 34.6% from the regeneration to the degradation scenarios. According to Lima et al. (2012), grazing is vegetation that has a few biomass and a shallow
0 10 20 30 40 50 60 70
WATR URBN FRSE RNGB PAST SUGC AGRL
A
re
a
(%
)
Land use class
1987 2017 -40 -30 -20 -10 0 10 20 30 40
WATR URBN FRSE RNGB PAST SUGC AGRL
root system, and consequently, has a low evapotranspiration rate; such condition leads to an increase in the direct runoff (surface and subsurface) to the channels, increasing the annual mean flow in the watershed.
The net change in forest lands for the last 30 years (1987–2017) decreased by about 26.6% and 15.8% for Atlantic Forest and Caatinga, respectively. Marhaento et al. (2017), studying the changes in the water balance of the Samin catchment on Java, Indonesia using the SWAT model, found during the period 1994–2013, that deforestation by decreasing evergreen forest area and mixed garden area was about 30%. Additionally, settlements and agricultural areas increased by 25% and 6%, respectively. Rodrigues et al. (2015), evaluating the impact of changes in land use in the flow of the Pará River Basin, Brazil, found that from 1983 to 2012, there was an increase in pastoralism, with 38% of the territory in 2012. The authors also observed that, in this period, occurred a reduction of approximately half the area formerly occupied by the Atlantic Forest.
In the whole study period, the increase in the sugarcane area was about 5.3%, from the regeneration to the degradation scenarios. During the given periods (1987-2017), the urban area has increased to about 4.8%, which took an additional 197.2 km² from other land use categories. Another share of land use class for the study area is agriculture land, which was accounted for 8.5% (349.5 km²) during 1987; in contrast, during 2017, it shrunk by about 2.7% (8.5-5.8%).
Changes in water balance by following land-use changes
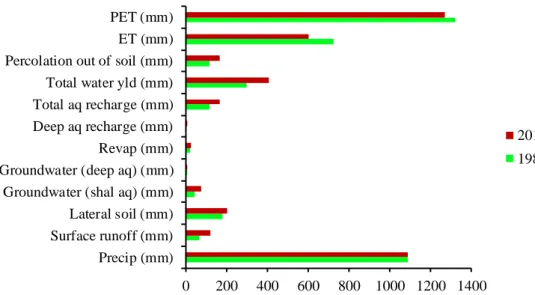
The water balance of a watershed is the main constituent of water management and is influenced by several natural and anthropogenic issues. Modifications of water balance components caused by land-use change, for example, can cause impacts on the environment, such as water stress in plants and extreme events such as droughts and floods (Kundu et al., 2017). Figure 6 shows the annual water balance in the Mundaú River Basin. The results reveal the magnitude of the impact of land-use changes on water flow. Changes in land use over the years resulted in an increase of about 37% in water yield of the Mundaú River Basin, corresponding to 111.7 mm year-1, about 1987.
This increase in flow can be explained by the reduction of the mean evapotranspiration in the basin, from 726.9 mm in 1987 to 603.2 mm, in 2017. Rodrigues et al. (2015) also found an increase in water flow and a decrease in ET in the Pará River Basin when the land use for 1983 was compared to the 2012 year. Kundu et al. (2017), analyzing the individual and combined impacts of future climate and land-use changes on the water balance of the Narmada River Basin, India, found an increase in water yield and decrease actual evapotranspiration (ET). The authors associated these results with the change in the Curve Number (CN) values, a parameter used by SWAT to calculate surface runoff that considers, among other things, the changes that occur in land use. According to Pereira et al. (2016), the decrease in surface runoff is associated to the inferior values in the CN for the Atlantic Forest, since it allows more protection to the soil surface and, consequently, better water infiltration.
Figure 6. Annual water balance due to land-use change in the Mundaú River Basin. PET = Potential Evapotranspiration; ET = Actual Evapotranspiration. Font: Andrade et al. (2020).
0 200 400 600 800 1000 1200 1400 Precip (mm)
Surface runoff (mm) Lateral soil (mm) Groundwater (shal aq) (mm) Groundwater (deep aq) (mm) Revap (mm) Deep aq recharge (mm) Total aq recharge (mm) Total water yld (mm) Percolation out of soil (mm) ET (mm) PET (mm)
2017 1987
Although the total aquifer recharge was higher in 2017, the percolation out of soil was also higher in this year, possibly indicating that losses were more pronounced when compared to 1987. The surface runoff was also a variable that presented higher values in 2017 when compared to 1987. This result state that a lower density of vegetation cover, and consequently, lower interception of precipitation by the canopy, causes an increase in surface runoff. This condition leads to less water use by the soil, with the reduction of processes such as infiltration and percolation. Vegetal cover plays an essential role in the maintenance and balance of the hydrological cycle, performing functions in the control of water availability, which guarantees flow permanence (Rodrigues et al., 2015).
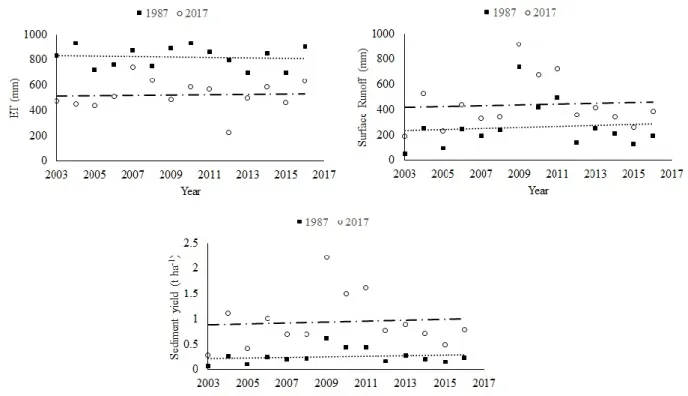
Effect of land-use change on ET, surface runoff and sediment yield
Figure 7 shows the long-term changes in the ET, surface runoff, and sediment yield for the regeneration and degradation scenarios. At the sub-catchment level, long-term trends were of growth for surface runoff and sediment production. To evapotranspiration, we found that there was a decrease over time, mainly due to the decrease in forest areas, as previously mentioned. As the Atlantic forest has higher values of leaf area index (LAI) when compared to pastures, gas exchange between the canopy and the environment is more prominent (Pereira et al., 2010). Such a condition allows an increase in evapotranspiration.
Figure 7. Simulated ET, surface runoff, and sediment yield, including the long‐term trend for the regeneration (1987) and degradation (2017) scenarios in the Mundaú River Basin. Font: Andrade et al. (2020).
Furthermore, Atlantic Forest explores the soil more through its roots, which enables a higher water consumption by the plants. Marhaento et al. (2017) found that land-use change due to deforestation and expansions of the settlement area reduced the mean annual ET and increased the mean annual streamflow in the studied watershed. According to authors, occurrences in the soil surface resulting in loss of organic matter cause a
lower permeability and storage capacity (e.g., deforestation), leading to a decrease in the soil infiltration capacity. Thereby, much of the precipitation is converted into surface runoff.
The amplitude and dispersion of data on simulated evapotranspiration, surface runoff, and sediment yield in scenarios of 1987 and 2017 years in the Mundaú River Basin are shown in Figure 8.
Figure 8. Amplitude and dispersion of data on simulated evapotranspiration, surface runoff, and sediment yield for the regeneration (1987) and degradation (2017) scenarios in the Mundaú River Basin. Font: Andrade et al. (2020).
SWAT model results showed that it is possible to verify that, between the years of 1987 and 2017, there was a decrease in the average values of evapotranspiration. Mean values and amplitudes of surface runoff and sediment yields were increasing over the years, mainly due to the decrease of the vegetation cover of the studied basin. Rodrigues et al. (2015) found the highest mean flow and amplitude in 2012 when compared to 1983 due to the changes in land use and the original plant cover of the Pará River Basin.
Tukey's test statistic showed that there was a significant difference between mean off all variables studied (evapotranspiration, surface runoff, and sediment yield) for the two scenarios: 1987 and 2017 years (Table 3). These differences confirm the effect that changes in land use cause on the hydrological and sedimentological processes of a watershed. In MRB, there was a higher average value of evapotranspiration in 1987 when compared to 2017; and this fact can be explained by the higher density of vegetal cover existing in the '80s. Rodrigues et al. (2015) also found higher mean values of evapotranspiration in the original vegetation cover scenario when compared to current soil use.
Table 3. Statistical evaluation for mean evapotranspiration, surface runoff, and sediment yield for the regeneration (1987) and degradation (2017) scenarios in the Mundaú Watershed. Font: Andrade et al. (2020). Variable Scenario Regeneration (1987) Degradation (2017) Precipitation (mm.year-1) 1090.3 1090.3 Evapotranspiration (mm.year-1) 820.8 A 522.25 B Surface runoff (mm.year-1) 263.3 A 440.6 B Sediment yield (t.ha-1) 0.265 A 0.947 B
The lower density of vegetation cover in 2017 may be one of the leading causes of extensive surface runoff and higher sediment yield in the Mundaú River Basin; these variables presented higher average values when compared with the 1987 values. Rodrigues et al. (2015) found higher average flow values in the current land use scenario when compared to the original vegetation cover. The surface runoff mean values ranged from 263.3 to 440.6 mm, and the sediment yield mean values ranged from 0.265 to 0.947 t ha-1 between 1987 and
2017, respectively. According to Halecki, Kruk & Ryczeq (2018), there is a close relationship between surface runoff and erosion; that is, soil loss is affected by the intensity of water flowing through the soil surface. Additionally, according to the authors, water erosion is one of the main problems in agriculture.
According to the classification of soil erosion risk proposed by Marks et al. (1989), soil losses below 1 ton ha-1 year-1 does not present
erosion risks. Values between 1 and 5 ton ha-1 year -1 are low risk. Thus, although MRB does not
present a risk of erosion, changes in land use over the three decades have increased soil loss values to the acceptable limit of risk, since values above 1 ton.ha-1.year-1 already present low risks of erosion.
These results are a warning for the adoption of better management practices in MRB, to prevent adverse effects on the ecosystem caused by erosion.
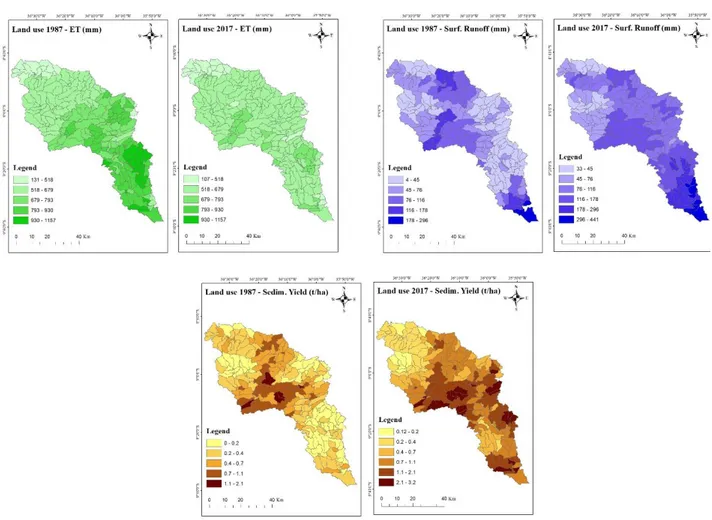
The total spatial effect of land use changes is considered in this study and three conditions over 30 years are evaluated to get the view of the water balance of the region with SWAT, particularly with the actual evapotranspiration (mm), surface runoff (mm) and total water yield (t ha-1). According to
Worku, Khare & Tripathi (2017), the complex nature of watershed, as well as spatial variation of different land use, can modify the water and sediment yields. Figure 9 shows the spatial distribution of the variable's evapotranspiration,
surface runoff, and sediment yield for the regeneration and degradation scenarios.
The regeneration scenario had higher values of evapotranspiration and lower values of runoff and sediment production, due to the higher density of vegetation cover when compared to the degradation scenario. On the other hand, surface runoff was higher in 2017 when compared to 1987; and it was probably for that reason that the sediment production also presented higher values in 2017 along the watershed. More specifically, land-use changes, particularly the expansion of pasture and sugarcane areas, may be responsible
for a significant increase in the surface runoff and sediment yield in the MRB. As already indicated in Fig. 6, the change in land use between 1987 and 2017 from forests into pasture and sugarcane areas has actively contributed to increasing the surface runoff and sediment yield. Problems such as soil degradation, erosion, low occupancy, are some examples that cause continuous changes in the land use of a watershed over time. Also, processes such as the construction of water catchment points, agricultural and urban expansions, deforestation contribute significantly to these changes (Worku, Khare & Tripathi, 2017).
Figure 9. Land-use change impact on evapotranspiration (mm), surface runoff (mm), and sediment yield (t ha-1) for the regeneration and degradation scenarios. Font: Andrade et al. (2020).
According to Molina-Navarro et al. (2018), land-use changes may cause uncertain consequences for water resources. The results achieved in this work confirm the indispensable role of vegetal cover in the maintenance of hydrological processes in a watershed (Tucci and Clarke, 1997). Such results can be adopted for decision-making related to the management of water resources in the area. Additionally, this research is applicable for similar watersheds to understand the effects of land-use change on water yield.
Conclusion
The analysis of results showed that the watershed experienced significant land-use change between 1987 and 2017. This study confirmed that most of the land use occupied by forests in the Mundaú River Basin are reducing due to pasture and sugarcane expansion. Also, the main change in land use involved replacing the original vegetation by pasture in an area corresponding to 34% of the watershed. Changes in land use over the regeneration and degradation scenarios have led to increased processes such as surface runoff and sediment yield.
On the other hand, there was a reduction in evapotranspiration. Hence, it can be concluded that spatial and temporal distribution of land use controls the water balance and sediment production in the Mundaú River Basin. Then, there is a need to adopt sustainable practices in the basin to minimize the massive losses of native vegetation that have occurred over the last 30 years. The SWAT model is an essential tool to simulate the spatial and temporal variability of evapotranspiration, surface runoff, and sediment yield with following land-use changes in the Mundaú watershed.
Acknowledgements
The authors would like to thank the SWAT model developers' team, from Texas A&M University, for generous technical support. The Agência Nacional de Águas (ANA), Agência Pernambucana de Águas e Clima (APAC), Instituto Nacional de Pesquisas Espaciais (INPE), Universidade Federal Rural de Pernambuco. This study was supported by Fundação de Amparo à Ciência e Tecnologia do Estado de Pernambuco (FACEPE) (Process N. 8, IBPG-0231-5.03/14, BCT-0176-5.03/14 and APQ-0300-5.03/17), CNPq (Process N. 8 446254/2015-0, 307641/2013-9,441305/2017-2 call MCTI/CNPq Nº 19/2017, MCTI/CNPq No 14/2014 and MCTI/CNPq/ANA
N.23/201), Coordenação de Aperfeiçoamento de Pessoal de Nível Superior (CAPES) (PVE aupex 2792/2013, Process 23038007733/2013-76), Financiadora de Estudos e Projetos (FINEP) (REHIDRO 1830) and PQ scholarships from the Conselho Nacional de Desenvolvimento Científico e Tecnológico (CNPq). Any opinions, findings, and conclusions or recommendations expressed in this material are those of the authors and do not necessarily reflect the views of organizations mentioned above.
References
Abbas, T.; Nabi, G.; Boota, M. W.; Hussain, F.; Faisal, M.; Ahsan, H. 2015. Impacts of landuse changes on runoff generation in Simly watershed. Sci Int, 27, 4, 4083-4089. Abbaspour, K. C.; Yang, J.; Maximov, I.; Siber, R.;
Bogner, K.; Mieleitner, J.; Zobrist, J.; Srinivasan, R. 2007. Modelling hydrology and water quality in the pre-alpine/alpine Thur watershed using SWAT. Journal of
Hydrology, 333, 413-430.
http://doi.org/10.1016/j.jhydrol.2006.09.014. Alvares, C. A.; Stape, J. L.; Sentelhas, P. C.;
Gonçalves, J. L. M.; Sparovek, G. 2014. Köppen’s climate classification map for Brazil. Meteorologische Zeitschrift, 22, 6,
711-728. https://doi.org/10.1127/0941-2948/2013/0507.
Anaba, L. A.; Banadda, N.; Kiggundu, N.; Wanyama, J.; Engel, B.; Moriasi, D. 2017. Application of SWAT to assess the effects of land use change in the Murchison Bay Catchment in Uganda. Computational Water, Energy, and Environmental Engineering, 6, 24-40.
http://doi.org/10.4236/cweee.2017.61003. Andrade, C. W. L. 2018. Hydrological modeling
and scenarios of land use and climate changes in a representative basin, northeastern Brazil. Tese (Universidade Federal Rural de Pernambuco). 161p.
APAC, Agência Pernambucana de Águas e Clima (Pernambuco State Agency for Water and Climate) (www.apac.pe.gov.br). Accessed on: July 2015.
Arnold, J. G.; Srinivasan, R.; Muttiah, R. S.; Williams, J. R. 1998. Large area hydrologic modeling and assessment part I: model development. Journal of the American Water Resources Association, 34, 73-89. http://dx.doi.org/10.1111/j.1752-1688.1998. Blainski, E.; Porras, E. A. A.; Garbossa, L. H. P.;
Pinheiro, A. 2017. Simulation of land use scenarios in the Camboriú River Basin using the SWAT model. Brazilian Journal of Water Resources, 22, 33, 1-12.
http://dx.doi.org/10.1590/2318-0331.011716110.
Booth, D. B. 1991. Urbanization and the natural drainage system–impacts, solutions, and prognoses. Northwest Environ. J., 7, 1, 93-117.
Bressiani, D. A.; Gassman, P. W.; Fernandes, J. G.; Garbossa, L. H. P.; Srinivasan, R.; Bonumá, N. B.; Mendiondo, E. M. 2015. Review of Soil and Water Assessment Tool (SWAT) applications in Brazil: Challenges and prospects. International Journal of Agricultural and Biological Engineering, 8, 9-35.
http://dx.doi.org/10.3965/j.ijabe.20150803.1 765.
Bruijnzeel, L. A. 1996. Predicting the hydrological impacts of land cover transformation in the humid tropics: the need for integrated research. In: Gash, J. H. C.; Nobre, C. A.; Roberts, J. M.; Victoria, R. L. 1996. Amazonian deforestation and climate. Chichester, England: J. Wiley, Cap.2.
Coelho, V. H. R.; Montenegro, S. M. G. L.; Almeida, C. N.; Lima, E. R. V.; Ribeiro Neto, A.; Moura, G. S. S. 2014. Dinâmica do uso e ocupação do solo em uma bacia hidrográfica
do semiárido brasileiro. R. Bras. Eng. Agríc. Ambiental, 18, 1, 64-72.
http://dx.doi.org/10.1590/S1415-43662014000100009.
FAO. 2010. Global Forest Resources Assessment, Main report. Food and Agriculture Organization of the United Nations, FAO, Rome.
Fontes Júnior, R.; Montenegro, A. 2019. Impact of land use change on the water balance in a representative watershed in the semiarid of the state of Pernambuco using the SWAT model. Engenharia Agrícola, 39, 1, 110-117.
http://dx.doi.org/10.1590/1809-4430-Eng.Agric.v39n1p110-117/2019.
Halecki, W.; Kruk, E.; Ryczeq, M. 2018. Loss of topsoil and soil erosion by water in agricultural areas: A multicriteria approach for various land use scenarios in the Western Carpathians using a SWAT model. Land Use
Policy, 73, 363-372.
https://doi.org/10.1016/j.landusepol.2018.01. 041.
Khare, D.; Patra D.; Mondal, A.; Kundu, S. 2017. Impact of landuse/land cover change on runoff in the catchment of a hydro power project. Appl Water Sci, 7, 2, 23–35. https://doi.org/10.1007/s13201-015-0292-0. Kundu, S.; Khare, D.; Mondal, A. 2017. Individual
and combined impacts of future climate and land use changes on the water balance. Ecological Engineering, 105, 42-57. https://doi.org/10.1016/j.ecoleng.2017.04.06 1.
Leal, I. R.; Silva, J. M. C.; Tabarelli, M.; Lacher Junior, T. E. 2005. Changing the course of biodiversity conservation in the Caatinga of northeastern Brazil. Conservation Biology,
19, 701-706.
http://dx.doi.org/10.1111/j.1523-1739.2005.00703.x.
Lima, W. P.; Laprovitera, R.; Ferraz, S. F. B.; Rodrigues, C. B.; Silva, M. M. 2012. Forest and water consumption: A strategy for hydrosolidarity. International Journal of Forestry Research, 2012, 1-8. http://dx.doi.org/10.1155/2012/908465. Marhaento, H.; Booij, M. J.; Rientjes, T. H. M.;
Hoekstra, A. Y. 2017. Attribution of changes in the water balance of a tropical catchment to land use change using the SWAT model. Hydrological Processes, 31, 2029-2040. http://dx.doi.org/10.1002/hyp.11167.
Marks, R.; Müller, M. J.; Leser, H.; Klink, H. J. 1989. Anleitung zur Bewertung des
Leistungsvermögens des
Landschaftshaushaltes (BA LVL)
Zentralausschuß für deutsche Landeskunde. 229p. Forschungen zur Deutschen Landeskunde.
Molina-Navarro, E.; Andersen, H. E.; Nielsen, A.; Thodsen, H.; Trolle, D. 2018. Quantifying the combined effects of land use and climate changes on stream flow and nutrient loads: A modelling approach in the Odense Fjord catchment (Denmark). Science of the Total Environment, 621, 253-264. https://doi.org/10.1016/j.scitotenv.2017.11.2 51.
Munoz-Villers, L. E.; McDonnell, J. J. 2013. Land use change effects on runoff generation in a humid tropical montane cloud forest region. Hydrological Earth System Science, 17, 3543-3560. https://doi.org/10.5194/hess-17-3543-2013.
Neitsch, S. L.; Arnold, J. G.; Kiniry, J. R.; Williams, J. R. 2005. Soil and water assessment tool: Theoretical documentation version 2005. Temple: Blackland Research Center, 541p.
Pereira, D. R.; Martinez, M. A.; Silva, D. D.; Pruski, F. F. 2016. Hydrological simulation in a basin of typical tropical climate and soil using the SWAT Model Part II: Simulation of hydrological variables and soil use scenarios. Journal of Hydrology: Regional Studies, 5, 149-163.
http://dx.doi.org/10.1016/j.ejrh.2015.11.008. Pereira, D. R.; Mello, C. R.; Silva, A. M.; Yanagi,
S. N. M. 2010. Evapotranspiration and estimation of aerodynamic and stomatal conductance in a fragment of Atlantic Forest in Mantiqueira range region, MG. Revista
Cerne, 16, 32-40.
http://dx.doi.org/10.1590/S0104-77602010000100004.
Rodrigues, E. L.; Elmiro, M. A. T.; Braga, F. A.; Jacobi, C. M.; Rossi, R. D. 2015. Impact of changes in land use in the flow of the Pará River Basin, MG. Revista Brasileira de Engenharia Agrícola e Ambiental, 19, 1, 70-76. http://dx.doi.org/10.1590/1807-1929/agriambi.v19n1p70-76.
Sajikumar, N.; Remya, R. S. 2015. Impact of land cover and land use change on runoff characteristics. J. Environ. Manag., 161, 460-468.
https://doi.org/10.1016/j.jenvman.2014.12.0 41.
Silva, C. A. I. 2014. Análise de aplicabilidade da interface do modelo hidrológico SWAT-SIG no estudo da produção de sedimentos em uma bacia no Nordeste do Brasil. Dissertação (Universidade Federal de Alagoas). 53p.
Silva, L. F. 2002. 500 anos de uso do solo no Brasil. Editora Editus, Ilhéus, Ba. 2002. 605p. Tucci, C. E. M.; Clarke, R. T. 1997. Impacto das
mudanças de cobertura vegetal no escoamento: Revisão. Revista Brasileira de Recursos Hídricos, 2, 135-152.
Tufa, D. F.; Abbulu, Y.; Srinivasarao, G. V. R. 2014. Watershed hydrological response to changes in land use/land covers patterns of river basin: A review. International Journal of Civil, Structural, Environmental and Infrastructure Engineering Research and Development, 4, 157-170.
Werneck, F. P. 2011. The diversification of eastern South American open vegetation biomes: Historical biogeography and perspectives. Quaternary Science Reviews, 30, 1630-1648. https://dx.doi.org/10.1016/j.quascirev.2011.0 3.009.
Worku, T.; Khare, D.; Tripathi, S. K. 2017. Modeling runoff–sediment response to land use/land cover changes using integrated GIS and SWAT model in the Beressa watershed. Environ. Earth Sci., 76, 550, 1-14. http://dx.doi.org/10.1007/s12665-017-6883-3.
Yan, B.; Fang, N. F.; Zhang, P. C.; Shi, Z. H. 2013. Impacts of land use change on watershed streamflow and sediment yield: an assessment using hydrologic modelling and partial least squares regression. Journal of
Hydrology, 484, 26-37.
https://doi.org/10.1016/j.jhydrol.2013.01.008 Zhang, L.; Liu, Y.; Wu, L.; Cai, D.; Ma, X. 2016. Impact of land-use scenarios on monthly runoff modeled by SWAT. Fresenius Environmental Bulletin, 25, 9, 3595-3605.