ESTIMATION OF WATER PERCOLATION BY DIFFERENT
METHODS USING TDR
(1)Alisson Jadavi Pereira da Silva(2) & Eugênio Ferreira Coelho(3)
SUMMARY
Detailed knowledge on water percolation into the soil in irrigated areas is fundamental for solving problems of drainage, pollution and the recharge of underground aquifers. The aim of this study was to evaluate the percolation estimated by time-domain-reflectometry (TDR) in a drainage lysimeter. We used Darcy’s law with K(θθθθθ) functions determined by field and laboratory methods and by the change in water storage in the soil profile at 16 points of moisture measurement at different time intervals. A sandy clay soil was saturated and covered with plastic sheet to prevent evaporation and an internal drainage trial in a drainage lysimeter was installed. The relationship between the observed and estimated percolation values was evaluated by linear regression analysis. The results suggest that percolation in the field or laboratory can be estimated based on continuous monitoring with TDR, and at short time intervals, of the variations in soil water storage. The precision and accuracy of this approach are similar to those of the lysimeter and it has advantages over the other evaluated methods, of which the most relevant are the possibility of estimating percolation in short time intervals and exemption from the predetermination of soil hydraulic properties such as water retention and hydraulic conductivity. The estimates obtained by the Darcy-Buckingham equation for percolation levels using function K(θθθθθ) predicted by the method of Hillel et al. (1972) provided compatible water percolation estimates with those obtained in the lysimeter at time intervals greater than 1 h. The methods of Libardi et al. (1980), Sisson et al. (1980) and van Genuchten (1980) underestimated water percolation.
Index terms: internal drainage, unsaturated hydraulic conductivity, instantaneous profile, time domain reflectometry.
(1) Received for publication on February 4, 2013 and approved on October 25, 2013.
(2) Professor, Instituto Federal de Educação, Ciência e Tecnologia Baiano. Estrada da Igara, km 4, zona rural. CEP 48979-000
Senhor do Bonfim (BA). E-mail: alisson.jadavi@pq.cnpq.br
(3) Pesquisador, EMBRAPA Mandioca e Fruticultura. Rua EMBRAPA, s/n, Bairro Chapadinha. CEP 44380-000 Cruz das Almas
RESUMO: ESTIMATIVA DA PERCOLAÇÃO DE ÁGUA NO SOLO POR DIFERENTES MÉTODOS USANDO TDR
O conhecimento acurado da percolação de água no solo é crucial para resolução de problemas de drenagem, recarga e poluição de aquíferos subterrâneos. O objetivo deste trabalho foi avaliar a percolação estimada com TDR em lisímetro de drenagem. Utilizou-se da Lei de Darcy com funções K(θ) determinadas por métodos de campo e laboratório, bem como pela variação de armazenagem de água no perfil do solo com 16 pontos de medidas de umidade em diferentes intervalos de tempo. Um solo de textura argiloarenosa foi saturado e coberto com lona plástica para evitar a evaporação, procedendo-se um ensaio de drenagem interna em um lisímetro de drenagem. A avaliação da relação entre os valores de percolação estimados e observados foi feita mediante análise de regressão linear. Os resultados sugerem que a estimativa da percolação em nível de campo ou laboratório pode ser realizada a partir do monitoramento contínuo e em curtos intervalos de tempo da variação de armazenagem de água no solo com TDR. Esse método apresentou precisão e acurácia próxima a de lisímetro e algumas vantagens sobre os demais avaliados, como a possibilidade de estimativas de percolação em curtos intervalos de tempo e a não necessidade da predeterminação de propriedades hidráulicas do solo como curva de retenção e condutividade hidráulica. Verificou-se que o uso da equação de Darcy-Buckingham para estimativa das lâminas de percolação com uso da função K(θ) predita pelo método de Hillel et al. (1972) proporcionou estimativas de percolação de água com valores compatíveis aos obtidos no lisímetro de drenagem para intervalos de tempo maior que 1 h. Os métodos de Libardi et al. (1980), Sisson et al. (1980) e van Genuchten (1980) subestimaram os valores de percolação de água estimados.
Termos de indexação: drenagem interna, condutividade hidráulica não saturada, perfil instantâneo, reflectometria no domínio do tempo.
INTRODUCTION
Knowledge of the patterns of water movement in the soil is essential to solve problems involving irrigation, drainage, water conservation, aquifer recharge and pollution, as well as infiltration and control of runoff (Hillel et al., 1972). In non-saturated soil, the Darcy-Buckingham equation has often been used to estimate the water flow (Silva et al., 2007; Jiménez-Martíneza et al., 2009; Ghiberto et al., 2011):
( )
z H K q
¶ ¶ q
-= (1)
where: q is the flux density of the solution (m s-1); K(θ) is the function of unsaturated hydraulic conductivity (m s-1) and H/ z is the hydraulic potential gradient (m m-1).
The K(θ) function can be determined in the field or in the laboratory. The method proposed by Hillel et al. (1972) allows the calculation of K(θ) in the field in a process of internal drainage when there is no flow on the soil surface. By this method, but considering the gradient unit in the internal drainage process, Libardi et al. (1980) and Sisson et al. (1980) proposed, by different approaches, methods to determine K(θ).
Other methods are indirect, allowing a theoretical calculation of the function K(θ) from water retention data in the soil obtained in the laboratory (van Genuchten, 1980; Weynants et al., 2009). Both the direct and indirect methods are time-intensive,
generate costs due to the need for pre-determinations of hydraulic properties, are error-prone, and the results are only valid on a local scale (Mermoud & Xu, 2006; Arya & Heitman, 2010).
These difficulties still make the data acquisition of water percolation into unsaturated soil a challenging task (Dikinya, 2005; Selle et al., 2011; Mavimbela & van Rensburg, 2012). Studies reveal that the exponential form of function K(θ) permits large errors due to small variations in soil moisture (Mubarak et al., 2010; Ghiberto & Moraes, 2011; Reichardt & Timm, 2012). Another problem is that hydraulic conductivities estimated by different methods is highly variable, resulting in uncertainty in the calculation of the water flow into the soil (Dye et al., 2011; Adhanom et al., 2012).
Monitoring the soil moisture in a profile with horizontal (R) and vertical (L) dimensions, in which TDR probes are distributed at points (r, z) of the profile, the water percolation level can be determined based on water storage variation in short time intervals, as described by Silva et al. (2009):
i
dZ θ dZ θ LP
4
1 i
L
0
L
0 1 t t
å ò
=ò
+ ÷÷ø ö ç
ç è æ
-= (2)
where: LP is the percolation level estimated in time interval ∆t (mm); θt is the moisture in the beginning of time interval ∆t (m3 m-3); θ
t+1 is the moisture at the end of time interval ∆t (m3 m-3); Z is the depth (mm), L is the total depth of the monitoring plan (mm); and i is the number of monitoring plans used in the estimation.
The use of each method depends on the different procedures and tools. Thus, the decision to choose one or the other must take their precision and accuracy into account, which is critical for the consistency of the results in the calculation of percolation in its various applications, e.g., when used as a component of the soil water balance or for the calculation of the efficiency of water application in irrigated areas.
The purpose of this study was to analyze the estimated percolation of soil water using the Darcy-Buckingham equation with K(θ) functions determined by direct field and indirect laboratory approaches, as well as from the varying water storage in the profile, monitored at 16 points of moisture measurement at different time intervals using TDR.
MATERIAL AND METHODS
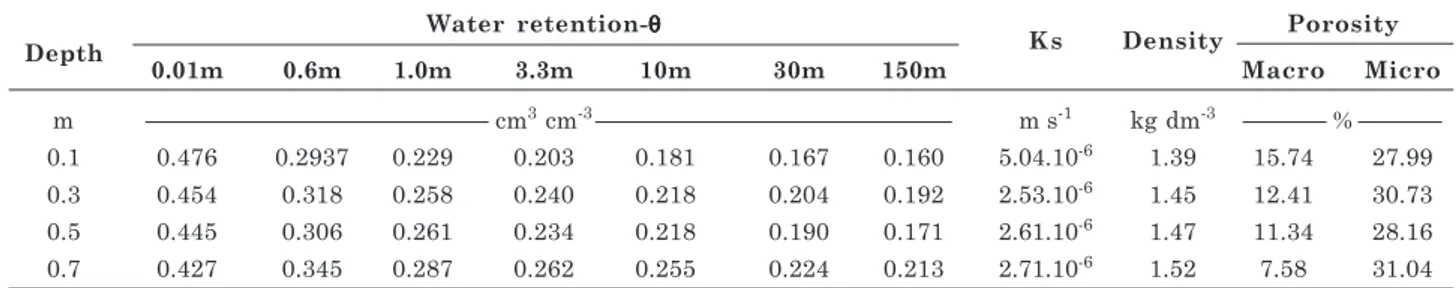
The experiment was carried out at Embrapa Mandioca e Fruticultura, Cruz das Almas - Bahia (latitude 12o 48’ S, longitude 39o 06’ W, 225 m asl). We used a drainage lysimeter constructed with glass fiber (volume 5.00 m3, width 2.0 m, length 2.5 m, and depth 1.0 m). To create a free drainage system, the bottom of the lysimeter was separated in two layers of 0.1 m. The lower layer contained a drainage system with 50 mm PVC tubes and crushed stone (size 12.5-4.8 mm) and the upper consisted of washed sand. After the soil had settled in the lysimeter, undisturbed soil samples were taken for particle-size analysis. The soil physical and hydrological characteristics are presented in table 1.
TDR probes were constructed in standard format with the following characteristics: three stainless steel rods (effective length without resin 0.1 m) spaced apart by 0.017 m, 50 Ohm coaxial cables, and a polyester resin layer at the tip of the rods (length 0.05 m). The soil moisture was determined based on the adjusted
values obtained by gravity, in relation to the measured data of the apparent dielectric constant (Ka). Calibration was performed as recommended by Topp et al. (1980). The calibration range that provided the equation resulting from the ratio of the Ka and moisture values was 0.0408 to 0.3749 cm3 cm-3 (Equation 3, Figure 1).
θ = 0.528860 + 0.090141 Ka -- 0.003979 Ka2 + 0.000065 Ka3
The soil moisture within the lysimeter was monitored in a profile, in which a mesh was installed consisting of TDR probes, distributed at points (r, z) of 0.20 × 0.20 m, where r and z, respectively, are the horizontal and vertical distances from the origin on the soil surface in the center of the lysimeter. The probes were installed during the packing of the soil in the drainage lysimeter. A total of 16 TDR probes were inserted horizontally into the profile, constituting a monitor profile (Figure 2).
The lysimeter was saturated and covered with plastic sheet to prevent evaporation. Then an internal drainage trial was performed with an automatic data acquisition system consisting of a pulse generator (TDR100 Campbell Scientific), connected to multiplexers. For TDR automation, we used the language BASIC (software CR Basic) to feed information to a data logger (model CR1000, Campbell Scientific), to determine and store dielectric constant values at 15 min intervals, for 670 h. The Ka values were transformed into volumetric soil-water content using equation 3, by which the variation of the water storage in the soil was calculated at each monitoring point and at 15 min intervals during the process of water redistribution. For the same time period the respective H/ z gradients were extrapolated. The matric potential values were determined from the moisture values using the water retention curves constructed in the laboratory. Thus, we calculated the K(θ) function following the criteria proposed by Hillel et al. (1972), based on the solution for equation:
Z Z
0 Z
z H
dZ t )
( K
¶ ¶ ¶q 
=
q
ò
(4)where θ (m3 m-3) is the volumetric soil-water content; t is time; K is hydraulic conductivity (m s-1); His the total water potential; and z is the depth.
Considering that H/ z = 1, we used the methods proposed by Libardi et al. (1980) and Sisson et al. (1980) to determine the parameters of equation 5:
K(θ)=K0
(q q0)
g
-e (5)
where: γ is the slope of the straight line lnK as a function of θ, K0 and θ0 values of K and θ at time zero of redistribution.
Substituting equation 5 in equation 4, we have: For Libardi et al. (1980):
÷ ø ö ç è æ g g + g = q
-q 1lnt 1ln azK0
0 (6)
For Sisson et al. (1980):
( )
k ( )ln t ln g 0 +g q-q0
z÷=
ø ö ç è æ
(7)
where the equations 6 and 7 were obtained in the redistribution process from θ0-θ linear regressions in function of ln(t) (Libardi et al., 1980) and θ - θ0 versus ln(z/t) (Sisson et al., 1980), where t is the time elapsed, z the depth and a = γ/γ. For both cases, the coefficients γ and K0 were calculated by the angular and linear regression coefficients and γ by the mean value of γ.
Indirectly, in the laboratory, we obtained the relation K(θ) × θ from the water retention curve and soil hydraulic conductivity (van Genuchten, 1980):
( )
m1 m 22 1
s
1 1 K
K
ú ú ú
û ù
ê ê ê
ë é
÷ ÷ ø ö ç
ç è æ
Q -Q = Q
(8)
where: Θ = (θ - θr) / (θs - θr) is the effective saturation; θr is the residual moisture; θs is the moisture at soil
saturation; and m is the dimensionless parameters of the retention curve of soil water. The hydraulic conductivity of saturated soil (Ks) was determined in the Laboratory of Soil Physics Embrapa Mandioca e Fruticultura by the constant head permeameter method (Youngs, 1991). Prior to saturation, undisturbed soil samples were taken from the lysimeter with an Uhland soil sampler (depths 0.1, 0.3, 0.5, and 0.7 m), with four replications per depth. From the same depths, with the same number of replications, undisturbed samples were taken to construct the retention curve in Richards pressure chambers.
The level of the water drained in the lysimeter was measured at the outlet of the system at time intervals (∆t) ranging from 1 to 24 h. The time interval between measurements was increased when a decrease of water redistribution in the soil was detected. At the times of drainage measurement, the water flow in the soil (depth z = 0.6 m) was estimated by equation 1, using the functions K(θ) obtained by the methods of Hillel et al. (1972), Libardi et al. (1980), Sisson et al. (1980), and van Genuchten (1980).
For ∆t > 1 h, equation 1 was integrated in relation to the end of the time interval, obtaining qi:
ò
+=
1 i
i t
t i qdt
q (9)
Water retention-θθθθθ
K s Density Porosity Depth
0.01m 0.6m 1.0m 3.3m 10m 30m 150m Macro Micro
m cm3 cm-3 m s-1 kg dm-3 %
0.1 0.476 0.2937 0.229 0.203 0.181 0.167 0.160 5.04.10-6 1.39 15.74 27.99
0.3 0.454 0.318 0.258 0.240 0.218 0.204 0.192 2.53.10-6 1.45 12.41 30.73
0.5 0.445 0.306 0.261 0.234 0.218 0.190 0.171 2.61.10-6 1.47 11.34 28.16
0.7 0.427 0.345 0.287 0.262 0.255 0.224 0.213 2.71.10-6 1.52 7.58 31.04
Table 1. Hydro-physical characteristics of the soil used to fill the lysimeters
Ks: Saturated hydraulic conductivity
0 0.05
0.1 0.15
0.2 0.25
0.3 0.35
0.4
5 10 15 20 25 30 35
Dielectric constant, Ka
Moisture, cm
cm
3
-3
Figure 1. Relationship between soil moisture θθθθθ and dielectric constant Ka, for the soil used in the experiment.
where qi is the estimated flow in the time interval ∆t >1 h (mm); ti corresponds to the beginning of the time interval ∆t (mm cm-1); and t
i+1 to the end of the time interval ∆t (mm cm-1).
With equation 2, we estimated the percolation levels corresponding to the time of drainage measurement in the lysimeters, considering the integral of the moisture values of the 16 monitoring points, at the specific times, for each layer of 0.1-0.7 m.
The values of matric potential (Ψm) were calculated from the moisture data obtained by equation 3 and by fitting the soil water retention curve according to van Genuchten (1980): a ú ú ú û ù ê ê ê ë é -÷÷ ø ö çç è æ q -q q -q = Y n 1 m 1 r r s m 1 (10)
The normality of data distribution of moisture in the profile was tested by the methodology recommended by Jones (1969), at 5 % probability. The percolation levels estimated by TDR were compared with the drainage values observed at the lysimeter outlet considering the data set for all time intervals and also grouping them into ∆t classes: ∆t 1 h; 1 h < ∆t 7 h and 7 h < ∆t 25 h. The percolation estimates were evaluated by fitting a simple linear regression model with the observed values y as a function of x values estimated by equations of the type:
y = ax + b, and the test proposed by Mayer et al.
(1994) was applied to check (confidence level 95 %) whether the estimated percolation values were equivalent to those observed at the drainage outlet of the lysimeters. The mean root square error (RMSE) was used for a complementary evaluation of the estimates of the percolation levels (Willmott, 1981):
(
)
5 , 0 N 1 i 2 i i1 P O
N RMSE ú ú û ù ê ê ë é -=
å
= -(11)where Pi values are estimated percolation levels (mm); Oi are values of the observed percolation levels and N is the number of pairs of values.
RESULTS AND DISCUSSION
Moisture distribution in the monitor profile
To test the data normality of the moisture values obtained over time within the lysimeter, we used the method recommended by Jones (1969), at a confidence level of 95 %. Thus, the hypothesis that the moisture values from the 16 monitoring points followed normal distribution was not rejected since the skewness (αˆ3)
and kurtosis (βˆ2) values calculated for four different evaluation times (Table 2) were within the recommended ranges: -1.019 (αˆ3) +1.019 and 1.68 (βˆ2) 4.73.
Based on the coefficient of variation and the mean and median values, it can be concluded that the system of initial soil saturation resulted in an adequate water distribution within the lysimeter, ensuring homogeneous experimental conditions.
Based on the coefficient of variation and the mean and median values, it can be concluded that the system of initial soil saturation resulted in an adequate water distribution within the lysimeter, ensuring homogeneous experimental conditions.
The behavior of the mean moisture values over time at the four soil depths in the lysimeter is shown in figure 3. At all depths, the maximum and minimum moisture values were within the limits of the Ka and θ values adjusted for the probe calibration under laboratory conditions. It was also noted (Figure 3) that the rates of moisture reduction with time (slope of the curves) behaved similarly at all measured depths. Libardi & Melo Filho (2006) interpret this fact as an indication that the process of redistribution and drying occurred approximately equally throughout the evaluation period. The establishment of water redistribution in the soil with parallel moisture profiles is an important condition for the use of methods such as those of Sisson et al. (1980) and Libardi et al. (1980). Thus, since the water left the profile via drainage only and moisture data were obtained at 10-min intervals, it was possible to estimate the percolation levels in the same time interval as that of the collection of the lysimeters drains.
Determination of the parameters of function K(θθθθθ)
The values of the equation parameters for the K(θ) function were estimated by the different studied methods (Tables 3 and 4). It is noteworthy that for the direct methods, the K(θ) functions were determined at three depths (0.2, 0.4 and 0.6 m), and by the use of the method of Hillel et al. (1972), the gradient ( H/ z) was calculated between 0.1 and 0.3 m, 0.3 and 0.5 m, and 0.5 and 0.7 m. To estimate the percolation levels (Equation 1), only the flow in the deepest layer was considered.
Observing the adjustment parameters of the
equation K0 and γ of equation K(θ) = = K0
(q q0)
g
-e ,
that each time selected to choose θ0 resulted in a given K0 value.
It was observed that the moisture contents at time zero (θ0) determined by the instantaneous profile method were lower than by the saturated volumetric soil-water content (θS) obtained in the laboratory, i.e., in the beginning the hydraulic conductivity (K0) was not equivalent to the saturated hydraulic conductivity (KS), resulting in a prediction of function K(θ) with a range of moisture values that differed between the field and laboratory methods.
It was observed that the moisture contents at time zero (θ0) determined by the instantaneous profile method were lower than by the saturated volumetric soil-water content (θS) obtained in the laboratory, i.e., in the beginning the hydraulic conductivity (K0) was not equivalent to the saturated hydraulic conductivity (KS), resulting in a prediction of function K(θ) with a range of moisture values that differed between the field and laboratory methods.
For parameter γ, the variations in the values obtained at different depths were lower than those found for parameter K0. For this parameter, variations in the order of 11.21, 23.06 and 25.86 %, respectively, were recorded by the methods of Hillel et al. (1972), Libardi et al. (1980) and Sisson et al. (1980).
The increase in the K(θ) values estimated by the different methods in relation to time, at the depth of 0.6m, shows that the distance between the K(θ) values estimated by the different methods is greatest at the beginning of the soil water redistribution process; the values estimated by the direct methods were higher than those estimated by the fitting of laboratory data (Figure 4). Mermoud & Xu (2006) compared the instantaneous profile method and the van Genuchten (1980) model and also estimated higher values of hydraulic conductivity for the former and attributed this fact to differences in the measurement scale of θ in the field and laboratory methods. The estimated K(θ) values tended to become more similar to the extent that soil water redistribution occurred; the methods of Sisson et al. (1980) and Libardi et al. (1980) had the most similar behavior.
270 280 290 300 310 320 330 340 350
0 50 100 150 200 250 300 350 400 450 500 550 600 650
Time, h
Water storage, mm
0,25 0,27 0,29 0,31 0,33 0,35 0,37 0,39
z - 0.1m z - 0.3m z - 0.5m z - 0.7m
Soil
oisture cm
.cm
m
,
3
-3
Figure 3. Distribution of average moisture in the
Time Mean Standard Coefficient of Skewness Kurtosis Total Median
devation variation coeff coeff. amplitude
h %
24 0.3416 0.0505 14.79 0.6172 1.9597 0.1530 0.3212
120 0.3240 0.0559 17.27 0.3806 1.7847 0.1710 0.3212
360 0.3068 0.0529 17.26 0.3438 1.7737 0.1587 0.2913
620 0.3051 0.0531 17.42 0.1972 1.7428 0.1620 0.3000
Table 2. Descriptive statistics for soil moisture (cm3 cm-3) measured at 16 monitoring points and four times
during soil water redistribution
Depth ααααα n θθθθθr θθθθθs Ks(1)
m m-1 cm3 cm-3 m s-1
0.2 3.73 2.09 0.1718 0.4767 5.04.10-6
0.4 4.89 1.72 0.1978 0.454 2.53.10-6
0.6 7.67 1.48 0.1733 0.4457 2.61.10-6
0.8 4.62 1.50 0.2097 0.4273 2.71.10-6 Table 3. Setting parameters of the function K(θθθθθ)
obtained by the van Genuchten(1980) approach
Analysis of percolation estimates
The results of the evaluations of regression between values of the levels in the lysimeter observed and estimated by equations 1 and 2 for all time drainage intervals are shown in table 5. The combined evaluation of the intercept and slope coefficient of the regression equations of observed values in relation to those predicted by the different methods tested, indicated the acceptance of the values predicted by equation 2 and Darcy-Buckingham using the function K(θ) obtained by the method proposed by Hillel et al. (1972) (Table 5).
Grouping the set of values of the observed and estimated levels in classes of time intervals as ∆t 1 h; 1 h < ∆t 7 h and 7 h < ∆t 25 h, we found that by the method of Hillel et al. (1972) the estimates of percolation levels at intervals equal to or smaller than 1h became less accurate. The reason is that the intercept and slope coefficient move away from 1 and 0, respectively, when used for estimates over longer intervals (Table 5). Therefore, continuous monitoring, automatic and over short periods of soil water storage, were the best alternative to predict values percolating soil water. The method can be used in laboratory or field conditions, requiring only the calibration of the probe to be used according to its geometry and rod size and the characteristics of the soil of readings.
In the linear regression analysis of the percolation levels observed in the lysimeter and estimated by the methods of van Genuchten (1980), Sisson et al. (1980)
and Libardi et al. (1980) we obtained values of p<0.05 (Mayer et al., 1994), i.e., the drainage levels predicted by these methods were not equivalent and were lower than those measured in lysimeters.
The slope coefficient found in the relationship between the observed data and values estimated by the method of van Genuchten (1980) indicate that this method underestimates the percolation levels. Marion et al. (1994) stated that one of the advantages of using van Genuchten (1980) is the possibility of obtaining K values over a wide range. It was actually observed in this study that the range of parameters obtained in the laboratory to predict the K(θ) function is broader, but did not correspond to those obtained in the field, leading to errors in the prediction of water flow. Ghiberto & Moraes (2011) explained that the discrepancy of this method is possibly also due to the fact that its performance depends on the Ks value, which the authors see as a major simplification.
Despite the differences in the methods of Libardi et al. (1980) and Sisson et al. (1980) in calculating K(θ), similarities were observed in the results obtained by these two methods. It was noted that the ratio of the variation in drainage levels from the lysimeters were described by the variability in the levels estimated similarly and satisfactorily by the two methods (determination coefficients of 95.5 and 95.9 %). However, based on the regression coefficients, it appears that the unit value (1 mm) of the observed drainage level corresponds to 0.44 and 0.65 mm, respectively, of the level estimated by Darcy-Buckingham when using the K(θ) function adjusted by Libardi et al. (1980) and Sisson et al. (1980). This shows that, despite the high agreement degree of relationship (θ0-θ) versus ln(t) and (θ-θ0) versus ln (z/t), if H/ z = 1 is admitted can result in errors in estimating the hydraulic conductivity in the profile.
Although the experimental procedures in this study were carried out in a soil with disturbed structure and accommodated in a lysimeter, the good performance of equation 1 in different intervals of drainage time suggests its application under different conditions of pore distribution and water redistribution in the soil. For enabling continuous, automatic moisture monitoring at different points in the soil and in short time intervals, the TDR technique is an alternative to enhance the precision and accuracy of z θθθθθ0
Hillel et al. (1972) Libardi et al. (1980) Sisson et al. (1980)
K0 γγγγγ R2 K
0 γγγγγ R2(1) K0 γγγγγ R2(1)
m m s-1 m s-1 mm h-1
0.2 0.339 3.2.10-7 51.45 0.918 6.1.10-7 124.53 0.96 4.9.10-7 120.2 0.96
0.4 0.3485 1.1.10-6 43.64 0.976 1.4.10-6 114.15 0.92 1.1.10-6 105.3 0.92
0.6 0.360 1.5.10-6 54.47 0.936 1.7.10-6 78.125 0.90 1.9.10-6 70.47 0.90
Table 4. Parameters of the K(θθθθθ) function obtained by different methods
(1)R2: of regression (θ
0-θ) in function of ln(t) and (θ-θ0) in function of ln(z/t).
K(
), m s
q
-1
Time, h
studies focused on percolation into different soil types. However, as reserved by Silva & Coelho (2013), prior to determining water percolation into the soil with TDR the number of probes necessary to monitor soil moisture must be determined.
CONCLUSIONS
1. The results suggest that the percolation level in the field or laboratory can be estimated based on continuous, automatic moisture monitoring in short time intervals of the varying water storage in soil with TDR. This method has similar precision and accuracy as the lysimeter and some advantages over the other tested methods. The greatest advantages are the possibility of percolation estimates in short time intervals and the exemption from the need to predetermine soil hydraulic properties such as water retention and hydraulic conductivity.
2. The use of the Darcy-Buckingham equation to estimate the percolation levels using the function K(è) predicted by the method of Hillel et al. (1972) provided estimates of water percolation values compatible with those obtained in the lysimeter at time intervals greater than 1 h.
Item (y= a+bx) TDR
Darcy-Buckingham
van Hillel et al. Libardi et al. Sisson et al.
Genuchten (1980) (1972) (1980) (1980)
Set of values (0 <∆t < 25 h)
Intercept (a) -0.047 -0.063 -0.078 0.142 0.076
Slope (b) 1.073 34.18 1.014 1.947 1.410
Value P (H0: a= 0 and b=1) 0.4694 <0.05 0.89784 <0.05 <0.05
RMSE 0.6701 2.662 0.6525 1.432 0.919
∆t 1 h
Intercept (a) 0.1283 -0.1541 -0.2063 0.1132 0.06
Slope (b) 0.7124 36.73 1.1765 1.4777 1.13
Value P (H0: a= 0 and b=1) 0.1874 <0.05 <0.05 <0.05 <0.05
RMSE 0.2186 0.6898 0.1218 0.3124 0.1632
1 h <∆t 7 h
Intercept (a) -0.55 -0.0608 -0.1020 0.1562 0.1038
Slope (b) 1.37 37.22 1.1410 1.9068 1.4027
Value P (H0: a= 0 and b=1) 0.1119 <0.05 0.2820 <0.05 <0.05
RMSE 0.8062 2.6562 0.5519 1.3995 0.9128
∆t > 8 h
Intercept (a) 0.3567 -0.1579 -0.2868 0.5443 0.3627
Slope (b) 0.9473 33.4467 1.0056 1.8377 1.3412
Value P (H0: a= 0 and b=1) 0.7246 <0.05 0.8542 <0.05 <0.05
RMSE 0.8058 3.8044 1.015 2.0829 1.3296
Table 5. Statistics for the regression between the percolation levels observed in lysimeters (y-axis) and estimated (x-axis) by the methods of TDR
3. The methods of Libardi et al. (1980), Sisson et al. (1980) and van Genuchten (1980) underestimated the water drainage.
LITERATURE CITED
ADHANOM, G.T.; STIRZAKER, R.J.; LORENTZ, S.A.; ANNANDALE, J.G. & STEYN, J.M. Comparison of methods for determining unsaturated hydraulic conductivity in the wet range to evaluate the sensitivity of wetting front detectors. Water SA, 38:67-76, 2012. ARYA, L.M. & HEITMAN, J.L. Hydraulic conductivity function
from water flow similarity in idealized- and natural-structure pores. Soil Sci. Soc. Am. J., 74:787-796, 2010. BARAM, S.; KURTZMAN, D. & DAHAN, O. Water percolation
through a clayey vadose zone. J. Hydrol., 424/425:165-171, 2012.
GHIBERTO, P.J. & MORAES, S.O. Comparação de métodos de determinação da condutividade hidráulica em um Latossolo Vermelho-Amarelo. R. Bras. Ci. Solo, 35:1177-1188, 2011.
GHIBERTO, P.J.; LIBARDI, P.L.; BRITO, A.S. & TRIVELIN, P.C.O. Components of the water balance in soil with sugarcane crops. Agric. Water Manage., 102:1-7, 2011. HILLEL, D.; KRENTOS, V.D. & STYLIANOV, Y. Procedure
and test of an internal drainage method for measuring soil hydraulic characteristic in situ. Soil Sci., 114:395-400, 1972. JIMÉNEZ-MARTÍNEZA, J.; SKAGGS, T.H.; van GENUCHTEN, M.Th. & CANDELA, L. A root zone modelling approach to estimating groundwater recharge from irrigated areas. J. Hydrol., 367:138-149, 2009. JONES, T. A. Skewness and kurtosis as criteria of normality
in observed frequency distributions. J. Sedim. Petrol., 39:1622-1627, 1969.
LIBARDI, P. L. & MELO FILHO, J. F. Análise exploratória e variabilidade dos parâmetros da equação da condutividade hidráulica, em um experimento de perfil instantâneo. R. Bras. Ci. Solo, 30:197-206, 2006.
LIBARDI, P.; REICHARDT, K.; NIELSEN, D.P. & BIGGAR, J.W. Simple field methods for estimating soil hydraulic conductivity. Soil Sci. Soc. Am. J., 44:3-7, 1980.
MARION, J.M.; OR, D.; ROLSTON, D.E.; KAVVAS, M. L. & BIGGAR, J.W. Evaluation of methods for determining soil-water retentivity and unsaturated hydraulic conductivity. Soil Sci., 158:1-13, 1994.
MAVIMBELA, S.S.W. & van RENSBURG, L.D. Evaluating models for predicting hydraulic characteristics of layered soils. Hydrol. Earth Syst. Sci., 9:301-336, 2012.
MERMOUD, A. & XU, D. Comparative analysis of three methods to generate soil hydraulic functions. Soil Till. Res., 87:89-100, 2006.
MUBARAK, I.; ANGULO-JARMILLO, R.; MAILHOL, J.C.; RUELLE, P.; KHALEDIAN, M. & VAUCLIN, M. Spatial analysis of soil surface hydraulic properties: Is infiltration method dependent? Agric. Water Manage., 97:1517-1526, 2010. MAYER, D.G.; STUART, M.A. & SWAIN, A.J. Regression of real-world data on model output: An appropriate overall test of validity. Agric. Syst., 45:93-104, 1994.
REICHARDT, K. & TIMM, L.C. Solo, planta e atmosfera: Conceitos, processos e aplicações. 2.ed. Barueri, Manole, 2012. 500p.
REICHARDT, K.; PORTEZAN, O.; LIBARDI, P.L.; BACCHI, O.O.S.; MORAES, S.O.; OLIVEIRA, J.C.M. & FALLEIROS, M.C. Critical analysis of the field determination of soil hydraulic conductivity functions using the flux-gradient approach. Soil Till. Res., 48:81-89, 1998.
SANT’ANA, J.A.V.; COELHO, E.F.; SILVA JUNIOR, J.J.; SANTANA JUNIOR, E.B. & VEINROMBER JUNIOR, L.A.A. Desempenho de sondas de TDR manufaturadas de diferentes comprimentos de hastes. R. Bras. Ci. Solo, 36:1123-1130, 2012.
SELLE, B.; MINASNY, B.; BETHUNE, M.; THAYALAKUMARAN, T. & SUBHASH, C. Applicability of Richards’ equation models to predict deep percolation under surface irrigation. Geoderma, 160:569-578, 2011.
SÉRÉ, G.; OUVRARD, S.; MAGNENET, V.; PEY, B.; MOREL, J.L. & SCHWARTZ, C. Predictability of the evolution of the soil structure using water flow modeling for a constructed technosol. Vadose Zone J.,11:1-13, 2012.
SILVA, A.J.P. & COELHO, E.F. Water percolation estimated with time domain reflectometry (TDR) using drainage lysimeters. R. Bras. Ci. Solo, 37:929-927, 2013. SILVA, A.J.P.; COELHO, E.F.; MIRANDA, J.H. &
WORKMAN, S.R. Estimating water application efficiency for drip irrigation emitter patterns on banana. Pesq. Agropec. Bras.,44:730-737, 2009.
SILVA, A.L.; REICHARDT, K.; ROVERATTI, R.; BACCHI, O.O.S.; TIMM, L.C.; OLIVEIRA, J.C.M. & DOURADO-NETO, D. On the use of soil hydraulic conductivity functions in the field. Soil Till. Res, 93:162-170, 2007. SISSON, J.B.; FERGUSON, A.H. & van GENUCHTEN,
M.Th. Simple method for predicting drainage from field plots. Soil Sci. Soc. Am. J., 44:1147-1152, 1980. TOPP, G.C.; DAVIS, J.L. & ANNAN, A. Electromagnetic
determination of soil water content: measurement in coaxial transmission lines. Water Resour. Res., 16:574-582, 1980.
van GENUCHTEN, M.Th. A closed-form equation for predicting the hydraulic conductivity of unsaturated soils. Soil Sci. Soc. Am. J., 44:892-898,1980.
WESSOLEK, G.; SCHWARZEL, K.; GREIFFENHAGEN, A. & STOFFREGEN, H. Percolation characteristics of a water-repellent sandy forest soil. Eur. J. Soil Sci., 59:14-23, 2008.
WEYNANTS, M.; VEREECKEN, H. & JAVAUX, M. Revisiting Vereecken pedotransfer functions: Introducing a closed-form hydraulic model. Vadose Zone J., 8:86-95, 2009.
WILLMOTT, C.J. On the validation of models. Phys. Geogr., 2:184-194, 1981.