Different Oils
Mail Address
Keywords Author(s)
Arrived: March/2009 Approved: October/2009
ABSTRACT
A trial was carried out at the Animal Science Department of the Federal University of Viçosa to evaluate the performance of heavy and light layers. During four periods of twenty-eight days, 432 layers in the second production cycle, being 216 Hy Line W36 (light birds) and 216 Hy Line Brown (heavy birds), were used. A completely randomized experimental design with a 1+(4x2x2) factorial arrangement (one control treatment, four oil sources, two inclusion levels, and two genetic lines) with four replicates of six birds per experimental unit, was applied. The treatments consisted of diets containing 16.5% crude protein, formulated to supply the nutritional requirements, and the inclusion of each oil source at 2 or 4%. Soybean, canola, linseed and fish oils were used. The control diet did not contain any oil. The studied parameters were: feed intake (g/hen/day), egg production (%), egg weight (g), egg mass (g/hen/day), feed conversion ratio (kg feed /dozen of eggs and per kg eggs). Oil levels and sources did not influence egg mass, feed conversion ratio (per kg eggs and dozen eggs), or egg production. During the first three periods, independently of oil source or genetics, eggs from layers fed 4% oil were the heaviest, except for those of light birds fed soybean oil during the third period, which egg weight was similar for the 2 and 4% levels. Light layers presented lower feed intake and better feed conversion ratio (per kg eggs and dozen eggs) as compared to heavy layers, and there was no influence of the evaluated oil sources on feed intake.
INTRODUCTION
The market of “nutraceutics” or “functional foods” is steadily growing. These foods, in addition to their natural nutrition characteristics, also have in their composition some extra factor that may benefit the individual’s health status, such as eggs enriched with polyunsaturaded fatty acids (PUFAs) (Muramatsu, 2005).
According to Franco & Sakamoto (2005), layer nutrition, in addition to affecting egg physical quality (size, component percentage, eggshell strength), may also influence its nutritional quality (chemical composition). Therefore, several fatty-acid sources, particularly in the form of oil, have been added to layers diets with good results in terms of PUFA levels in the eggs (Caston & Leeson, 1990). However, the results of studies found in literature on the performance of layers fed diets containing different levels of different oils are controversial.
Some authors did not find any differences in the performance of layers fed different oil sources (Yu & Sim, 1987; Hargis et al., 1991; Nash et al., 1996). Costa et al. (2008) did not observe worse performance in heavy layers fed a diet containing 2% linseed oil as compared to those fed a control diet based on corn and soybean meal. Also, Baucells
Lelis GR1
Silva MD da3
Tavernari F de C3
Albino LFT2
Rostagno HS2 1
Post-graduation student in Monogastric Nutrition - UFV ([email protected]).
2
Professor DZO/UFV.
3 Post-graduation student in Animal Science
- UFV.
et al. (2000) did not find any differences in the feed intake of layers receiving a diet with 4% linseed oil.
On the other hand, worse performance, particularly in terms of lighter eggs and reduced feed intake, was reported when linseed and fish oils were included in layer diets (Scheideler and Froning, 1996; Van Elswyk, 1997; Gonzales-Esquerra & Leeson, 2000). According to Muramatsu et al. (2008), high levels of soybean oil in layer diets may have a negative impact on eggshell quality.
The aim of this study was to evaluate the effect of the inclusion of different oils (soybean, canola, linseed, and fish oils) on the performance of two genetic lines of layers.
MATERIAL AND METHODS
The experiment was carried out at the poultry sector of the Department of Animal Science of the Federal University of Viçosa, Brazil. The trial was carried out in four experimental periods of 28 days each.
A total number of 432 layers, being 216 Hy Line W36 (light layers) and 216 Hy Line Brown (heavy layers), was used. Birds were housed in 100 x 40 x 45cm cages subdivided into four 25-cm compartments in an open-side poultry house covered with clay tiles. Birds were submitted to the general management recommended by the commercial genetics company (Hy Line W36, 1997, and Hy Line Brown, 1995).
Layers were submitted to forced molting, and when reaching 50% lay, they were weighed and housed in the cages. After a 15-day adaptation period, egg collection started. Eggs were collected twice daily (at 7:00 am and 2:00 pm, at feeding time). After 45 days of observation, 410 layers of both strains that presented the highest egg production were redistributed in the cages, alternating flocks of light and heavy layers. A completely randomized experimental design in a 1 + ( 4 x 2 x 2) factorial arrangement, with a control treatment, four different oil sources (soybean, canola, linseed, or fish oil), two oil inclusion levels (2 or 4%), and two commercial genetic strains (HLW-36 or HLB), with nine treatments of four replicates of six birds each, was applied. Two birds were housed per cage, with three cages per replicate; one cage was left empty between replicates. Experimental diets were based on corn and soybean meal, and each oil source was added at 2 or 4%, except for the control diet, which did not have any oil included. Feeds were formulated to supply layer nutritional requirements according to the recommendation of
Egg production, average egg weight, egg mass, feed intake, and feed conversion ratio were measured in four 28-day periods.
Data were submitted to statistical analysis using SAEG (System for Statistical and Genetic Analysis) software package (UFV, 1997). Each parameter was submitted to analysis of variance, and treatment means were compared by the F test. When interactions were significant, they were studied in detail.
RESULTS AND DISCUSSION
Egg production
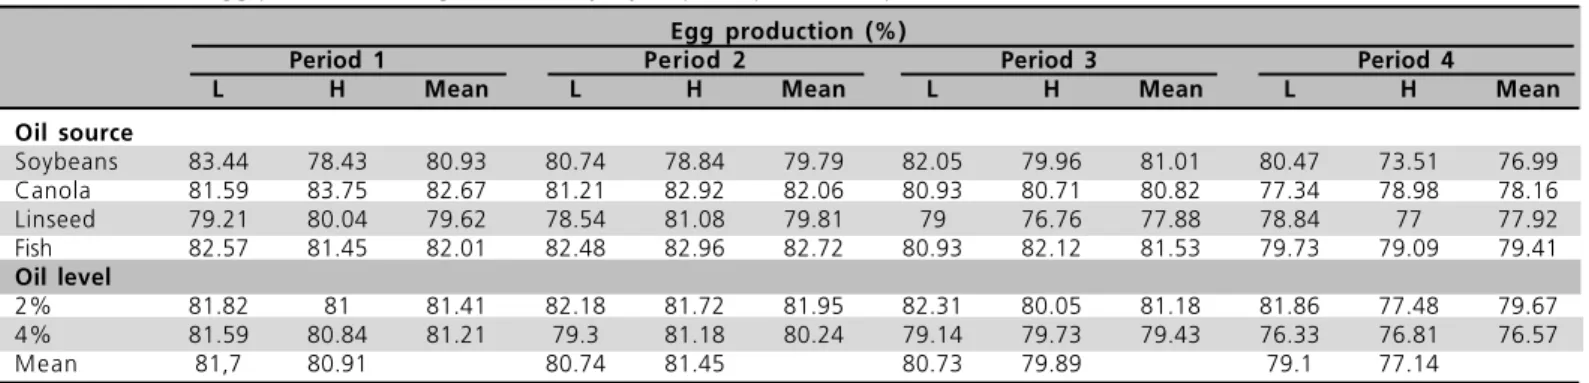
Neither oil sources nor levels influenced egg production in neither of the strains during the four studied periods as determined by the F test at 5% Rostagno et al. (1996) (Table 1). Birds received water ad libitum during the entire experimental period.
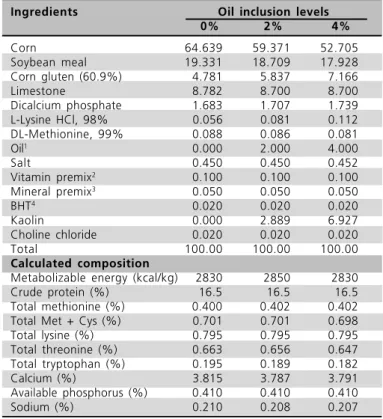
Table 1 – Chemical and ingredient composition of the
experimental diets.
Ingredients Oil inclusion levels
0% 2% 4%
Corn 64.639 59.371 52.705 Soybean meal 19.331 18.709 17.928 Corn gluten (60.9%) 4.781 5.837 7.166 Limestone 8.782 8.700 8.700 Dicalcium phosphate 1.683 1.707 1.739 L-Lysine HCl, 98% 0.056 0.081 0.112 DL-Methionine, 99% 0.088 0.086 0.081 Oil1
0.000 2.000 4.000 Salt 0.450 0.450 0.452 Vitamin premix2 0.100 0.100 0.100
Mineral premix3
0.050 0.050 0.050 BHT4
0.020 0.020 0.020 Kaolin 0.000 2.889 6.927 Choline chloride 0.020 0.020 0.020 Total 100.00 100.00 100.00
Calculated composition
Metabolizable energy (kcal/kg) 2830 2850 2830 Crude protein (%) 16.5 16.5 16.5 Total methionine (%) 0.400 0.402 0.402 Total Met + Cys (%) 0.701 0.701 0.698 Total lysine (%) 0.795 0.795 0.795 Total threonine (%) 0.663 0.656 0.647 Total tryptophan (%) 0.195 0.189 0.182 Calcium (%) 3.815 3.787 3.791 Available phosphorus (%) 0.410 0.410 0.410 Sodium (%) 0.210 0.208 0.207
1
Oil sources: soybean oil, canola oil, linseed oil, or fish oil. 2
Vitamin supplement - Rovimix (Roche) – Guaranteed levels per kg product: Vitamin A – 10,000,000 IU; Vitamin D3 – 2,000,000 IU; Vitamin E – 30,000 IU; Vitamin B1 2.0 g; Vitamin B6 4.0 g; Pantothenic acid -12.0 g; Biotin - 0.10 g; Vitamin K3 - 3.0 g; Folic acid - 1.0 g; Nicotinic acid - 50.0 g; Vitamin B12 – 15,000 mcg; selenium - 0.25 g, and vehicle q.s.p. – 1,000 g. 3
Mineral supplement Roligomix (Roche) -Guaranteed levels per kg product: manganese 16.0 g; iron - 100.0 g, zinc - 100.0 g; copper - 20.0 g; cobalt - 2.0 g; iodine - 2.0 g, and vehicle q.s.p.- 1,000 g.4
probability. There was no influence of genetic line on egg production. The obtained values are compatible with those of second-cycle layers (Table 2).
These results are different from those of Costa et al. (2008), who found a linear effect of different soybean oil levels on egg production, whereas canola oil did not influence this parameter. Rodrigues et al. (2005) found that egg production decreased when soybean oil was not supplemented in the feed, and that it increased as soybean oil was included in the diet, being the highest at the maximum level of soybean oil inclusion (8%).
On the other hand, the present results are consistent with those reported by Brugalli et al. (1998) and Muramatsu et al. (2005), who did not observe any effect of dietary oil inclusion levels on egg production.
Average egg weight
Layer genetic line and oil levels influenced mean egg weight during the first two experimental periods. Mean egg weight of heavy layers (67.21g in period 1 and 68.68g in period 2) was significantly higher (P<0.01) than those of light layers (65.3g and 66g in periods 1 and 2, respectively). As to dietary oil levels, independently of genetic line and oil source, the inclusion of 4% oil in the diets resulted in significantly heavier eggs (P<0.01) (66.94g and 68.05g in periods 1 and 2, respectively) as compared to the eggs produced when oil was added at 2% (65.64g and 66.97g in periods 1 and 2, respectively).
In the study of Rabello et al. (2003), layers fed 3% soybean oil produced heavier eggs. On the other hand, in Costa et al. (2008), Rodrigues et al. (2005), and Maramatsu et al. (2005), dietary oil levels did not influence egg weight.
During periods 3 and 4, there were significant
These results are consistent with the findings of Whitehead et al. (1993), who studied the inclusion of different inclusion levels of different oil and fat sources, and found that layers fed 4% oil produced the heaviest eggs. The most efficient oil sources were those rich in 18 carbon atoms and moderately unsaturated that, according to the authors, have a hormonal action as they influence the metabolism of estrogen, which synthesis depends on triglyceride synthesis in the liver.
During period 4, heavy layers produced the heaviest eggs, except for those fed 2% soybean oil, which mean egg weight was not different between the two genetic lines (light and heavy layers), as determined by Tukey’s test (P>0.05) (Table 5).
interactions (P<0.05) among oil source vs. genetics vs. oil levels. These interactions were studied using the test of Tukey (α = 5%).
During period 3, the heaviest eggs were produced by the birds fed 4% oil. Except for the light layers fed soybean oil, there was no significant difference, as tested by Tukey’s test (P>0.05) between 2 or 4% oil inclusion level (Table 3 and 4).
Table 3 - Effect of oil levels within the genetics and oil sources
on egg weight.
Egg weight (g), period 3
2%Oil 4%Oil
L H L H
Oil source
Soybeans 66.49 Aa 66.63 Aa 66.09 Bb 72.06 Aa Canola 65.97 Aa 66.84 Aa 70.00 Aa 70.41 Aa Linseed 65.09 Aa 67.09 Aa 68.84 ABa 70.71 Aa Fish 65.68 Aa 66.98 Aa 68.67 ABa 70.00 Aa Means within same oil level, followed by the same capital letter in the columns and the same small letter in row are not different at 5% level of probability by Tukey’s test.
Table 2 - Mean egg production of light and heavy layers per experimental period as a function of oil source and level.
Egg production (%)
Period 1 Period 2 Period 3 Period 4
L H Mean L H Mean L H Mean L H Mean
Oil source
Soybeans 83.44 78.43 80.93 80.74 78.84 79.79 82.05 79.96 81.01 80.47 73.51 76.99 Canola 81.59 83.75 82.67 81.21 82.92 82.06 80.93 80.71 80.82 77.34 78.98 78.16 Linseed 79.21 80.04 79.62 78.54 81.08 79.81 79 76.76 77.88 78.84 77 77.92 Fish 82.57 81.45 82.01 82.48 82.96 82.72 80.93 82.12 81.53 79.73 79.09 79.41
Oil level
2% 81.82 81 81.41 82.18 81.72 81.95 82.31 80.05 81.18 81.86 77.48 79.67 4% 81.59 80.84 81.21 79.3 81.18 80.24 79.14 79.73 79.43 76.33 76.81 76.57 Mean 81,7 80.91 80.74 81.45 80.73 79.89 79.1 77.14
Table 5 - Effect of oil levels within genetic line and oil source on egg weight.
Egg weight (g), period 4
2%Oil 4%Oil
L H L H
Oil source
Soybeans 64.46 Aa 63.54 Ba 64.27 Ab 68.70 Aa Canola 64.78 Ab 68.58 Aa 65.57 Ab 69.73 Aa Linseed 63.59 Ab 68.27 Aa 65.36 Ab 67.93 Aa Fish 65.19 Ab 68.05 Aa 66.34 Ab 69.00 Aa Means within same oil level, followed by the same capital letter in the columns and the same small letter in row are not different at 5% level of probability by Tukey’s test.
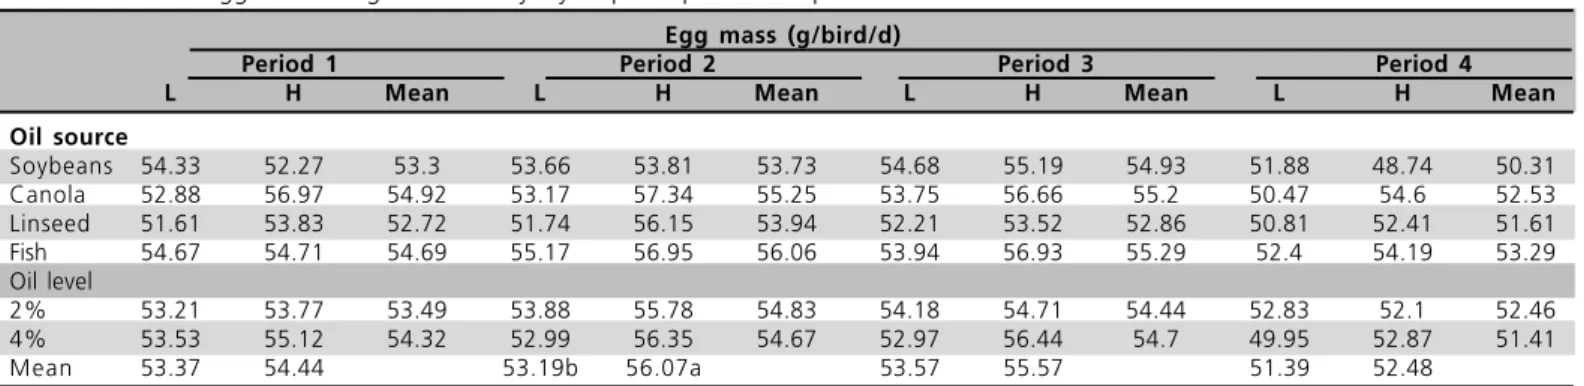
Egg mass
Egg mass (Table 6) was not influenced (P>0.05) by genetic line during experimental periods 1, 3, or 4, nor by oil source or level during all 4 experimental periods. However, during period 2, the mass of heavy layer eggs (56.07 g/bird/day) was significantly higher (P<0.05) than that of light layer eggs (53.19 g/bird/day).
Feed intake
The feed intake of heavy layers (121.09 g/bird/day, 119 g/bird/day, 118 g/bird/day, and 116.03 g/bird/day in periods 1, 2, 3, and 4, respectively) was significantly higher (P<0.01) than that of light layers (97.71 g/bird/ day, 94.44 g/bird/day, 100.39 g/bird/day, and 91.82 g/ bird/day in periods 1, 2, 3, and 4, respectively). These results are explained by the fact that heavy layers are
larger than light layers, and consequently require more feed to supply their maintenance and production needs. This is consistent with the findings of Barreto (1994), who worked with heavy and light layers, and observed higher feed intake in heavy layers during lay. Oil source did not influence feed intake in none of the experimental periods. Oil levels promoted a significant difference in feed intake only during the first experimental period, when a significant effect (P<0.05) of the interaction between oil source and oil level was observed in layers fed soybean oil, with those fed 2% presenting lower feed intake as compared to those fed 4%.
Muramatsu et al. (2005) did not find any effect of soybean oil supplementation on feed intake, as well as Rodrigues et al. (2005) and Costa et al. (2008). On the other hand, Keshavarrz & Nakajima (1995) verified that the dietary inclusion of 4% lipids (a mixture of animal and vegetable fats) impaired feed intake.
Feed conversion ratio
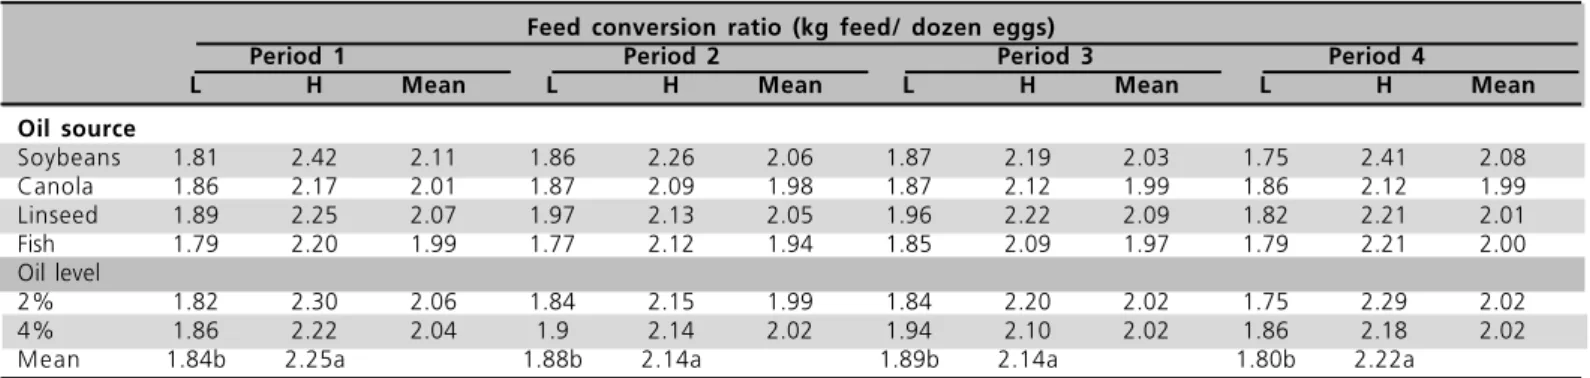
Average feed conversion ratio values, expressed as kg feed per dozen eggs, of light layers were better (P<0.01) as compared to those of heavy layers (Table 7) during the four experimental periods, which is compatible with the lower feed intake recorded for that genetic line. When feed conversion ratio was expressed as kg feed per kg eggs, the mean values of light layers were also better (P<0.01) as compared to heavy layers (Table 8).
Table 4 - Effect of oil sources within genetic line and oil level added to diets on egg weight.
Egg weight (g), period 3
Soybean oil Canola oil Linseed oil Fish oil
L H L H L H L H
Oil levels
2% 66.49 Aa 66.63 Ba 65.97 Ba 66.84 Ba 65.09 Ba 67.09 Ba 65.68 Ba 66.98 Ba 4% 66.09 Ab 72.06 Aa 70.00 Aa 70.41 Aa 68.84 Aa 70.71 Aa 68.67 Aa 70.00 Aa Means within same oil source, followed by the same capital letter in the columns and the same small letter in row are not different at 5% level of probability by Tukey’s test.
Table 6 – Mean egg mass of light and heavy layers per experimental period as a function of oil source and level.
Egg mass (g/bird/d)
Period 1 Period 2 Period 3 Period 4
L H Mean L H Mean L H Mean L H Mean
Oil source
Soybeans 54.33 52.27 53.3 53.66 53.81 53.73 54.68 55.19 54.93 51.88 48.74 50.31 Canola 52.88 56.97 54.92 53.17 57.34 55.25 53.75 56.66 55.2 50.47 54.6 52.53 Linseed 51.61 53.83 52.72 51.74 56.15 53.94 52.21 53.52 52.86 50.81 52.41 51.61 Fish 54.67 54.71 54.69 55.17 56.95 56.06 53.94 56.93 55.29 52.4 54.19 53.29 Oil level
2% 53.21 53.77 53.49 53.88 55.78 54.83 54.18 54.71 54.44 52.83 52.1 52.46 4% 53.53 55.12 54.32 52.99 56.35 54.67 52.97 56.44 54.7 49.95 52.87 51.41 Mean 53.37 54.44 53.19b 56.07a 53.57 55.57 51.39 52.48
Table 7 - Mean feed conversion ratio (kg feed/ dozen eggs) of light and heavy layers per experimental period as a function of oil source
and level.
Feed conversion ratio (kg feed/ dozen eggs)
Period 1 Period 2 Period 3 Period 4
L H Mean L H Mean L H Mean L H Mean
Oil source
Soybeans 1.41 1.93 1.67 1.53 1.95 1.74 1.44 1.74 1.59 1.35 1.90 1.62 Canola 1.44 1.77 1.60 1.47 1.72 1.59 1.44 1.72 1.58 1.45 1.76 1.60 Linseed 1.48 1.81 1.64 1.55 1.76 1.65 1.5 1.79 1.64 1.40 1.81 1.60 Fish 1.42 1.78 1.60 1.42 1.74 1.58 1.42 1.68 1.55 1.41 1.81 1.61
Oil level
2% 1.42 1.82 1.62 1.44 1.77 1.60 1.40 1.75 1.57 1.35 1.84 1.59 4% 1.46 1.82 1.64 1.55 1.82 1.68 1.50 1.72 1.61 1.45 1.80 1.62 Mean 1.44b 1.81a 1.50b 1.78a 1.45b 1.72a 1.40b 1.81a
Means followed by different letters are different among periods by the F test (P<0.05).
Table 8 - Mean feed conversion ratio (kg feed/kg eggs) of light and heavy layers per experimental period as a function of oil source and level.
Feed conversion ratio (kg feed/ dozen eggs)
Period 1 Period 2 Period 3 Period 4
L H Mean L H Mean L H Mean L H Mean
Oil source
Soybeans 1.81 2.42 2.11 1.86 2.26 2.06 1.87 2.19 2.03 1.75 2.41 2.08 Canola 1.86 2.17 2.01 1.87 2.09 1.98 1.87 2.12 1.99 1.86 2.12 1.99 Linseed 1.89 2.25 2.07 1.97 2.13 2.05 1.96 2.22 2.09 1.82 2.21 2.01 Fish 1.79 2.20 1.99 1.77 2.12 1.94 1.85 2.09 1.97 1.79 2.21 2.00 Oil level
2% 1.82 2.30 2.06 1.84 2.15 1.99 1.84 2.20 2.02 1.75 2.29 2.02 4% 1.86 2.22 2.04 1.9 2.14 2.02 1.94 2.10 2.02 1.86 2.18 2.02 Mean 1.84b 2.25a 1.88b 2.14a 1.89b 2.14a 1.80b 2.22a
Means followed by different letters are different among periods by the F test (P<0.05).
However, when oil sources and levels were analyzed, no significant differences were detected in feed conversion ratio. Similar results were obtained by Muramatsu et al. (2005) and Rodrigues et al. (2005), who also did not observe any effects of soybean oil levels on feed per dozen eggs.
CONCLUSIONS
The oil sources and levels used in the present experiment did not influence egg production, egg mass, or feed conversion ratio (per dozen eggs and per kg eggs) of heavy or light commercial layers.
REFERENCES
Barreto SLT. Efeitos de níveis de fósforo disponível durante o pico de postura para duas linhagens de poedeiras comerciais leves [dissertação]. Lavras (MG): Escola Superior de Agricultura de Lavras; 1994.
Baucells MD, Crespo AC, López-Ferrer S, Grashorn MA. Incorporation of different polyunsaturated fatty acids into eggs. Poultry Science 2000; 79:51-59.
Brugalli I, Rutz F, Roll VFB. Interação entre níveis de gordura e de proteína da dieta sobre a qualidade da casca e desempenho de poedeiras durante o verão. Revista Brasileira de Agrociência 1998; 4(3):158-160.
Caston LJ, Leeson S. Dietary flax and egg composition. Poultry Science 1990; 69:1617–1620.
Costa FGP, Souza JG, Silva JHV, Rabello CB, Goulart CC, Lima Neto RC. Influência do óleo de linhaça sobre o desempenho e a qualidade dos ovos de poedeiras semipesadas. Revista Brasileira de Zootecnia 2008; 37(5):861-868.
Franco JRG, Sakamoto MI. Qualidade dos ovos: uma visão geral dos fatores que a influenciam. Revista Ave World 2005; 3(16):20-24.
Gonzales – Esquerra R, Leeson S. Effect of feeding hens regular or deodorized Menhaden oil on production parameters, yolk fatty acid profile, and sensory quality of eggs. Poultry Science 2000; 79:1597-1602.
Hargis PS, Van Elswyk ME, Hargis BM. Dietary modification of yolk lipid with menhaden oil. Poultry Science 1991; 70:874-883.
Hy Line Brown. Manual de manejo. Nova granada: ITO; 1995. 16p.
Muramatsu K, Stringhini, JH, Café MB et al. Desempenho, qualidade e composição de ácidos graxos do ovo de poedeiras comerciais alimentadas com rações formuladas com milho ou milheto contendo diferentes níveis de óleo vegetal Acta Scientiarum. Animal Sciences 2005; 27(1):43-48.
Nash DM, Hamilton RMG, Sanford KA, Hulan HW. The effect of dietary menhaden meal and storage on the omega-3 fatty acids and sensory attributes of egg yolk in laying hens. Canadian Journal of Animal Science 1996; 76:377-383.
Rabello CBV, Pinto AL, Ribeiro HU et al. Efeito do uso de óleo na ração sobre o desempenho de poedeiras comerciais[CD-ROM]. Anais da 39ª Reunião Anual da Sociedade Brasileira de Zootecnia; 2003; Recife, RE: Sociedade Brasileira de Zootecnia; 2003.
Rodrigues EA, Cancherini LC, Junqueira OM et al. Desempenho, qualidade da casca e perfil lipídico de gemas de ovos de poedeiras comerciais alimentadas com níveis crescentesde óleo de soja no segundo ciclo de postura. Acta Scientarium Animal Science 2005; 27(2):207-212.
Rostagno HS, Barbarino PJr, Barboza WA. Exigências nutricionais de aves determinadas no Brasil. Anais do Simpósio Internacional Sobre Exigências Nutricionais de Aves e Suínos; 1996; Viçosa, MG. Brasil. 1996. p.361-388.
Scheideler SE, Froning GW. The combined influence of dietary flax seed variety, level, form, and storage conditions on egg productiion and composition among vitamin E-supplemented hens. Poultry Science 1996; 75:1221-1226.
Universidade Federal de Viçosa. Central de Processamento de Dados (UFV/CPD). Manual de utilização do programa SAEG (Sistema para Análises Estatísticas e Genéticas). Viçosa, MG; 1997. 59p.
Van Elswyk ME. Nutritional and physiological effects of flax seed in diets for laying fowl. World’s Poultry Science Journal 1997; 53: 253–264.
Whitehead CC, Bowman AS, Griffin HD. Regulation of plasma oestrogen by dietary fats in the laying hen: relationships with egg weight. British Poultry Science 1993; 34:999-1010.