Engineering ISSN: 1809-4430 (on-line)
_________________________
2 Instituto Agronômico do Paraná/ Londrina - PR, Brasil. 3 Universidade Estadual de Ponta Grossa/ Ponta Grossa - PR, Brasil. 4 Universidade Estadual de Londrina/ Londrina - PR, Brasil.
PERFORMANCE OF DIESEL ENGINE FUELLED WITH FOUR VEGETABLE OILS, PREHEATED AND AT ENGINE WORKING TEMPERATURE
Doi:http://dx.doi.org/10.1590/1809-4430-Eng.Agric.v37n2p302-314/2017
HEVANDRO C. DELALIBERA1*, ANDRÉ L. JOHANN2, PAULO R. A. DE FIGUEIREDO2,
ANDERSON DE TOLEDO2, PEDRO H. WEIRICH NETO3, RICARDO RALISCH4 1*Corresponding author. Instituto Agronômico do Paraná/ Londrina - PR, Brasil. E-mail:hevandro@iapar.br
ABSTRACT:With the rise of restrictions imposed by law for gases emission, several technologies both for petrodiesel (PD) or diesel engines are been applied, such as the sulfur reduction and the injection electronic command, followed of gases recirculation and/or after-treatment. The utilization of biofuels is considered as an interesting option for pollutants reduction. In this study was evaluated the performance on short duration tests (minor period than the factory indication of the lubricant lifespan) of the Diesel engine fueled with four vegetable oils. With the aim to select the most interesting oils for future evaluations in long duration tests. The analyzed variables were fuel consumption, power relative loss and opacity, for oils of linseed, crambe, rapseed, jatropha , with 100 °C preheating and engine work temperature (60 °C) comparing those with the PD. It was verified that the vegetable oils, on average, present a lower consumption than the PD for the cases of working without load, however with load, they presented higher consumption. In addiction were observed that the oils show a higher relative power loss in relation of PD and provides lower emission of particulate matter. Crambe and canola presented the best performance among the evaluated oils.
KEYWORDS: consumption, brake power, opacity.
INTRODUCTION
Environmental pollution from fossil fuel sources has led to the development of research into the search for alternative fuels to petroleum products. Brazil with technology and market already developed for ethanol, gasoline substitute, looks for alternatives to complete substitution of petrodiesel (PD). One of the premises is not to suggest changes in the design of available diesel engines. At the moment vegetable oils and their derivatives are in focus because they present characteristics and properties similar to PD, being able to be applied pure or mixed to the petroleum derivative.
However, the quality parameters and the utilization procedures for unprocessed vegetable oils have not yet been defined. They draw attention because they are sources of lower obtaining cost and for not being classified as fuel by the legislation, which implies in facilities of handling, transport and storage. In spite of being favorable from the energetic and environmental point of view, the direct use of vegetable oils in diesel engines is problematic. Studies with several oils have shown that the application of these as fuel causes carbonization excess of the combustion chamber; contaminates and degrades the lubricant and causes accelerated wear of moving parts (HAZAR & AYDIN, 2010; DELALIBERA et al., 2012).
from genetics (fatty acids) and purification processes, which may favor resistance to thermal oxidation (RYAN III et al., 1984).
However, studies on motor fueled with pure vegetable oils and / or mixed with PD show reduced gas emission compared to PD (CAMPOLINA et al., 2011; BASINGER et al., 2010). Also, studies evaluating the emissions of engine gases fueled with preheated palm oil (85 °C) have found that to be advantageous, design adaptations (compression ratio, injection point and fuel demand) are required to improvement motor performance (PIMENTEL et al., 2002).
Tests carried out with PD and mixtures with castor oil biodiesel show that the opacity values decreased as the biodiesel content in the mixture increased, in which they decreased until mixtures of 75% of biodiesel in the PD. After this, the opacity values increased to the point of not differing from the PD (TABILE et al., 2009). For an engine with direct combustion system and electronic injection control, the opacity exceeded the emissions of PD when 50% ratio of degummed soybean oil in the PD was used; however, the opacity was lower for mixtures of 30 and 70% (CAMPOLINA et al., 2011).
In Brazil there is legislation (RESOLUTION/CONAMA No. 433, 2011) limiting the emission of polluting gases for engines of agricultural and road machinery in which is necessary to note that there is no technical-scientific criteria that justify such restriction values; due to that the aim of this study was to evaluate the technical behavior, the performance and emission of particulate matter of diesel engine when fueled with pure vegetable oil, preheated at 100 °C, at the injection pump inlet and at the engine working temperature (60 °C) in short duration tests (DELALIBERA, 2015), comparing them with PD, in order to select the most interesting oils for future long-term tests.
MATERIAL AND METHODS
1. Test Bench: The test bench was set up on a 4 kVA (3.2 kW@1.800rpm 60Hz) diesel generator (Table 1). As the engine was not new, it was necessary to check the valve settings, injection system (opening pressure of 13.21 MPa) and cylinder compression pressure (1.64 MPa). All verified and calibrated systems are as recommended by the manufacturer for an engine in good operating condition.
TABLE 1. Engine specifications according to manufacturer's manual.
Manufacturer/Model YANMAR/B9C Aspiration Natural
Rotation range 1,050 to 2,300 rpm Injection System Mechanics
Number of cylinders 1 Combustion system Antechamber
Compression pressure 1.47 a 1.86 MPa Injection pressure 13.7 ± 0.49 MPa
Compression ratio 19.2:1 Lubrication Forced by pump
Bore x Stroke 90 x 100 mm Lubricant Pressure 0.049 a 0.49 MPa
Engine Capacity 636 cm3 Lubricant Volume 1.5 to 2 L
Cycle Diesel – 4 stroke Cooling Condensation water
Power rating 5.88 kW@1,800 rpm Cooling volume 2.8 L
A manual three-way valve was adapted near the inlet of the engine's fuel power system which allows the fuel to be changed by directing the fueled inlet between two distinct reservoirs (petrodiesel and vegetable oil). Both fuels were supplied by gravity. A heating system was developed from a cylindrical electric resistance (diameter: 40 mm, length: 120 mm) of 450 W power, powered by 220 V. This involved an aluminum mass of 16 mm internal diameter, where a thermocouple type K sensor was inserted, which sends the temperature information to a CR-5.000® data acquisition system (Campbell Scientific), which stores and controls the temperature of the heater through a relay type device.
spaced bar were adapted which have the function of interrupting the laser beam, generating the signal for the acquisition system. For data reading it was used an e-Daq Lite® (HBM) datalogger with 200 Hz acquisition rate since it is possible to use a method that consists of timing the time elapsed between one pulse and another, allowing high frequencies of acquisition and resolution of more suitable scale for this variable.
To carry out evaluations under absorption condition of known power, a load bank was made of 9 halogen lamps (6 of 500 and 3 of 300 W), absorbing covers of 3.9 kW, corresponding to 66% of the nominal power of the engine. However, as the applied load exceeds around 20% of the generator nominal (3.2 kW), the load application periods did not exceed 10 continuous minutes, under the risk of damaging it by overheating.
2. Treatments: common petrodiesel S500B5 (PD) was used purchased at an urban fuel station and four vegetable oils (VO), were evaluated at two different temperatures (Table 2). The used oils were linseed (Linum usitatissimum), crambe (Crambe abyssinica Hochst), rapseed (Brassica napus L.) and jatropha (Jatropha curcas L.). All raw materials were produced in the experimental areas of IAPAR-PR and the VO was extracted by mechanical method through micro-presses expeller type, followed by simple filtration. For these, no physicochemical analyzes were performed.
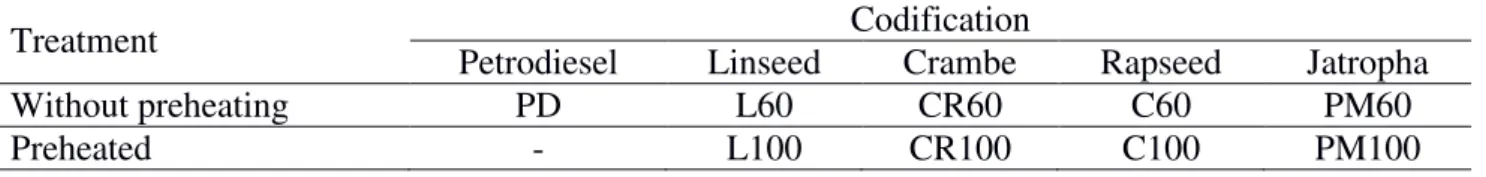
TABLE 2. Treatments applied in the engine.
Treatment Codification
Petrodiesel Linseed Crambe Rapseed Jatropha
Without preheating PD L60 CR60 C60 PM60
Preheated - L100 CR100 C100 PM100
The VO fuels were subjected to the temperature of 60 °C, which is the average temperature of the fuel inside the injection pump, after the engine has stabilized at the temperature of the cooling system (working temperature) and preheated at 100 °C. Temperatures were measured by a thermocouple inserted in the fuel access channel to the injection pump element. Temperatures higher than 100 °C in the injection pump were not applied; therefore, the engine presented operational failures when submitted to the load for linseed and jatropha oils. To obtain this temperature in the injection pump, the heating system worked with drive interval between 155 and 165 °C.
3. Test procedure: For variables stabilization, the engine was operated at a regime of 1,800 rpm load-free for a period of 40 minutes with the application of the treatment. Also, in the passage between treatments, this procedure was repeated with PD for the same period. This was standardized because it was the time required to stabilize the temperatures and pressures with the engine under free rotation (without power absorption in the generator).
4. Evaluated Variables:
4.1. Thermal behavior of the cooling and exhaustion system: Since the experiment lasted approximately 30 hours of motor operation (average 3.33 hours per test), and it was not performed in a controlled environment it was tried to identify the influence of ambient temperature in the variations of the working temperature of the cooling and exhaust gas systems. Thermocouple type K sensors were installed one in the exhaust gas tube, one meter from the cylinder head, and one for the cooling fluid in the engine block. The purpose of these was to evaluate the effect of the treatment on the thermal behavior of the engine. For the ambient temperature, it was used the internal sensor of the CR-5000 datalogger.
considered that the variations were environment dependent, and when there was no correlation, it was considered that there was treatment effect.
For the correlations, the Pearson coefficient was used for the data that presented normal distribution, and Sperman, for those that did not fit into normality. The tests of normality applied were D'Agostino, D'Agostino-Pearson, Lilliefors and Shapiro-Wilk. To consider normality, a non-significant result was required for at least three tests.
For the variables that did not present correlation was applied normality tests again. However, at this stage of analysis the treatment effect was considered in the data distribution, that is, the normality of the residues was verified obtaining for them the normality and homoscedasticity (Hartley and Cochran). In sequence, parametric variance analysis tests were applied followed by Scheffé's non-orthogonal contrasts test, in order to compare VO against PD.
4.2. Fuel consumption: This was evaluated under a regime of 1,150 (slow) and 1,800 rpm load-free, and under an absorption regime of 66% (3.9 kW@1,800 rmp) of rated power. The consumption was measured through the mass with a precision scale (0.01g), for a period of 5 minutes, with 5 repetitions for each treatment with this one obtains the specific consumption or per hour directly. This method was used because, as there are large variations in temperature in the reservoir injection system path, measurements by volume generate uncertainties and imprecision, and are considered not suitable for motor testing.
As these presented normality and homoscedasticity, parametric variance analysis (ANOVA) was performed blocking the effect of motor dependence, followed by multiple comparison tests by non-orthogonal contrasts of Scheffé.
4.3. Power loss: In order to estimate this variable, a method was developed that consists of an indirect measure, calculated through the area between the curve of rotation recovery when applied to the load (3.9 kW@1,800 rmp) and the free load rotation before its input, obtaining an index of loss of power and relative to the condition in which the motor is submitted. The lower the value of the obtained area, the lower the loss of power.
The 2 s interval immediately after the load input (total of 10 s) was used for the calculation, because it was the maximum response time to the acceleration return and stabilization of the rotation for this load condition, resulting in 400 readings for each repetition, obtained by the aforementioned presence sensor. Twenty repetitions of 10 s were performed for each treatment.
The Catman Easy-AP 3.3.5® program (HBM) was used to manipulate and integrate the data. The relative power loss indexes were submitted to normality and homoscedasticity tests and were presented in conditions for ANOVA application, followed by a comparison test by Scheffé's non-orthogonal contrasts.
4.4. Exhaust gas opacity: Emission of particulate matter (PM) was estimated using the indirect opacity method (NBR 13.037), using a TM-133® partial flow opacimeter and a TM-529® tachometer with interface by IGOR 2.1® (TECNOMOTOR) software. For this test, the exhaust gas outlet was modified by removing the muffler and directing it down so that the opacity measurements are the closest to the emissions in the exhaust window of the engine.
The opacity results (k = m-1) were converted to mass estimates of PM per hour (kMP = g h-1)
and specific emission (g kWh-1) by equations suggested by BRANCO et al. (2012) in which [eq. (1)
estimates the concentration of soot or elemental carbon (EC) which constitutes the majority of the PM of the smoke (65 to 75%), and finally [eq. (2)]" estimates the emission of PM for the engine in a specific working condition. It was used 1,800 rpm, therefore, is the rotation of work required for this model of diesel generator.
(2)
Twenty repetitions were performed for each treatment and analysis of variance was applied, followed by Friedman's nonparametric multiple comparison test, since the data did not present normal distribution and the dependence of the motor between the treatments was considered, as already observed by CAMPOLINA et al. (2011). The analyzes were performed on Microsoft Excel 2010, SisVar 5.3 (FERREIRA, 2011) and BioEstat 5.3 (AYRES et al., 2012) programs.
RESULTS AND DISCUSSION
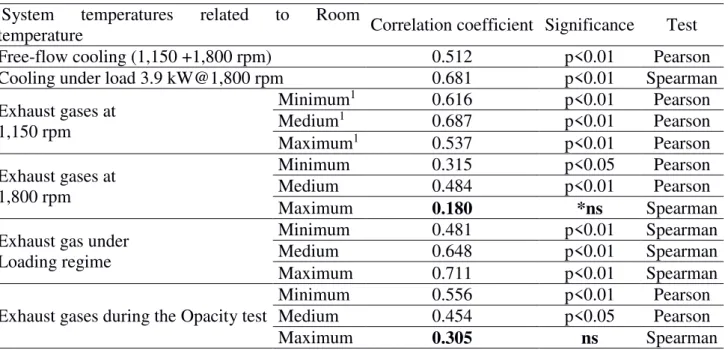
5.1. Thermal behavior of the cooling and exhaust system: There was no significant correlation between ambient temperature and maximum exhaust gas temperature at 1,800 rpm load-free and with the maximum exhaust gas temperature during the opacity tests (Table 3) been therefore considered independent (treatment effect exists). In the others, as there was a significant correlation, it was considered that the variations in these ones were dependent or caused by the environment and no sequential analysis was discussed.
TABLE 3. Correlation between the temperatures according to the operating regime.
System temperatures related to Room
temperature Correlation coefficient Significance Test
Free-flow cooling (1,150 +1,800 rpm) 0.512 p<0.01 Pearson
Cooling under load 3.9 kW@1,800 rpm 0.681 p<0.01 Spearman
Exhaust gases at 1,150 rpm
Minimum1 0.616 p<0.01 Pearson
Medium1 0.687 p<0.01 Pearson
Maximum1 0.537 p<0.01 Pearson
Exhaust gases at 1,800 rpm
Minimum 0.315 p<0.05 Pearson
Medium 0.484 p<0.01 Pearson
Maximum 0.180 *ns Spearman
Exhaust gas under Loading regime
Minimum 0.481 p<0.01 Spearman
Medium 0.648 p<0.01 Spearman
Maximum 0.711 p<0.01 Spearman
Exhaust gases during the Opacity test
Minimum 0.556 p<0.01 Pearson
Medium 0.454 p<0.05 Pearson
Maximum 0.305 ns Spearman
*ns – Not significant; 1 – Average of the minimum, medium and maximum temperatures obtained by the acquisition system.
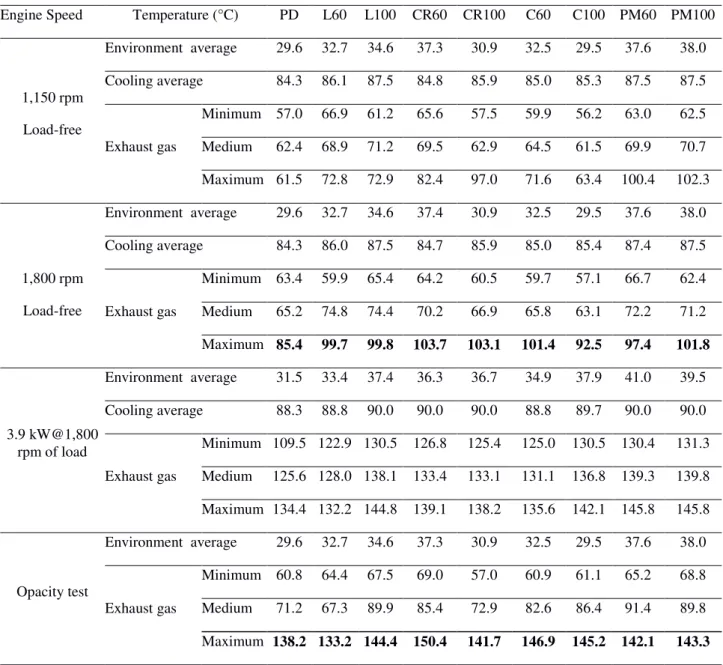
TABLE 4. Average temperatures according to the engine work speed for treatments.
Engine Speed Temperature (°C) PD L60 L100 CR60 CR100 C60 C100 PM60 PM100
1,150 rpm
Load-free
Environment average 29.6 32.7 34.6 37.3 30.9 32.5 29.5 37.6 38.0
Cooling average 84.3 86.1 87.5 84.8 85.9 85.0 85.3 87.5 87.5
Exhaust gas
Minimum 57.0 66.9 61.2 65.6 57.5 59.9 56.2 63.0 62.5
Medium 62.4 68.9 71.2 69.5 62.9 64.5 61.5 69.9 70.7
Maximum 61.5 72.8 72.9 82.4 97.0 71.6 63.4 100.4 102.3
1,800 rpm
Load-free
Environment average 29.6 32.7 34.6 37.4 30.9 32.5 29.5 37.6 38.0
Cooling average 84.3 86.0 87.5 84.7 85.9 85.0 85.4 87.4 87.5
Exhaust gas
Minimum 63.4 59.9 65.4 64.2 60.5 59.7 57.1 66.7 62.4
Medium 65.2 74.8 74.4 70.2 66.9 65.8 63.1 72.2 71.2
Maximum 85.4 99.7 99.8 103.7 103.1 101.4 92.5 97.4 101.8
3.9 kW@1,800 rpm of load
Environment average 31.5 33.4 37.4 36.3 36.7 34.9 37.9 41.0 39.5
Cooling average 88.3 88.8 90.0 90.0 90.0 88.8 89.7 90.0 90.0
Exhaust gas
Minimum 109.5 122.9 130.5 126.8 125.4 125.0 130.5 130.4 131.3
Medium 125.6 128.0 138.1 133.4 133.1 131.1 136.8 139.3 139.8
Maximum 134.4 132.2 144.8 139.1 138.2 135.6 142.1 145.8 145.8
Opacity test
Environment average 29.6 32.7 34.6 37.3 30.9 32.5 29.5 37.6 38.0
Exhaust gas
Minimum 60.8 64.4 67.5 69.0 57.0 60.9 61.1 65.2 68.8
Medium 71.2 67.3 89.9 85.4 72.9 82.6 86.4 91.4 89.8
Maximum 138.2 133.2 144.4 150.4 141.7 146.9 145.2 142.1 143.3
TABLE 5. Comparison of average group for fuel consumption, according to the working speed and significance of the contrasts analysis of variance.
Work Speed Nº Without preheating Preheated p valor
PD L60 CR60 C60 PM60 L100 CR100 C100 PM100
1,150 rpm Load-free
1. 8 -1 -1 -1 -1 -1 -1 -1 -1 <0.01
2. 0 3 -1 -1 -1 3 -1 -1 -1 <0.01
3. 2 -1 0 0 0 -1 0 0 0 0.293
4. 0 1 1 1 1 -1 -1 -1 -1 <0.01
1,800 rpm Load-free
5. 8 -1 -1 -1 -1 -1 -1 -1 -1 <0.05
6. 0 3 -1 -1 -1 3 -1 -1 -1 <0.01
7. 2 -1 0 0 0 -1 0 0 0 <0.01
8. 0 1 1 1 1 -1 -1 -1 -1 <0.01
3.9 kW@1,800
rpm of Load
9. 8 -1 -1 -1 -1 -1 -1 -1 -1 <0.01
10. 4 0 -1 -1 0 0 -1 -1 0 <0.01
11. 0 1 -1 -1 1 1 -1 -1 1 <0.01
12. 0 1 1 1 1 -1 -1 -1 -1 <0.01
Scheffé's comparison test for non-orthogonal contrasts
FIGURE 1. Box-Plot of averages and standard deviations for fuel consumption according to the regime.
There was a heating effect on VO consumption (contrasts 4, 8 and 12 of Table 5), because when preheated the fuel consumption was lower than those not heated for the free rotation regimes and, when under load, the preheating increased consumption (Figure 1b and 1c). According to RYAN III et al. (1984) and RYAN III & STAPPER (1987), preheating increases the number of VO cetane, which can result in lower consumption under free rotation, but the heating decreases the energy density of the VO favoring an increase in consumption for under load condition due to the increase in injection volume to compensate the power factor. HAZAR & AYDIN (2010) found for VO-powered motor, similar result for free-rotation test in which preheating (100 °C) reduced consumption by 9.64% over unheated. The authors commented that this is due to the reduction on viscosity due to heating (± 8 mm2 s-1 at 100 °C for canola oil), favoring the atomization and
combustion process. However, both VO treatments presented higher intakes than PD.
As mentioned previously by RYAN III & STAPPER (1987), the heating of the VO, besides reducing the viscosity, favoring the processes of injection and atomization, also increases cetane number (CN), improving the fuel quality. However, heating changes the volume and density, resulting in lower energy content per volume and, as systems with mechanical injection control, volumetrically apply the fuel in the combustion chamber, heating may have resulted in negative engine performance. Similar effect was reported by HAZAR & AYDIN (2010), in which the preheating reduced the density on the canola oil by 5.18% in relation to the ambient temperature, reflecting in the increase of consumption, because the reduction of the density also reduces the energy contained in the same volume.
The fuel consumption under free rotation of the preheated VO presented lower variation when compared to the VO without preheating (Figure 1a and 1b and Table 6), indicating that the engine operation for them was more stable. This behavior can be explained by the influence of the variations of the environment on the fuel temperature, within the injection system, favored by the low consumption flow provided by this condition. It is also possible to observe (Table 6) that the relationships between the consumption under load regime divided by 1,800 rpm load-free, tend to be higher for VO than for PD.
TABLE 6. Average fuel consumption, coefficients of variation and consumption relations.
1,150 rpm free-load 1,800 rpm free-load 3.9 kW@1,800 rpm of load 1.800 rpm Free-load
Average (g h-1) CV% Average(gh-1) CV% Average (g h-1) CV% VO/PD*
PD 319.85 2.58 551.28 1.03 1,472.45 1.07 - 2.70
L60 328.92 2.90 581.16 1.11 1,600.78 1.05 1.09 2.75
CR60 299.28 1.76 531.84 1.88 1,544.40 0.99 1.05 2.90
C60 292.25 2.57 534.84 0.61 1,566.99 0.70 1.06 2.93
PM60 301.06 0.68 543.43 1.13 1,596.75 0.59 1.08 2.94
L100 317.11 1.01 570.19 0.56 1,621.92 0.63 1.10 2.84
CR100 291.94 1.13 524.28 1.23 1,529.06 0.64 1.04 2.92
C100 288.29 0.78 533.62 0.48 1,569.02 0.98 1.07 2.94
PM100 291.94 1.11 536.88 0.64 1,625.73 0.86 1.10 3.03
*Vegetable oil on petrodiesel
FIGURE 2. Box-plot of averages and standard deviations from rotation (a, b) and power loss index (c).
Figure 3 shows that the initial rotation drop for the PD is higher than for the VO, but at the end of the recovery, the rotation stabilizes near the regime under free rotation. This is probably due to the higher energy density of the PD, requiring less fuel under the condition of free rotation, resulting in a larger initial drop, due to the pump advance response time, but returning near the initial condition. Analyzes show that VOs generally present greater power loss compared to PD (Figure 2c) as shown by contrast 13 (Table 7) and the averages presented in Table 8.
FIGURE 3. Average rotation curves to free regime and load input in the 2 s time.
TABLE 7. Contrasts for comparing the relative power loss index.
Relative power loss
index
Nº Without preheating Preheated Σ p value
PD L60 CR60 C60 PM60 L100 CR100 C100 PM100
13. 8 -1 -1 -1 -1 -1 -1 -1 -1 0 <0.01
14. 0 1 1 1 1 -1 -1 -1 -1 0 <0.01
15. 4 -1 -1 -1 -1 0 0 0 0 0 <0.01
Scheffé's comparison test for non-orthogonal contrasts
Contrast 15 (Table 7) shows that treatments without preheating present greater power loss compared to PD. It is also possible to observe that only the CR60 treatment showed no difference in PD (Figure 3 and Table 8), a fact that may be related to its high calorific value and cetane number (40,482 and 44.6 kj kg-1 respectively, KNOTHE et al., 2006) in relation to the other VO .
TABLE 8. Average power loss, coefficient of variation and relationship vegetable oil petrodiesel.
Without preheating (60 °C) Preheated at 100 °C
PD L60 CR60 C60 PM60 L100 CR100 C100 PM100
Average 106.17 115.66 105.53 114.55 122.72 136.38 117.29 127.19 137.74
CV% 3.04 2.09 2.65 3.64 5.03 5.34 3.83 6.25 3.51
VO/PD - 1.09 0.99 1.08 1.16 1.28 1.10 1.20 1.30
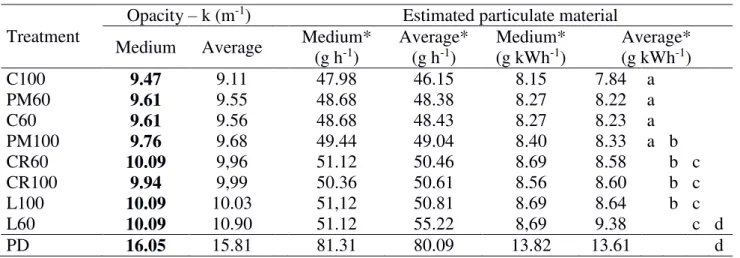
5.4. Opacity of the exhaust gases: Opacity evaluations show that, except for L60, the VO emitted less particulate matter (PM) than the PD (Table 9). It was still found a difference between the C100, PM60 and C60 that presented lower opacity than CR60, CR100, L60 and L100. According to KITTELSON & KRAFT (2014) and STOREY et al. (2015), these are intrinsically related to the physical-chemical properties of each oil, as is the case of PD, that PM emission is related to the amount of sulfur and, for the engine, the characteristics of the of injection system type, combustion system, the thermal efficiency of the assembly and the condition of engine wear which may favor the passage of lubricant into the combustion chamber. No effect of heating was observed on opacity.
TABLE 9. Opacity data, multiple comparison test and estimated particulate material emissions to the work speed of 1,800 rpm.
Treatment
Opacity – k (m-1) Estimated particulate material
Medium Average Medium*
(g h-1) Average* (g h-1) Medium* (g kWh-1) Average* (g kWh-1)
C100 9.47 9.11 47.98 46.15 8.15 7.84 a
PM60 9.61 9.55 48.68 48.38 8.27 8.22 a
C60 9.61 9.56 48.68 48.43 8.27 8.23 a
PM100 9.76 9.68 49.44 49.04 8.40 8.33 a b
CR60 10.09 9,96 51.12 50.46 8.69 8.58 b c
CR100 9.94 9,99 50.36 50.61 8.56 8.60 b c
L100 10.09 10.03 51,12 50.81 8.69 8.64 b c
L60 10.09 10.90 51.12 55.22 8,69 9.38 c d
PD 16.05 15.81 81.31 80.09 13.82 13.61 d
Averages followed by the same letter in the column did not differ among the Friedman test (p <0.05) * Estimated values using the BRANCO et al. (2012) transformations for speed of 1,800 rpm
forming carbonization, emitting more smoke, lower thermal efficiency, resulting in higher consumption and lower power.
HAZAR & AYDIN (2010) evaluating a diesel engine fueled with a 50% mixture of canola oil in the PD, preheated (100 °C), observed reduction of 26.3% in PM emission compared to PD. AGARWAL et al. (2010) also, in a motor with a direct combustion system found an effect of the pre-heating of the VO on PM emission being for the pre-heated emitted less than the unheated ones, and both were smaller than the PD.
Considering that this type of engine is still produced, and the emission limits of PM stipulated by the legislation (CONAMA nº 433/2011) for the lower powers (19 to 37 kW, 0.6 g kWh-1) which
exceed from 3.2 to 6.3 times the studied engine power, PM emission was 23 and 14 times higher for the PD and VO respectively. Since emissions laws are increasingly strict, emissions may limit the use of engines with a simpler constructive arrangement leading to an increase in the cost of acquisition, especially in the case of agriculture which is a production system considered pollutant mitigator.
It was also observed that the measurements of the opacimeter did not represent the reality of the emissions due to their measurement principle (they are extremely influenced by the characteristics of the sampling probe in conjunction with variables such as the exhaust pipe diameter and internal obstacles, altitude and temperature, relative humidity and atmospheric air quality) and the necessary methodology and, therefore, it is concluded that this is not suitable for using in scientific research.
CONCLUSIONS
The treatments with vegetal oil did not influence in a significant way the work temperature of the motor in comparison with petrodiesel.
There was an effect of the engine working speed on fuel consumption, in which, when under free rotation the vegetable oils presented lower average consumption than for petrodiesel, and when under load was observed the reverse. The preheating also had an effect on the consumption among vegetable oils, in which the consumption was lower under a free-rotation regime and, when under load, the consumption was higher for preheated oils than those without pre-heating.
Vegetable oils have a greater loss of potency than petrodiesel, and preheated oils have a greater loss of potency than non-preheated oils.
Vegetable oils have a lower overall opacity than petrodiesel, and there was no effect of the preheating of the fuel oil on the emission of particulate matter.
The crambe oil, following the canola oil presented the best results.
The preheating of the fuel was less interesting than the non-preheated ones in relation to the technical behavior of the engine. However, the literature shows that in long-term tests (DELALIBERA, 2015), preheating presents positive results regarding to the engine life.
REFERENCES
ACHARYA, S.K.; SWAIN, R.K.; MOHANTY, M.K. The use of rice bran oil as a fuel for a small horse-power Diesel engine. Energy Sources, Part A: Recovery, Utilization, and Environmental Effects, Philadelphia, v.33, p.80-88, 2011.
AGARWAL, A.K.; GUPTA, T.; KOTHARI, A. Toxic potential evaluation of particulate matter emitted from a constant speed compression ignition engine: a comparison between straight vegetable oil and mineral diesel. Aerosol Science and Technology, New York, v.44, p.724-733, 2010.
BAYINDIR, H. The effects of cottonseed oil-kerosene blends on a diesel engine performance and exhaust emission. Energy Sources, Part A: Recovery, Utilization, and Environmental Effects,
Philadelphia, v.32, p.901-908, 2010.
BASINGER, M.; REDING, T.; WILLIAMS, C.; LACKNER, K.S.; MODI, V. Compression
ignition engine modifications for straight plant oil fueling in remote contexts: Modification design
and short-run testing. Fuel, Nottingham, v.89, p.2925-2938, 2010.
BRANCO, G.M.; CROCE, W.; BRANCO, F.C.; SZWARC, A.; NAPOLEONA, J.M. Critérios de
avaliação da eficácia do programa de inspeção veicular. 2012. Disponível em:
<http://www.prefeitura.sp.gov.br/cidade/secretarias/upload/chamadas/simea_53_criterios_de_avalia cao_da_eficacia_do_programa_de_inspecao_veicular-v2_1349732008.pdf>. Acesso em: 13 Agosto de 2012.
CAMPOLINA, N.; DELALIBERA, H.C.; WEIRICH NETO, P.H. Material particulado emitido por motor ciclo Diesel alimentado com misturas de diesel com óleo de soja. In: CONGRESSO
INTERNACIONAL DE BIOENERGIA, 6., 2011, Curitiba. Anais...
DELALIBERA, H.C.; WEIRICH NETO, P.H.; MARTINI, J. Using pre-heated sunflower oil as fuel in a Diesel cycle engine. In: HOSTED BY THE CANADIAN SOCIETY FOR
BIOENGINEERING, 17., 2010, Québec. Proceedings…
DELALIBERA, H.C.; CAMPOLINA, N.; WEIRICH NETO, P.H.; RALISCH, R. Performance of a diesel engine fueled with a preheated blend of soybean oil and petrodiesel. Engenharia Agrícola,
Jaboticabal, v.32, p.1058-1067, 2012.
DELALIBERA, H.C. Aplicação de óleos vegetais como fonte renovável de energia em motores Diesel. In: MELO, G. e RIBEIRO, M.F.S. Processamento de oleaginosas como alternativa de agregação de valor na agricultura familiar. Ponta Grossa: Lagoa Dourada, 2015. v.1 p.20-37. FERREIRA, D.F. Sisvar: a computer statistical analysis system. Ciência e Agrotecnologia, Lavras, v.35, p.1039-1042, 2011.
HAZAR, H.; AYDIN, H. Performance and emission evaluation of a CI engine fueled with preheated raw rapeseed oil (RRO) diesel blends. Applied Energy, Barking, v. 87, p. 786-790, 2010.
KNOTHE, G.; GERPEN, J.V.; KRAHL, J. Manual de biodiesel. Tradução de L.P. RAMOS. São Paulo: Edgard Blücher, 2006. 340p.
KITTELSON, D.; KRAFT, M. Particle formation and models in internal combustion engines. Cambridge: Cambridge Centre for Computacional Chemical Engineering, 2014. p.39, 2014. MARTINI, J.; DELALIBERA, H.C.; WEIRICH NETO, P.H. Consumo de óleo de soja pré-aquecido por motor Diesel. Revista Brasileira de Agrociencia, Pelotas, v. 18, p. 213-220, 2012. PETERSON, C.L.; WAGNER, G.L.; AULD, D.L. Vegetable oil substitutes for diesel fuel.
Transactions of the ASAE. St Joseph, v. 26, n. 2, p. 322-327, 1983.
PIMENTEL, V.S.B.; BELCHIOR, C.R.P. Análise e Diagnose de Diesel Geradores Operando com Óleo de Dendê in Natura. In: Energia no Meio Rural, 4., 2002, Campinas. Anais… Campinas: Agrener 2002.
POPA, V.M.; GRUIA, A. RABA, D.N.; DUMBRAVA, D.; MOLDOVAN, C.; BORDEAN, D.; MATESSCU,C. Fatty acids composition and oil characteristics of linseed (Linum Usitatissimum L.) from România. Journal of Agroalimentary Processes and Technologies, Timisoara, v.18, n.2, p.136-140, 2012.
RYAN III, T.W.; STAPPER, B. Diesel fuel ignition quality as determination in constant volume combustion bomb. Warrendale: SAE Technical.1987. (Paper Ser 970596)
SHEHATA, M.S.; RAZEK, S.M.A. Experimental investigation of diesel engine performance and emission characteristics using jojoba/diesel blend and sunflower oil. Fuel, Nottingham, v.90, p. 886-897, 2011.
STOREY, J.; CURRAN, S.; DEMPSEY, A.; LEWIS, S.; WALKER, N.R.; REITZ, R.; WRIGHT, C. The contribution of lubricant to the formation of particulate matter with reactivity controlled compression ignition in light-duty Diesel engines. Emission Control Science and Technology, Berlin,v.1, p. 64-79, 2015. Disponível em: <http://download.springer.com>. doi: 10.1007/s40825-014-0007-2
TABILE, R.A.; LOPES, A.; DABDOUBE, M.J.; CAMARA, F.T.; FURLANI, C.E.A.; SILVA R. P. Biodiesel de mamona no diesel interior e metropolitano em trator agrícola. Engenharia