www.ccarevista.ufc.br ISSN 1806-6690
Spatial distribution of the chemical properties of the soil and of
soybean yield in the field
1Espacialização dos atributos químicos do solo e do rendimento em campo de
sementes de soja
Alexandre Gazolla-Neto2*, Marciabela Correa Fernandes2, Rafael de Oliveira Vergara2, Gizele Ingrid Gadotti3 and Francisco Amaral Villela2
ABSTRACT - The aim of this study was to evaluate the spatial dependence between chemical properties of the soil and yield components in the soybean using precision farming techniques. Samples of the soil and plants were taken from georeferenced points to determine the chemical properties of the soil and the yield components. The results were submitted to Pearson correlation analysis, descriptive statistics and geostatistics. The coefficient of variation showed a wide range of distribution for the chemical attributes of the soil, with the highest indices being found for the levels of available phosphorus (102%) and potassium (72.65%). Soil pH and organic matter showed a coefficient of variation of 5.96 and 15.93% respectively. Semivariogram analysis of the yield components (productivity, 1,000-seed weight and number of seeds) and the chemical properties of the soil (organic matter, pH, phosphorus, potassium, calcium, magnesium, boron, manganese and zinc) fitted the spherical model with moderate spatial dependence, with values ranging from 200 to 700 m. Spatial distribution by means of map interpolation was efficient in evaluating spatial variability, allowing the identification and quantification of regions of low and high productivity in the production area, together with the distribution of soil attributes and their respective levels of availability to the soybean plants.
Key words: Precision farming. Soil fertility. Spatial distribution. Seed yield.
RESUMO - O objetivo deste trabalho foi avaliar a dependência espacial entre os atributos químicos do solo e os componentes do rendimento de soja, por meio de técnicas de agricultura de precisão. Realizaram-se amostragens de solo e de plantas, em pontos georreferenciados, para determinação dos atributos químicos do solo e componentes do rendimento. Os resultados foram submetidos às analises de correlação linear de Pearson, estatística descritiva e geoestatistica. O coeficiente de variação apresentou ampla faixa de distribuição nos atributos químicos do solo, sendo os maiores índices obtidos para os teores disponíveis de fósforo (102%) e potássio (72,65%). O pH do solo e a matéria orgânica apresentaram coeficientes de variação de 5,96 e 15,93%, respectivamente. A análise dos semivariogramas, para os componentes do rendimento (produtividade, massa de mil sementes e número de sementes) e atributos químicos do solo (matéria orgânica, pH em água, fósforo, potássio, cálcio, magnésio, boro, manganês e zinco), ajustaram-se ao modelo esférico, com dependência espacial moderada, e valores para o alcance da dependência espacial distribuídos entre 200 a 700 m. A espacialização por meio de mapas de interpolação foi eficiente na avaliação da variabilidade espacial, permitindo a identificação e a quantificação na área de produção de regiões com baixa e alta produtividade, associado à distribuição dos atributos do solo e respectivos níveis de disponibilidade para a planta de soja.
Palavras-chave: Agricultura de precisão. Fertilidade do solo. Distribuição espacial. Rendimento de sementes.
DOI: 10.5935/1806-6690.20160038 * Autor para correspondência
1Recebido para publicação em 22/07/2014; aprovado em 26/10/2015
Parte da Tese de Doutorado em Ciência e Tecnologia de Sementes do primeiro autor., projeto de Pesquisa foi financiado pelo CNPq
2Programa de Pós-Graduação em Ciência e Tecnologia de Sementes, Departamento de Fitotecnia/UFPel/FAEM, Pelotas-RS, Brasil, agazolla@gmail.
com, marciabelafc@yahoo.com.br, agrorafaelvergara@gmail.com, francisco.villela@ufpel.edu.br
INTRODUCTION
The production of seeds of high physiological quality is influenced among other factors, by the chemical properties of the soil. To this end, it is necessary to understand and quantify variations in these properties, both horizontally and vertically, since soils, which are dynamic and open systems, are always changing, and thereby forming heterogeneous bodies. In precision farming, the soil is not treated as homogeneous, and its spatial variability is only considered with a view to the exploitation and monitoring of productive features. This makes precision farming a management strategy that seeks to rationalise the use of such inputs as pesticides and fertilisers, while preserving natural resources (AMADO et al., 2009; SOUZAet al., 2010; WERNERet al., 2007).
Variations in productivity may be inherent to the soil or the climate, or even induced by the method of crop administration interacting with the plant genotype. Changes in the physical, chemical and biological properties of the soil, caused by management practices, include: soil compaction by the traffic of agricultural machinery; variations in plant stand in the field; and the level of nutrients in the soil, due to non-uniform distribution of seeds, fertilisers and/or correctives (ANTUNIASSI, 2012; WERNERet al., 2007). The use of a georeferenced information system in the context of precision farming is a powerful tool in the evaluation of the quantitative and qualitative factors responsible for the spatial variability of productivity in seed production in the field (AMADO; SANTI, 2010). In this context, a method of random sampling, which uses an average to characterise a given yield factor, is not enough to quantify how spatial variability can improve the efficiency of a system of crop production (RIFFELet al., 2012; SOUZAet al., 2006).
Studies have shown that the spatial variability of soil attributes is not entirely random, displaying a spatial correlation or dependence (MATTIONI; SCHUCH; VILLELA, 2011; MONDO et al., 2012). In this respect, an agricultural system which uses precision farming requires three subsystems: sensing (data collection), management (decision making) and control (data organisation). The study of spatial variability, for the purpose of using data collection in any one area, therefore becomes an essential part of precision farming (LUZ; LUZ; GADOTTI, 2013; MESTASet al., 2010).
For Zanão Junior, Lana and Guimarães (2007), soil management results in changes in the natural variability of the soil, especially in the surface layers. Knowledge of the spatial distribution of chemical attributes helps proper land usage, implementation of crop treatments and the identification of areas requiring different management practices (FERRAZet al., 2012). In this respect, the aim of this study was to evaluate spatial dependence between the
chemical properties of the soil and the yield components of soybean seeds through techniques of precision farming.
MATERIAL AND METHODS
The work was carried out in the field, using the TEC 5936 IPRO cultivar of soybean, in the town of São Gabriel, in the State of Rio Grande do Sul, Brazil (30o19’55’’ S, 4o11’06’’ W, at a height of 120 m), in
an area of 39 hectares, destined for the production of soybean seeds, during the 2012/2013 season. Analyses of the chemical properties of the soil, and of the yield components were carried out respectively in the Soil Analysis Laboratory and the Seed Analysis Laboratory, both at the Federal University of Pelotas.
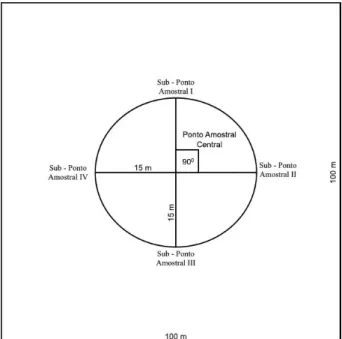
Using a contour map of the area, monitoring points were allocated spaced 100 x 100 m apart, and featuring one central sampling point per hectare, with four sub-points 15 m from the centre point, each radial separated by an angle of 90° (Figure 1).
The central sampling points were defined based on the method of systematic sampling, following a regular sampling grid, where the points are marked out along a predefined pathway, and based on the contours of the field (MATTIONI; SCHUCH; VILLELA, 2011).
Direct seeding into straw was carried out on 5 November 2012, using a seeding machine equipped
with a blade-type plough and a perforated-disc system for seed distribution (Semeato® Sun T 15). The machine was set up to deliver 15 seeds per metre, at a spacing between rows of 0.45 m. Basic fertilization consisted of 160 kg ha-1 of 02-20-20 commercial formulation,
distributed along the seed row.
Evaluation of soil attributes (organic matter, pH, phosphorus, potassium, calcium, magnesium, boron, manganese and zinc) was carried out according to the Brazilian Society for Soil Science [Sociedade Brasileira de Ciência do Solo] (2004). Thirty days before sowing the soybeans, soil samples were collected with a cutting shovel, across the fertilisation rows (SOCIEDADE BRASILEIRA DE CIÊNCIA DO SOLO, 2004). Sub-samples of soil were collected at a depth of 0 to 0.10 m at five points, with the five sub-samples making up the sample average for each sampling point. To mark out the sites for collection of the soil samples and other variables under study, a central monitoring point was considered, where one subsample was collected, with the other four being collected 15 m from this central point, at an angle of 90o between radials (Figure 1).
Harvesting took place on 28 March 2013. The pods were removed from the plants and later underwent manual threshing to yield seed samples from all points on the sampling grid. The samples were subjected to artificial drying in a forced air circulation oven at a temperature of 30 °C, until reaching a water content of 12% (BRASIL, 2009).
The following evaluations were carried out so as to determine the yield components: Productivity (PROD): estimated by the average of 5 m2 of working area per hectare,
where the samples were weighed on a digital balance with a precision of 0.01 g, and the values transformed into kg ha-1
and corrected for a moisture content of 12%.
Thousand seed weight (TSW): obtained from the manual count of eight sub-samples of 100 seeds. The seeds from each average sample point were then weighed, and the coefficient of variation between them calculated. Where the coefficient of variation was greater than 4%, the operation was repeated. For values within the tolerated range, the result was obtained by multiplying the average weight of the eight subsamples of 100 seeds by 10, thereby obtaining the 1000 seed weight (BRASIL, 2009).
Number of seeds (NS): determined from the average from 5 m2 of working area per hectare, where
the plants were threshed by hand, and the pods separated according to the number of seeds; the number of seeds per m2 was then determined.
The results were analysed employing descriptive statistics, linear Pearson correlation and geostatistics. Kriging was used as the geostatistical interpolation method in the preparation of the digital models, with a maximum search
radius of 100 m. The digital models (maps) were elaborated using theSistema Agropecuário CR - Campeiro 7 software (GIOTTO; ROBAINA, 2007). The semivariogram was estimated from the following expression:
where N (h) is the number of experimental data pairs separated by distance h;Z (xi) is the value determined for each sampled point;Z (xi + h) is the value measured for a point at a distance ofh.
The nugget effect coefficient (E%) was calculated from the equation (C0/C0+C) x 100, where: C0 is the nugget effect and C0+C the sill, with the results expressed as a percentage. The spatial dependence ratio (SDR) was determined based on the results of the nugget effect coefficient. In this regard, semivariograms presenting an SDR of less than or equal to 25% show strong spatial dependence. The dependence will be moderate if this ratio varies from 25% to 75%, and weak if this value is greater than 75%, according to a classification proposed by Cambardellaet al. (1994).
RESULTS AND DISCUSSION
The descriptive measurements determined for the chemical properties of the soil (organic matter, pH, phosphorus, potassium, calcium, magnesium, boron, manganese and zinc) and for the yield components (productivity, 1000-seed weight and number of seeds) are shown in Table 1. Among the chemical properties of the soil, the coefficient of variation (CV) showed a range of values for the variables under study of from 5.96 to 102% for soil pH and available phosphorus, and from 15.93 and 72.65% for organic matter and potassium respectively.
The variability of an attribute may be classified according to the magnitude of the coefficient of variation (FREDDI et al., 2006). The high values found for the coefficient of variation for phosphorus and potassium (Table 1) show a marked variation in the concentration of these elements in the area being sampled. However, pH and organic matter displayed a low coefficient of variation.
Variable Classification* Values Average Coefficient
Min Max Variation (%) Assimetry Kurtosis
Soil Attributes
Organic Matter (%) Low 1.50 2.80 2.24 15.93 -0.09 -0.47
Soil pH Very low 4.00 5.20 4.67 5.96 -0.30 0.12
P (mg dm-3) Low 1.80 27.70 5.86 102.00 2.74 7.87
K (mg dm-3) High 23.00 264.00 99.38 72.65 1.10 0.12
Ca (cmolc dm-3) Medium 0.50 4.40 2.60 35.60 0.16 -1.02
Mg (cmolc dm-3) High 0.50 2.10 1.40 28.35 0.16 -0.01
B (mg dm-3) Medium 0.10 0.60 0.27 39.86 1.05 1.08
Mn (mg dm-3) Low 0.50 2.10 1.40 28.35 0.54 -0.08
Zn (mg dm-3) High 0.20 1.50 0.69 55.44 0.68 1.08
Yield Components
PROD (kg ha-1) - 2.006 3.456 2.964 9.86 -0.89 1.41
TSW (g) - 181.76 209.52 198.58 3.29 -0.14 -0.45
NS (nº m-2) - 1.341 3.058 2.400 12.82 -0.55 2.99
the area (AMADO; SANTI, 2010). The results confirm those of Schlindwein and Anghinoni (2000), who found high coefficients of variation for phosphorus and potassium, and low coefficients for pH and soil organic matter.
In characterising the chemical properties of the soil (SOCIEDADE BRASILEIRA DE CIÊNCIA DO SOLO, 2004), the lowest range was identified for soil pH, classified as very low, with a minimum value of 4.00, maximum of 5.10, average of 4.67 and coefficient of variation of 5.96% (Table 1). The recommended values for this variable in the soybean crop are in the range of 5.50 to 6.00, and that when under these conditions the following should occur: a) the neutralisation of toxic aluminium; b) the elimination of manganese toxicity; c) a better use of soil nutrients; d) suitable conditions for such natural processes as the release of nutrients present in organic matter, and the fixation of atmospheric nitrogen (SOCIEDADE BRASILEIRA DE CIÊNCIA DO SOLO, 2004).
Average yield in the production area was 2,964.6 kg ha-1, varying from 2,006 to 3,456 kg ha-1
with a magnitude of 1,450 kg ha-1, however with a low
coefficient of variation (9.86%) (Table 1). Evaluating the spatial variability for yield in areas of soybean production, Mattioni, Schuch and Villela (2011) and Mondoet al. (2012) obtained coefficients of variation of 9.6% and 6.5% respectively. On the other hand, when analysing variability in soybean yield by soil attribute,
Johann et al. (2004) diagnosed an average variability expressed by a coefficient of variation of 14% and 23% respectively. According to Conab (2014), for the crop of 2013/2014, Brazilian production of soybeans reached 86.2 million tonnes, for a cultivated area of 30.2 million hectares and an average yield of 2,854 kg ha-1, lower than
the average obtained in the present production area.
Spatial variability for the variables analysed in Table 1 can be seen in the spatial maps for these variables (Figure 2).
A coefficient of variation of 3.29% was recorded for 1000-seed weight, the lowest index among the variables under study, with minimum and maximum values of 181.76 and 209.52 g respectively (Table 1). The reduced variability can be seen in the spatial distribution of the variable (Figure 2). Low values for the coefficient of variation for 1000-seed weight were also found by Mondoet al. (2012).
The coefficients of skewness and kurtosis were different from zero for all tested variables (Table 1). Skewness was negative for organic matter, pH, yield, thousand-seed weight and number of seeds. However, kurtosis had negative values for organic matter, calcium, magnesium, manganese and thousand-seed weight. Similar results were found by Cambardella et al. (1994). Skewness represents the degree of deviation of a curve in the horizontal direction, which may be positive, with a greater concentration of high values, or negative, with a
Table 1 - Statistical parameters for soil attributes and the yield components of soybean seed, for the crop of 2012/2013
Figure 2 - Spatial maps of the chemical properties of the soil and the yield components of soybean seed, for the crop of 2013/2014 predominance of low values. Kurtosis expresses the degree
of flattening of a curve in relation to a curve representing a normal distribution (ANDRIOTTI, 2013). It should be noted
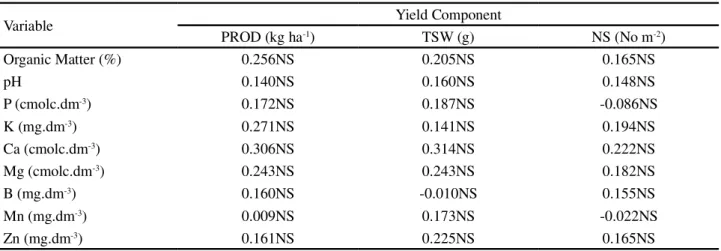
Pearson linear correlation analysis for the chemical properties of the soil and yield components of the seed showed no correlation between variables (Table 2). Low correlation between crop yield and the chemical properties of the soil was also found by Mondo et al. (2012). The absence or even low levels of correlation may indicate that other factors are affecting crop performance, requiring more detailed investigation. For Motomiyaet al. (2011), in the comprehensive management associated with precision farming, it is necessary to adapt the recommendations, considering for example the use of modern cultivars, the expected productivity, and the characteristics which involve the spatial variability of the soil in the production area.
The spatial distribution of the chemical properties of the soil and of the yield components were established by analysis of the semivariograms and their components (Table 3). Broadly speaking, significant variations were found in the range of spatial dependence for all variables, with values varying from 200 to 700 m. The range indicates the limit of spatial dependence of a variable, so that determinations made at distances which are greater than this value will have random spatial distribution, and are therefore independent and may be applied to classical statistics. Moreover, determinations made at smaller distances will be correlated, allowing interpolations at distances less than those sampled (ANDRIOTTI, 2013). Consequently, range values are important in planning future sampling, allowing grids to be dimensioned and the number of sampling points to be estimated (SOUZAet al., 2006). According to Oliveiraet al. (1999), knowledge of range values and the locations of areas where the greatest and/or lowest levels of a certain chemical attribute are concentrated, are essential for planning the management of soil fertility in precision farming.
Table 2 - Pearson linear correlation coefficient between properties of the soil and yield components of soybean seed, for the crop of 2012/2013
*PROD = productivity; TSW = 1000-seed weight; NS = number of seeds.NS= Not significant
Variable Yield Component
PROD (kg ha-1) TSW (g) NS (No m-2)
Organic Matter (%) 0.256NS 0.205NS 0.165NS
pH 0.140NS 0.160NS 0.148NS
P (cmolc.dm-3) 0.172NS 0.187NS -0.086NS
K (mg.dm-3) 0.271NS 0.141NS 0.194NS
Ca (cmolc.dm-3) 0.306NS 0.314NS 0.222NS
Mg (cmolc.dm-3) 0.243NS 0.243NS 0.182NS
B (mg.dm-3) 0.160NS -0.010NS 0.155NS
Mn (mg.dm-3) 0.009NS 0.173NS -0.022NS
Zn (mg.dm-3) 0.161NS 0.225NS 0.165NS
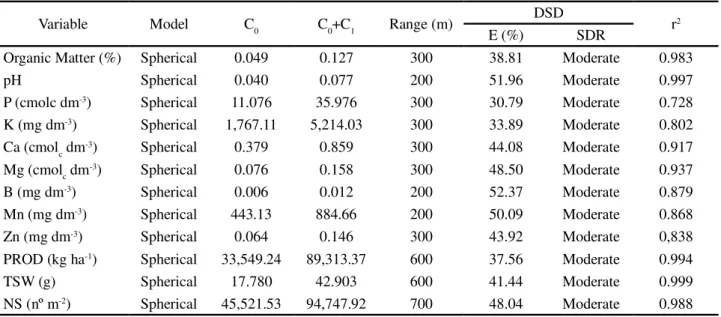
By analysing the parameters of the semivariograms (Table 3), it was found that all the variables fit the spherical model, agreeing with the results of research that indicate this model as being the most common for soil attributes (DALCHIAVON et al., 2012; MONTANARI et al., 2008). Among the chemical properties of the soil, the coefficient of determination (R2) was between 0.728
for phosphorus and 0.997 for pH. Whereas for the yield components, the observed variation was 0.988 for number of seeds to 0.994 for productivity. Values greater than 0.728 for soil properties and 0.988 for yield components show respectively that 72.8% and 98.8% of the variability found in the values for estimated semivariance can be explained by the fitted models (SOUZA et al., 2006). Evaluating the spatial variability of the chemical properties of the soil and of productivity in maize, Silvaet al. (2010) found a coefficient of determination ranging from 0.85 for productivity to 0.99 for base saturation and aluminium.
Table 3 - Parameters of the semivariograms fitted to the data for the soil properties and yield components of soybean seed, for the crop of 2012/2013
Nugget effect: C0; Sill: C0+ C1; Degree of spatial dependence: DSD; Nugget effect coefficient: E (%); Spatial dependence ratio: SDR; Coefficient of determination: r2 *PROD = productivity; TSW= 1000-seed weight; NS = number of seeds
Variable Model C0 C0+C1 Range (m) DSD r2
E (%) SDR
Organic Matter (%) Spherical 0.049 0.127 300 38.81 Moderate 0.983
pH Spherical 0.040 0.077 200 51.96 Moderate 0.997
P (cmolc dm-3) Spherical 11.076 35.976 300 30.79 Moderate 0.728
K (mg dm-3) Spherical 1,767.11 5,214.03 300 33.89 Moderate 0.802
Ca (cmolc dm-3) Spherical 0.379 0.859 300 44.08 Moderate 0.917
Mg (cmolc dm-3) Spherical 0.076 0.158 300 48.50 Moderate 0.937
B (mg dm-3) Spherical 0.006 0.012 200 52.37 Moderate 0.879
Mn (mg dm-3) Spherical 443.13 884.66 200 50.09 Moderate 0.868
Zn (mg dm-3) Spherical 0.064 0.146 300 43.92 Moderate 0,838
PROD (kg ha-1) Spherical 33,549.24 89,313.37 600 37.56 Moderate 0.994
TSW (g) Spherical 17.780 42.903 600 41.44 Moderate 0.999
NS (nº m-2) Spherical 45,521.53 94,747.92 700 48.04 Moderate 0.988
The nugget effect coefficient (E%) had minimum and maximum values of 30.79% and 52.37%. The spatial dependence ratio (SDR) was obtained as per a classification proposed by Cambardella et al. (1994), showing that all the variables had moderate spatial dependence. This criterion is based on the results of the nugget effect coefficient of the variables being between 25% and 75%. These data show that the semivariograms can explain most of the variance in the experimental data. Evaluating the spatial variability of the chemical properties of the soil, Mondo et al. (2012) and Vieira et al. (2010) observed moderate to strong variations for the spatial dependence ratio. According to Luz, Luz and Gadotti (2013), variograms with a moderate to strong spatial dependence structure generate more accurate kriging maps than those generated with weak spatial dependence, due to the smaller contribution of the random component to the variability of the data.
The spatial distribution maps for the variables under study provided an adequate diagnosis of the distribution of soil attributes and yield components, displaying sensitivity in identifying minor variations (Figure 1), similar to that obtained by Montanariet al. (2008), and Motomiyaet al. (2011). A large range can be seen for the chemical properties, revealing problems that can occur when using average values for fertility management. For certain locations in the production area, the application of fertilisers will be lower than required, in some it will be consistent with requirements, and in others excessive
doses may be applied, compromising the productivity and quality of the seeds. In their research, Mattioni, Schuch and Villela (2011), and Mondo et al. (2012) found that the physiological quality of soybean seeds is not uniform across production areas, with vigour displaying greater sensitivity, and therefore greater variability, in comparison to germination.
CONCLUSIONS
1. The highest values for spatial variability in the production area for soybean seeds, measured by the coefficient of variation, were seen for phosphorus and potassium, while organic matter, pH and yield components had the lowest coefficients of variation; 2. The spatial distribution of properties using interpolation maps was efficient in identifying and determining spatial variability. The chemical properties of the soil displayed moderate spatial dependence, with values ranging from 200 to 700 m.
ACKNOWLEDGEMENT
REFERENCES
AMADO, T. J. C. et al. Atributos químicos e físicos de latossolos e sua relação com os rendimentos de milho e feijão irrigados.Revista Brasileira de Ciência do Solo, v. 33, n. 4,
p. 831-843, 2009.
AMADO, T. J. C.; SANTI, A. L. Agricultura de precisão aplicada ao manejo do solo na cultura da soja.In: THOMAS, A. L.; COSTA, J. A. (Org.). Soja: manejo para alta produtividade de grãos. 1. ed. Porto Alegre: Ed. Evangraf, 2010. cap. 6, p. 177-207.
ANDRIOTTI, J. L. S. Fundamentos de estatística e geoestatística. São Leopoldo: Ed. UNISINOS, 2013. 165 p. ANTUNIASSI, U. R. A tecnologia agrícola a serviço do manejo fitossanitário. In: MACHADO, A. K. F. M.; OGOSHI, C.; PERINA, F. J. Avanços na otimização do uso de defensivos agrícolas no manejo fitossanitário. 1.
ed. São Carlos: Suprema Gráfica e Editora : UFLA, 2012. p. 19-36.
BRASIL. Ministério da Agricultura, Pecuária e Abastecimento. Secretaria de Defesa Agropecuária. Regras para análise de sementes. Brasília, DF: MAPA: SDA, 2009. 395 p.
CAMBARDELLA, C. A.et al. Field-scale variability of soil properties in central Iowa soils. Soil Science Society of America Journal, v. 58, n. 5, p. 1501-1511, 1994.
COMPANHIA NACIONAL DE ABASTECIMENTO.
Acompanhamento da safra brasileira: grãos: safra
2013/14: décimo segundo levantamento. Brasília, DF, v. 1, n. 12, set. 2014. 151 p.
DALCHIAVON, F. C.et al. Variabilidade espacial de atributos da fertilidade de um Latossolo Vermelho Distroferrico sob Sistema Plantio Direto.Revista Ciência Agronômica, v. 43,
n. 3, p. 453-461, 2012.
FERRAZ, G. A. S. et al. Agricultura de precisão no estudo de atributos químicos do solo e da produtividade de lavoura cafeeira. Coffee Science, v. 7, n. 1, p. 59-67, 2012.
FREDDI, O. S. et al. Produtividade do milho relacionada com a resistência mecânica a penetração do solo sob preparo convencional.Engenharia Agrícola, v. 26, n. 1, p. 113-121, 2006.
GIOTTO, E.; ROBAINA, A. D.A agricultura de precisão com o CR Campeiro 7: manual do usuário. Santa Maria: UFSM. Centro de Ciências Rurais. Departamento de Engenharia Rural. Laboratório de Geomática, 2007, 319 p. JOHANN, J. A. et al. Variabilidade espacial dos atributos físicos do solo e da produtividade em um Latossolo Bruno Distrófico da região de Cascavel, PR. Revista Brasileira de Engenharia Agrícola Ambiental, v. 8, n. 2, p. 212-219,
2004.
LUZ, M. L. G. S.; LUZ, C. A. S.; GADOTTI, G. I. Mapas de controle de aplicação: tecnologias de taxa variável e aplicação em taxa variável.In: LUZ, M. L. G. S.; LUZ, C. A.
S.; GADOTTI, G. I. (Ed.).Agricultura de precisão. 1. ed. Pelotas. Ed. UFPEL, 2013. cap. 13, p. 241-254.
MATTIONI, N. M.; SCHUCH, L. O. B.; VILLELA, F. A. Variabilidade espacial da produtividade e da qualidade das sementes de soja em um campo de produção. Revista Brasileira de Sementes, v. 33, n. 4, p. 608-615, 2011. MESTAS, R. M. et al. Variabilidad espacial de los atributos físico-hídricos del suelo y de la productividad del cultivo de fréjol (Phaseolus vulgaris L) irrigado bajo un sistema de siembra directa.
Revista de Ciências Agrárias, v. 33, n. 1, p. 307-313, 2010.
MONDO, V. H. V. et al. Spatial variability of soil fertility and its relationship with seed physiological potential in a soybean production area. Revista Brasileira de Sementes, v. 34, n. 2, p. 193-201, 2012.
MONTANARI, R.et al. Variabilidade espacial de atributos químicos em latossolo e argissolos.Ciência Rural, v. 38, n. 5, p. 1266-1272, 2008.
MOTOMIYA, A. V. A. et al. Variabilidade espacial de atributos químicos do solo e produtividade do algodoeiro.
Revista Agrarian, v. 4, n. 11, p. 01-09, 2011.
OLIVEIRA, J. J.et al. Variabilidade espacial de propriedades químicas em um solo salino-sodico. Revista Brasileira de Ciência do Solo, v. 23, n. 4, p. 783-789, 1999.
RIFFEL, C. T. et al. Densidade amostral aplicada ao monitoramento georreferenciado de lagartas desfolhadoras na cultura da soja.Ciência Rural, v. 42, n. 12, p. 2112-2119, 2012. SOCIEDADE BRASILEIRA DE CIÊNCIA DO SOLO. Núcleo Regional Sul.Manual de adubação e de calagem para os estados do Rio Grande do Sul e de Santa Catarina. 10. ed. Porto Alegre:
Comissão de Química e Fertilidade do Solo, 2004. 394 p. SCHLINDWEIN, J. A.; ANGHINONI, I. Variabilidade vertical de fósforo e potássio disponíveis e profundidade de amostragem do solo no sistema plantio direto. Ciência Rural, v. 30, n. 4, p. 611-617, 2000.
SILVA, S. A.et al. Variabilidade espacial do fosforo e das frações granulometricas de um Latossolo Vermelho Amarelo. Revista Ciência Agronômica, v. 41, n. 1, p. 1-8, 2010.
SOUZA, C. M. A. et al. Espacialização de perdas e da qualidade do feijão em colheita semimecanizada. Acta Scientiarum, v. 32, n. 2, p. 201-208, 2010.
SOUZA, Z. M. et al. Otimização amostral de atributos de latossolos considerando aspectos solo-relevo.Ciência Rural, v. 36, n. 3, p. 829-836, 2006.
VIEIRA, S. R. Geoestatistica em estudos de variabilidade espacial do solo. In: NOVAIS, R. F.; ALVARES, V. V. H.; SCHAEFFER, C. E. G. R. Tópicos em ciência do solo. 1.
ed. Viçosa: Sociedade Brasileira de Ciência do Solo, 2000. p. 1-54.
WERNER, V. et al. Aplicação de fertilizantes a taxa variável em agricultura de precisão variando a velocidade de deslocamento. Revista Brasileira de Engenharia Agrícola e Ambiental, v. 11, n. 6, p. 658-663, 2007.
ZANÃO JÚNIOR, L. A. et al. Variabilidade espacial do pH, teores de matéria orgânica e micronutrientes em profundidades de amostragem num latossolo vermelho sob semeadura direta.