Homepage:seer.upf.br/index.php/rbca/index
O R I G I N A L P A P E R
A proposal of Infrastructure-as-a-Service providers
pricing model using linear regression
Cássio L. M. Belusso
1
, Sandro Sawicki
2
, Vitor Basto-Fernandes
3
, Rafael Z.
Frantz
2
and Fabricia Roos-Frantz
2
1Federal University of Fronteira Sul and2UNIJUI University and3University Institute of Lisbon
*[email protected]; [email protected]; [email protected]; [email protected];
Received:15/01/2018. Revised: 03/04/2018. Accepted: 05/06/2018.
Abstract
The increasing demand for companies to reduce the IT infrastructure (on-premise) are driving the adoption of a type of cloud computing category known as Infrastructure-as-a-Service (IaaS) to provide virtualized computing resources over the Internet. However, the choice of an instance of virtual machine whose configuration is able to meet the demands of the company is a complex task, especially concerning the price charged by providers. The lack of transparency of the mechanism of definition of the prices adopted by providers makes difficult the decision-making process, considering the influence of several factors on the final price of the instances, among them the geographical location of the data center. In view of this problem, this work presents a new proposal of price modeling of instances using multiple linear regression model, including the geographical location of the data center as one of variables of the model. To verify the accuracy of the regression model proposed, the calculated prices were compared to real prices charged by IaaS providers Amazon EC2, Google Cloud Platform e Microsoft Azure.
Key words: Cloud Computing; Enterprise Application Integration; Infrastructure-as-a-Service; Linear Regression; Pricing Model
Resumo
A crescente demanda por parte das empresas para reduzir a infraestrutura de TI local está impulsionando a adoção de um tipo de categoria de computação em nuvem conhecida como Infraestrutura-como-um-Serviço (IaaS) para fornecer recursos de computação virtualizados pela Internet. No entanto, a escolha de uma instância de máquina virtual cuja configuração seja capaz de atender às demandas da empresa é uma tarefa complexa, especialmente no que se refere ao preço cobrado pelos provedores. A falta de transparência do mecanismo de definição dos preços adotados pelos provedores torna difícil o processo de tomada de decisão, considerando a influência de vários fatores sobre o preço final das instâncias, dentre eles a localização geográfica do data center. Diante deste problema, este trabalho apresenta uma nova proposta de modelagem de preços de instâncias usando o modelo de regressão linear múltipla, incluindo a localização geográfica do data center como uma das variáveis do modelo. Para verificar a precisão do modelo de regressão proposto, os preços calculados foram comparados aos preços reais cobrados pelos provedores de IaaS Amazon EC2, Google Cloud Platform e Microsoft Azure.
Palavras-Chave: Computação em Nuvem; Infraestrutura-como-um-Serviço; Integração de Aplicações Empresariais; Modelo de Preços; Regressão Linear
1 Introduction
Cloud computing, where users of different profiles can develop, implement and execute their applications through the Internet, arises as a new concept in the field of information technology. Because it is considered a promising model, cloud computing industry is expected to reach the mark of 241 billion dollars by 2020 (Singh and Dutta;2015).
According to Alkhalil et al. (2017), the decision to migrate to the cloud is still considered complicated due to the immaturity and dynamic evolving the nature of the cloud environment. However, the authors point out that migration is a strategic organizational decision that can improve performance, productivity, growth and increase competitiveness. Moreover, for those who wish to reduce the costs of acquisition and maintenance of computational infrastructures, without performance loss, cloud computing constitutes a great alternative. Studies based in simulations estimate that, in a time cycle of a little more than a decade, the total cost of implementing and maintaining a cloud environment may be up to two thirds lesser than keeping a traditional non-virtualized data center (Chun and Choi;2014).
Generally speaking, cloud computing services can be grouped in three main modalities: Software-as-a-Service (SaaS), Platform-as-Software-as-a-Service (PaaS) and Infrastructure-as-a-Service (IaaS). In SaaS, the user utilizes a certain software and pays for the utilization; in PaaS, the user has an environment to project, test and implant applications; in IaaS, the user hires virtual machines and manages the computational resources in any way they want.
In cloud computing, the user utilizes the several services that the cloud offers the same way as if they were installed in their own computer. However, the main attraction of cloud computing is still its cost-benefit ratio, in which the user pays only for what they use (pay-per-use model). In this model, the charge is based on the service and not on the product. In IaaS, for example, in case the user needs a virtual machine to execute an application, they hire them for the period that they want and, afterwards, they can simply cancel the service.
The infrastructure services in IaaS are offered by providers which make them available in the form of groups called instances. The instances are made up of a predefined quantity of computational resources in virtual machines hosted in servers in the cloud, available to be hired by the users. The computational configuration of the instances are defined aiming to contemplate all user profiles, varying from smaller configurations, usually recommended for users with small demands, to larger configurations, usually recommended for large companies which have a great number of applications being executed simultaneously.
The quantity of resources of the virtual machine instance is what defines its price. However, there is no unanimity regarding the presence of a mechanism used by the providers able to calculate exactly how much an instance costs. Researches indicate that this mechanism of price definition exists indeed (Murthy et al.;2012;El Kihal et al.;2012;Mitropoulou et al.; 2016); on the other hand, others claim and
demonstrate that the definition of these prices is more complex than it is imagined (Al-Roomi et al.;
2013;Mazrekaj et al.;2016;Menzel and Ranjan;2012). What is certain up to the moment is that choosing the best instance is becoming an increasingly difficult task, considering the great number of providers and the countless instances offered by each of them.
Some important questions may arise at the moment of choosing a new instance. Not always the option for the smallest price is the best choice. Opting for a cheaper instance might compromise the execution of the application for which the virtual machine has been hired, because it might not have the necessary computational resources for a good performance of the application. Similarly, by acquiring a more expensive instance only because it has more computational resources to execute an application which does not demand as many resources, the user will be unnecessarily increasing the cost. According toSoni and Hasan(2017), despite several pricing models offered by providers, the ideal price is one that maximizes revenue for the provider and increases the quality of services to end users. In this cases, it is important to be attentive to the application requirements in order to avoid hasty decisions.
Despite the several doubts in the decision-making process, companies are appearing as high potential customers for cloud computing (Marston et al.;
2011). In the research field called Enterprise Application Integration (EAI), this new model provides a high capacity computational infrastructure at a low cost, where integration solutions can be implanted and executed. The integration solutions are extremely important in the process of integrating the applications because they are softwares that act as a communication link between the countless heterogeneous applications which form the software ecosystem of the companies, making it possible for them to share information in a fast and efficient way, improving their business processes (Frantz et al.;
2016).
Due to the increasing advances in cloud computing, there is a tendency of migration of some applications from companies’ data centers to virtual machines in the cloud. Consequently, for a company to be able to integrate these applications, the integration solutions should be created in a way that their implantation and execution also occur in a virtual machine in the cloud. This is because, in the current model, the companies need large investments in local computational infrastructures, because they need a large volume of applications being executed simultaneously to keep their activities in full operation.
However, even knowing that the cloud provides the companies with more powerful machines at a low price, it is necessary to know how to determine which instance of virtual machine will meet the requirements of computational resources as well as other requirements that a solution might demand, like, for example, the geographical location of the data center, so that it is, economically, the best choice for the company.
The geographical location of the data center is one of the factors that directly influence the price of the instances and also the quality of service offered by providers, but many researches do not
consider it in their works. Generally, there is a big large price oscillation between the different countries and continents in which the providers have hosted data centers. This variation occurs due to different taxation and values of physical resources. Countries that develop their own technology (physical resources) and management tools provide greater agility in updating and improving their data centers. In this context, providers that have this capability, when setting different prices for different regions, offer more options in the pursuit of economy and performance.
In addition, the use of servers located in different locals allows the execution of virtual machines at times of less traffic and computational demand. However, it is worth to evaluate the latency provided by the geographical distance. Another aspect concerns the lows that some countries have and that prevent certain categories of companies from hosting their information outside the country. In this sense, it is necessary for the company to verify the current legislation in its field of activity.
Even with significant investments from the companies being made in cloud computing and, given the importance of the integration solutions for the integration of their applications, the providers do not offer a method which describes, in details, the variability of the services and their restrictions, so that these models could be used in the decision-making process (Hernández et al.;2015).
This article seeks, through mathematical modeling, to develop a model capable of making the price policy adopted by IaaS providers more transparent, including the geographical location of the data center in the set of it variables, with the purpose of helping the companies choose the best provider/instance to implant and execute their integration solutions in the cloud. For that, we present a new proposal of price modeling for the instances offered by three cloud computing providers. Amazon EC2 (Amazon; 2017), Google Compute Engine (Google;2017) and Microsoft Azure (Microsoft;2017). These providers were chosen by Gartner’s 2016 Magic Quadrant for IaaS and because of their market position and number of users in the cloud community.
The rest of the article is organized in the following manner: section 2 summarizes the related works which present modeling proposals and studies of the price policy applied by cloud computing providers; section 3 presents a set of hypotheses and data for the mathematical modeling of the problem; section 4 presents the results obtained from the proposed model and their discussion; in section5, the conclusions are presented.
2 Related Work
The works presented in this section aim to understand how the IaaS providers determine the price policy applied to their services. The perception inside the academic community is that this understanding is not an easy task, what may justify the different approaches adopted by the authors in their researches.
Menzel and Ranjan(2012) consider the selection of cloud services a critical problem and impossible to be resolved manually due to the heterogeneity of the criteria and of the complex dependence between the infrastructure services. To help with this decision-making process, they proposed a framework called CloudGenius, which, through a mathematical approach, defines parameters that characterize a given infrastructure in the cloud. CloudGenius is capable of dealing with the decision-making process as a multi-criterion problem, because it considers several configuration elements. The hierarchy of the services practiced by CloudGenius is based on three main objectives: best price, best latency and best Quality-of-Service (QoS). From these objectives arise other criteria like, price per hour, average network latency, performance (CPU, memory and storage) and time of activity.
Al-Roomi et al. (2013) make a comparison of price modeling techniques applied and proposed, highlighting the pros and cons of each one. The comparison is made considering aspects like equity, prices approach and time of utilization. Regarding equity, the authors claim that most researches are biased to providers, which aim at increasing revenue and reducing costs. Regarding prices approach, the authors classify them as static or dynamic, and they might depend on several factors, like the user profile and the QoS level. Regarding the time of utilization, they identified techniques based on the period of subscription, aimed at users with large utilization, and based on the pay-per-use model, for users with small utilization.
Huang et al.(2015) propose to the providers, from a mathematical point of view, a hybrid strategy of prices, in which fixed prices for reserved services and spot prices for services on-demand are available simultaneously. They assume that the spot prices are associated to the risk of interruption of the services, that is, the customer that utilizes the spot prices range may not have their task concluded, and analyze if the computation services of this modality, defined as Damaged Services, are valuable to the provider, with the risk of their services becoming less attractive to the users. The comparison between these three kinds of service offers and price strategies has been based in the following aspects: provider’s profit, consumer surplus and satisfaction. The authors concluded that the provider should use the strategy of hybrid pricing only when the clients are susceptible to the interruption of the service or when the values among the models that form the hybrid model are very different. One of the limitations of the research is that only one provider has been considered, eliminating the possibility of competition, fact which may significantly alter the profitability of the analyzed provider.
Ouarnoughi et al. (2016) present a cost model for cloud storage systems of IaaS level. According to them, among the computational resources which form the virtual machines instances, the storage system is responsible for the biggest energy consumption in a virtualized environment, what justifies the creation of a cost model for such service. In the proposed model, they consider aspects like the virtual environment, energy and QoS in terms of Service Level Agreement (SLA). The model validation
has been performed through a comparison to the real values and the results obtained were considered satisfactory.
Singh and Dutta(2015) propose a price preview algorithm for the Spot instances of Amazon AWS. They consider that, despite Spot instances being cheaper, many users are in doubt regarding the value they should offer at the auction platform in which the provider makes available the non-used computational capacity, because they don’t know what the spot price will be like in the future, due to the dynamic of the prices of this kind of instance. The algorithm developed allows the spot price preview in short term and long term (one and five days ahead, respectively). The authors could preview the spot price with error inferior to 10% in short term and inferior to 20% in long term.
Portella et al. (2017) statistically analyze a set of six instances using two cloud pricing models of Amazon EC2 provider: On-demand and Spot. The analysis of the On-demand instances resulted in multiple linear regression equations that indicated that processor and RAM memory are the variables that most influence the price composition of the six instances analyzed. The analysis of the Spot model showed that the same instances can be acquired on average by offers close to 30% of the value paid when compared to the On-demand model, and with a greater availability, generally above of 90%.
Hinz et al.(2016) present a charging model called Virtual Power, which analyzes the individual quantity of energy consumed by each virtual machine, more specifically the electric energy consumed by the processors, and compare it to the charging model of Amazon EC2. According to them, the cost models applied by the main IaaS providers do not consider the percentual of use, but only the quantity of processors allocated by each virtual machine, what does not represent the resources consumption of a data center. The authors consider that, contrary to what is practiced, there should be a fair share of this kind of charge between the users of virtual machines. They understand that a virtual machine which uses less computational resources of a server should pay a smaller value when compared to another which consumes more resources.
Wang et al. (2017) analyze the costs of a new pricing model in the Infrastructure-as-Service market, the Scheduled model. In this option, the number of instances, as well as the start and end times of the instances are scheduled. The authors propose a strategy to select an optimal combination of Scheduled instances coupled with On-demand and Reserved instances to optimize users’ costs. They use a set of hourly workload distributions to verify their proposal.
Even though many researchers are looking for the best way of understanding the price policy used by IaaS providers, the majority of the works studied analyze a small set of variables. Besides, many of them direct their attention to the models of hiring. In this new proposal, a multiple linear regression model is used aiming to contemplate a larger number of variables, including the geographical location of the data center in the set of qualitative variables, so that they can be selected considering the particularities and specifications of the integration solutions.
The linear regression as a price modeling tool was also used in the researches of El Kihal et al.
(2012) andMitropoulou et al.(2016,2017). The first uses it to analyze the prices of only one provider, hindering a Cross-Provider comparison, that is, a comparison capable of analyzing more than one provider in the same proposal (Hernández et al.;
2015). Besides, important variables in the price formation of the instances like the operating system and the geographical location of the data center are not considered; the second, despite contemplating a large number of providers, instances and variables, presents a regression models (linear and exponential) with a coefficient of determination below 60% for both, i.e., the models cannot adequately capture pricing dynamics.
In view of this reality, where the literature review indicates the lack of works that use the geographical location of the data center as a variable in most of researches present in the different cloud computing fields, this paper presets a multiple linear regression model that includes the geographical location of the data center in the set of qualitative variables, proving it influence on the prices charged by providers. We also present a regression model as a simple and fast mechanism able to help companies in this decision-making process of the best provider/instance for migration of these solutions is an important step in the context of EAI.
3 Mathematical Model Proposed
In this section is presented a proposal of price modeling of the instances of virtual machines offered by cloud computing providers in the context of IaaS. The main differential of this proposal is the focus directed to the EAI, more specifically to the migration of integration solutions to the cloud. As a consequence, some assumptions need to be made in the process of modeling, having the companies as target audience and considering very specific objectives, which are approached in detail in the next subsections.
3.1 Problem Definition
Many are the factors that directly influence the final price adopted by the providers. In this scenario, the main hypothesis consists in always searching for the cheapest instance of the three providers and, at the same time, that the instance is capable of offering an ideal QoS. In this work, we assume that the ideal QoS occurs when the instance of the virtual machine has a configuration capable of supporting the computational demand required by the integration solution within a specified cost.
The cost of an instance is directly proportional to the quantity of computational resources which form the configuration of the virtual machine. However, other factors also contribute significantly to the formation of its final price. The choice of the operating system, the type of storage and the geographical location of the data center are examples of important variables which may result in a big price difference.
instances are smaller in the case of virtual machines that use Linux instead of Windows, what can be easily verified with a simple consultation at the providers websites. In some cases, variations may also occur if the platforms are different.
The geographical location of the data center for the hosting of the virtual machines is one of the factors that most affect the prices of instances. Besides, the countless possibilities of location around the world make the decision-making process a lot more difficult. In these cases, the search for the place with the smallest price is not always simple, because the user may not be able to host the applications in the cheapest place due to specificities in the legislation of each region.
The IaaS providers offer to the users different forms of hiring services and, among them, On-demand and Reserved modalities are the most common. In On-demand modality, the user pays for what is used, and they can suspend the service at any time. In Reserved modality, the service is hired by a determined period of time, usually in years. Amazon, for example, also offers to their users Spot instances, in which the user participates of a kind of auction for the computational capacity not used. However, in this modality, there is a risk of the service being interrupted at the moment when the user offer is below the spot price, which is defined by the provider itself based on the supply and demand for available capacity. As an attractive factor, savings in relation to On-demand modality can reach up to 90%.
Regarding the economy, a good alternative to the users are the countless modalities of discounts offered by the providers. This stems from the necessity of standing out in the market of cloud computing at IaaS level. In a general way, in the Reserved instances, for example, the value of the time fees (computed in hours or minutes) tends to decrease as the hiring time period increases. There are also cases when by paying in advance a percentual of the total cost, the user obtains a discount. The larger the percentual of this payment, the larger the discount obtained. Other modalities of discount found are for virtual machines hosted in specific regions (Amazon;
2017), for percentage of monthly utilization of the virtual machine (Google;2017) and for instances with cost higher than a pre-established value (Microsoft;
2017).
3.2 Definition of Variables and Data Analysis The data collection process is an important step in the modeling process. Because of this, a large quantity of data of prices of instances has been collected directly from the sites of the chosen providers. The charge is made per hour of utilization and the billing model adopted was On-demand, because it suits the majority of user profiles. In this model, there is no long-term commitment and the user can cancel the service at any time. In the Reserved model, for example, the user hires an instance for a determined period of time.
From the large quantity of data obtained, a small sample formed by a group of four instances was selected. They were chosen considering the availability in more geographical locations. In this proposal, the options of locations for each
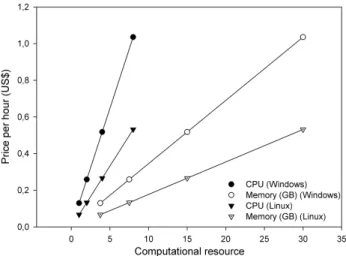
Figure 1:Computational resources versus price per hour in Amazon for operating system Windows and
Linux
provider are restricted to two, and they were chosen considering: (i) the smallest price, (ii) availability in Brazil and (iii) the variability of instances. For the provider Amazon were selected the regions US-East/US Standard and South America; for Google, the selected regions were United States and Europe; for Azure, we opted for the regions Central US and Brazil South.
Among the countless instances offered by the three providers, we opted for a group of smaller instances and with similar configuration. The instances of the three providers chosen are formed by the quantities of the following computational resources: memory, CPU and storage. There might be differences in the nomenclature of these resources, depending on the provider. Considering that the integration solutions are applications which do not need a lot of storage space and that each instance already contemplates at least one quantity of this resource, we opted for its exclusion as a quantitative variable of the model. So, the model now has only two quantitative variables: CPU and memory. For the quantitative variables we opted for operating system and geographical location of the data center, both for presenting noteworthy influence over the final price of the instances.
The main objective of the sample was to analyze the behavior of the price of instances through variation of the main computational resources. Tab.
1presents the instances of each provider with the respective computational resources which form them.
Aiming to justify the option for multiple linear regression, dispersion charts have been used to verify the form of distribution of the data collected. The markings on the graphics represent the four instances of the respective providers, from the smallest to the largest. In practically all the situations, it is noted that the price of instances which use Linux as operating system of their virtual machines is smaller, except for Google, in which some prices are the same.
Fig. 1and2presents the dispersion chart of the quantity of CPU and memory versus the price per hour of utilization for the provider Amazon. The billing model adopted was On-demand. In Fig. 1
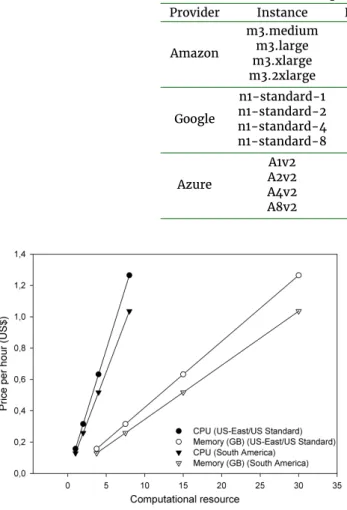
Table 1:Group of instances chosen
Provider Instance Number of CPU’s Memory (GB) Amazon m3.medium 1 3,75 m3.large 2 7,5 m3.xlarge 4 15 m3.2xlarge 8 30 Google n1-standard-1 1 3,75 n1-standard-2 2 7,5 n1-standard-4 4 15 n1-standard-8 8 30 Azure A1v2 1 2 A2v2 2 4 A4v2 4 8 A8v2 8 16
Figure 2:Computational resources versus price per hour in Amazon for geographical location US
East/US Standard and South America
were analyzed the prices of the four instances of Amazon, varying only the operating system of the virtual machine, maintaining fixed the region US East/US Standard. A linear behavior is perceived in all the combinations between CPU resources and memory and the operating systems Windows and Linux. In Fig.2, we varied the geographical location, South America and US-East/US Standard, and the operating system Windows was maintained. Again, a linear behavior is present in all the combinations between computational resources and geographical locations.
Fig.3and4presents the dispersion chart of the quantity of CPU and memory versus the price per hour of utilization for the provider Google. The price layer adopted was Regular. In Fig.3were analyzed the prices of the four Google instances, varying the operating system of the virtual machine, maintaining the region United States. In Fig. 4, we varied the geographical location, Europe and United States, and the operating system Windows was maintained. Again is detected the presence of linear behavior in the combinations of the computational resources with the operating systems and the geographical locations.
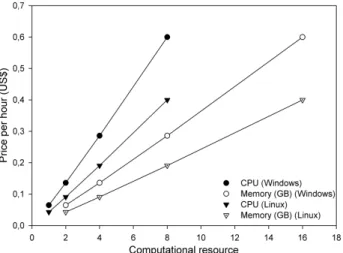
Fig. 5 and 6 presents the dispersion chart of the quantity of CPU and memory versus the price per hour of utilization for the provider Azure. The price layer adopted was Standard. In Fig. 5 were
Figure 3:Computational resources versus price per hour in Google for operating system Windows and
Linux
Figure 4:Computational resources versus price per hour in Google for geographical location Europe and
United States
analyzed the prices of the four Azure instances, varying the operating system of the virtual machine, maintaining the region Central US. In Fig. 6, we varied the geographical location, Brazil South and Central US, and the operating system Windows was
Figure 5:Computational resources versus price per hour in Azure for operating system Windows and
Linux
Figure 6:Computational resources versus price per hour in Azure for geographical location Central US e
Brazil South
maintained. Once more there is the predominance of linear behavior in all the combinations between the resources of CPU and memory with the operating systems and the geographical locations.
3.3 Regression Model
The presence of more than one independent variable considered in the model makes necessary the use of multiple linear regression. With it, it is possible to estimate the individual cost of the features which influence the final price of the instances through calculation of the coefficients related to each one of the variables of the model (Wonnacott and Wonnacott;1990). The model adapted for this proposal is described by Equation (1).
Ci= a0+ a1X1i+ a2X2i+ ... + anXni+ εi; i = 1, ..., k (1)
Where:
• i refers to the i-th instance, to any of the providers chosen;
• n is the number of variables of the model; • k is the total number of instances;
• Ciis the final price of instance i;
• an are the coefficients of the regression to be
calculated, that is, the slice of participation of the feature Xniin the final price of instance i;
• Xniare the independent variables of the model; in
this case, each one of the features which influence the final price of instance i;
• εi is the residual error of the regression for each
instance i.
The quantitative variables of the model are composed by hardware requirements, CPU and memory, and the qualitative variables are composed by software requirements, in this case, operating system and geographical location of the data center. The representation of the qualitative variables of the model are made through Dummy variables, in which a determined category can assume the value 0 or 1 (Wonnacott and Wonnacott;1990). Dummy variables are previously defined and inserted in the model and they represent the variables that cannot be quantified.
In the Equations (2), (3) and (4) are presented the regression models obtained for the price modeling of the providers Amazon, Google and Azure, respectively. The Dummy variables assigned to the operating system (OS in the equations) are 1 for Windows and 0 for Linux and, concerning the geographical location of the data center (GL in the equations), the corresponding values to 0 and 1 depend on each provider, namely: for Amazon, 1 corresponds to region South America and 0 to US-East/US Standard; for Google, 1 refers to the region Europe and 0 to United States; for Azure, 1 refers to the region Brazil South and 0 to Central US.
Ci= –0, 172 + 0, 112 · CPU + 0, 236 · OS + 0, 107 · GL (2)
Ci= –0, 0825 + 0, 07 · CPU + 0, 15 · OS + 0, 015 · GL (3)
Ci= –0, 118+0, 0772·CPU+0, 109·OS+0, 0944·GL (4) The values of the coefficients of determination R2 adjusted from the regression models calculated were 90,7% for the Amazon model, 91,6% for the Google model and 92,3% for the Azure model. These values indicate that the model is capable of explaining the data collected satisfactorily. As to the significance level of the models, considering a level of 5%, all obtained good results.
The variance inflation factor (VIF) calculated indicated that the independent variables are not correlated. The complete diagnosis of the residue was also performed. The Shapiro-Wilk test shows that the residue is normally distributed. The influence diagnosis through DFFITS shows the presence of two influent points for the Amazon and Azure models and four points for the Google model. Tests have
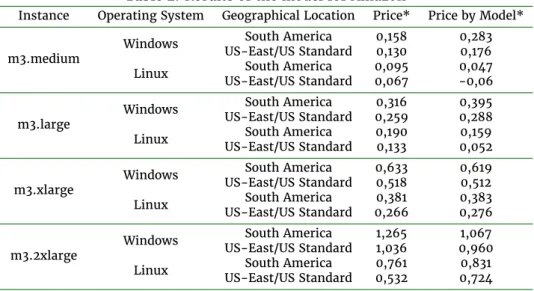
Table 2:Results of the model for Amazon
Instance Operating System Geographical Location Price* Price by Model* m3.medium Windows
South America 0,158 0,283 US-East/US Standard 0,130 0,176 Linux US-East/US StandardSouth America 0,0950,067 0,047-0,06 m3.large Windows
South America 0,316 0,395 US-East/US Standard 0,259 0,288 Linux US-East/US StandardSouth America 0,1900,133 0,0520,159 m3.xlarge Windows
South America 0,633 0,619 US-East/US Standard 0,518 0,512 Linux US-East/US StandardSouth America 0,2660,381 0,3830,276 m3.2xlarge Windows
South America 1,265 1,067 US-East/US Standard 1,036 0,960 Linux US-East/US StandardSouth America 0,5320,761 0,7240,831 *Price per hour (in US Dollars).
been performed through withdrawal of these influent points and there was an improvement in the results. However, considering that the sample is composed by only 16 observations, it was assumed that the withdrawal of more than 10% of the observations would not be ideal.
It is possible to observe that not all the factors were significant to the price modeling, for example, memory, and, among the influential factors, the operating system is the one that most affects the final price, because it has the largest regression coefficient. The positive coefficients obtained in relation to the operating system Windows mean that, when opting for a virtual machine that uses this operating system, there is an increase in the final price of the instances, that is, an instance is more expensive if it uses Windows instead of Linux, what is in agreement with what had been identified during data collection. The same interpretation is valid for the geographical location of the data center, in which one of the places is cheaper than the other (except in some Google instances, where the values are the same in the two chosen regions).
4 Discussion of Results
Tab. 2,3and4present the prices of the instances calculated with the regression models obtained in subsection3.3for the providers Amazon, Google and Azure, respectively. For the purpose of comparison with the values obtained by the models, the real price practiced is also shown.
Tab.2regarding Amazon, it is possible to notice that, concerning the instance, the prices obtained by the regression model were closer to the real values in the instance m3.xlarge. Concerning the operating system, the results obtained were similar for Windows and Linux, that is, it is not possible to affirm to which of the operating systems the model was more efficient. The same conclusion applies to the geographical location of the data center.
Tab. 3, regarding Google, the values obtained for the instance n1-standard-4 were the most satisfactory, because there is little difference between
the price practiced and the price calculated by the model. Concerning the operating system and the geographical location of the data center, the values change in a way that it is not possible, at least visually, to identify for which of them the model obtained better results.
Tab.4the most satisfactory results were obtained for instance A4v2. Again, it is not evident for which operating system or geographical location of the data center the model presents better results.
The presence of a bigger discrepancy among some of the real prices and the prices calculated by the three models and of a negative value for one of the instances of each provider indicate the necessity of improving them. The choice for using small values may be one of the causes of these differences to seem bigger than they really are, in view of the high values of the determination coefficients obtained. One alternative would be working with the prices considering a more extended period of time, resulting in higher prices and easier to be modeled. Besides, it is known that the prices are influenced by many aspects and, by the addition of new variables to the models, the results tend to improve considerably. We should not forget to consider, however, that most models present non-linearities and, because of this, modeling might be compromised.
5 Conclusion
In this work was presented a proposal of modeling of the prices of instances practiced by cloud computing providers in the IaaS context using a multiple linear regression model. We opted for analyzing the price of a small group of instances practiced by the providers Amazon, Google and Azure, due to their prominence in the cloud computing market.
The preliminary data analysis, the linear behavior present in the dispersion charts and the presence of multi variables made the multiple linear regression a good option for the modeling of the problem. Some simplifying hypotheses for the creation of this new methodology were discussed and some graphics were used to justify the model choice.
Table 3:Results of the model for Google
Instance Operating System Geographical Location Price* Price by Model* n1-standard-1 Windows
Europe 0,09 0,1525
United States 0,09 0,1375 Linux United StatesEurope 0,050,05 -0,01250,0025 n1-standard-2 Windows
Europe 0,18 0,2225
United States 0,18 0,2075 Linux United StatesEurope 0,100,10 0,07250,0575 n1-standard-4 Windows
Europe 0,37 0,3625
United States 0,35 0,3475 Linux United StatesEurope 0,210,19 0,19750,2125 n1-standard-8 Windows
Europe 0,74 0,6425
United States 0,70 0,6275 Linux United StatesEurope 0,420,38 0,49250,4775 *Price per hour (in US Dollars).
Table 4:Results of the model for Azure
Instance Operating System Geographical Location Price* Price by Model* A1v2 Windows
Brazil South 0,092 0,1626 Central US 0,065 0,0682 Linux Brazil SouthCentral US 0,0430,061 -0,04080,0536 A2v2 Windows
Brazil South 0,193 0,2398 Central US 0,136 0,1454 Linux Brazil SouthCentral US 0,1290,091 0,03640,1308 A4v2 Windows
Brazil South 0,405 0,3942 Central US 0,286 0,2998 Linux Brazil SouthCentral US 0,2700,191 0,28520,5940 A8v2 Windows
Brazil South 0,850 0,7030 Central US 0,600 0,6086 Linux Brazil SouthCentral US 0,5670,400 0,49960,5940 *Price per hour (in US Dollars).
The models presented indicate that the use of linear regression as a price modeling tool can help reduce the complexity of the decision-making process regarding which provider/instance is the best choice for the migration of integration solutions to the cloud, considering aspects like cost and QoS and, at the same time, it is capable of identifying the factors which most influence the formation of the final price of instances. A set of qualitative and quantitative variables was analyzed and, according to the hypotheses assumed during modeling, the coefficients of the regression models evidenced that the CPU quantity, the operating system and geographical location of the of the data center alter the prices of the instances significantly. The same cannot be said about the quantity of memory, as it did not present influence on the prices.
Statistically, the regression models presented good results. It indicates that the models can improve the transparency of the price policy adopted by IaaS providers. However, the presence of influent points for each model slightly affected the results obtained at the statistical analysis. Anyway, the proposal of price formation modeling for services
of computational infrastructure in the cloud can, through a mathematical approach, provide useful information, not only regarding price policies, but also regarding the cloud market, because the presented modeling also allows the Cross-Provider comparison, sometimes not available in the price modeling proposals studied.
Acknowledgements
The research work on which we report in this article was supported by CAPES, CNPq, FAPERGS, and the internal Research Programme at UNIJUI University. First author is also thanks the Federal University of Fronteira Sul (UFFS) for the support to the development of his research.
References
Al-Roomi, M., Al-Ebrahim, S., Buqrais, S. and Ahmad, I. (2013). Cloud computing pricing models: a survey, International Journal of Grid and Distributed
Computing 6(5): 93–106. http://dx.doi.org/10. 14257/ijgdc.2013.6.5.09.
Alkhalil, A., Sahandi, R. and John, D. (2017). A decision process model to support migration to cloud computing, International Journal of Business
Information Systems24(1): 102–126.http://dx.doi. org/10.1504/IJBIS.2017.080948.
Amazon (2017). Amazon Web Services. Available at
https://aws.amazon.com/(Accessed 25 March 2017).
Chun, S.-H. and Choi, B.-S. (2014). Service models and pricing schemes for cloud computing, Cluster
Computing 17(2): 529–535. http://dx.doi.org/10. 1007/s10586-013-0296-1.
El Kihal, S., Schlereth, C. and Skiera, B. (2012). Price comparison for infrastructure-as-a-service,
Proceedings of the European Conference on Information Systems, AISeL, Barcelona, Spain, p. Paper
161. Available at https://www.researchgate.net/ publication/236151598 (Accessed 23 September
2016).
Frantz, R. Z., Corchuelo, R. and Roos-Frantz, F. (2016). On the design of a maintainable software development kit to implement integration solutions, Journal of Systems and Software 111(Supplement C): 89–104.
http://dx.doi.org/10.1016/j.jss.2015.08.044.
Google (2017). Google Cloud Plataform. Available at https://cloud.google.com/(Accessed 25 March
2017).
Hernández, I., Sawicki, S., Roos-Frantz, F. and Frantz, R. Z. (2015). Cloud configuration modelling: a literature review from an application integration deployment perspective, Procedia Computer Science 64: 977–983. http://dx.doi.org/10.1016/j.procs. 2015.08.616.
Hinz, M., Miers, C. C., Pillon, M. A. and Koslovski, G. P. (2016). A cost model for IaaS clouds based on virtual machine energy consumption, Proceedings
of the XII Brazilian Symposium on Information Systems, ACM, Florianópolis, Santa Catarina, Brazil, pp. 136– 143. Available athttps://dl.acm.org/citation.cfm? id=3021979(Accessed 23 September 2016).
Huang, J., Kauffman, R. J. and Ma, D. (2015). Pricing strategy for cloud computing: a damaged services perspective, Decision Support Systems 78: 80–92.
http://dx.doi.org/10.1016/j.dss.2014.11.001.
Marston, S., Li, Z., Bandyopadhyay, S., Zhang, J. and Ghalsasi, A. (2011). Cloud computing - the business perpective, Decision Support Systems 51(1): 176–189.
http://dx.doi.org/10.1016/j.dss.2010.12.006.
Mazrekaj, A., Shabani, I. and Sejdiu, B. (2016). Pricing schemes in cloud computing: an overview,
International Journal of Advanced Computer Science and Application7(2): 80–86. http://dx.doi.org/10. 14569/issn.2156-5570.
Menzel, M. and Ranjan, R. (2012). CloudGenius: decision support for web server cloud migration,
Proceedings of the 21th International Conference on World Wide Web, ACM, Lyon, France, pp. 979–988.
http://dx.doi.org/10.1145/2187836.2187967.
Microsoft (2017). Microsoft Azure. Available athttps: //azure.com/(Accessed 25 March 2017).
Mitropoulou, P., Filiopoulou, E., Michalakelis, C. and Nikolaidou, M. (2016). Pricing cloud IaaS services based on a hedonic price index, Computing 98(11): 1075–1089. http://dx.doi.org/10.1007/ s00607-016-0493-x.
Mitropoulou, P., Filiopoulou, E., Nikolaidou, M. and Michalakelis, C. (2017). Pricing IaaS: a hedonic price index approach, Proceedings of the
14th Conference on Economics of Grids, Clouds, Systems, and Services, Springer, Biarritz, France, pp. 18–29.
http://dx.doi.org/10.1007/978-3-319-68066-8_2.
Murthy, M. K. M., Sanjay, H. A. and Padmanabha, A. J. (2012). Pricing models and pricing schemes of IaaS providers: a comparison study, Proceedings of
the International Conference on Advances in Computing, Communications and Informatics, ACM, Chennai, India, pp. 143–147. http://dx.doi.org/10.1145/ 2345396.2345421.
Ouarnoughi, H., Boukhobza, J., Singhoff, F. and Rubini, S. (2016). A cost model for virtual machine storage in cloud IaaS context, Proceedings of the
24th Euromicro International Conference on Parallel, Distributed, and Network-Based Processing, IEEE, Heraklion, Greece, pp. 664–671. http://dx.doi. org/10.1109/PDP.2016.119.
Portella, G., Rodrigues, G. N., Nakano, E. and Melo, A. C. M. A. (2017). Statistical analysis of Amazon EC2 cloud pricing models, Concurrency and Computation:
Practice and Experiencepp. 1–16. http://dx.doi.org/ 10.1002/cpe.4451.
Singh, V. K. and Dutta, K. (2015). Dynamic price prediction for Amazon spot instances, Proceedings
of the 48th Hawaii International Conference on System Sciences, IEEE, Kauai, Hawaii, USA, pp. 1513–1520.
http://dx.doi.org/10.1109/HICSS.2015.184.
Soni, A. and Hasan, M. (2017). Pricing schemes in cloud computing: a review, International Journal
of Advanced Computer Research7(29): 60–70.http: //dx.doi.org/10.19101/IJACR.2017.729001.
Wang, Q., Tan, M. M., Tang, X. and Cai, W. (2017). Minimizing cost in IaaS clouds via scheduled instance reservation, Proceedings of the IEEE 37th
International Conference on Distributed Computing Systems, IEEE, Atlanta, Georgia, USA, pp. 1565–1574.
http://dx.doi.org/10.1109/ICDCS.2017.16.
Wonnacott, T. H. and Wonnacott, R. J. (1990).
Introductory Statistics for Business and Economics, 4 edn, John Wiley & Sons.