1
FUNDAÇÃO GETULIO VARGAS
ESCOLA DE PÓS-GRADUAÇÃO EM ECONOMIA
MESTRADO EM FINANÇAS E ECONOMIA EMPRESARIAL
Nilo Alves de Almeida Júnior
The Related Party Transaction in Brazilian Infrastructure PPPs
RIO DE JANEIRO
2018
2
The Related Party Transaction in Brazilian Infrastructure PPPs
Dissertação apresentada na Escola de
Pós-Graduação em Economia da Fundação Getúlio
Vargas como requisito parcial para obtenção do
Grau de Mestre em Finanças e Economia
Empresarial.
Orientador: Fernando Tavares Camacho
RIO DE JANEIRO
2018
5
AGRADECIMENTOS
À minha esposa pelo suporte incondicional a este projeto. Aos meus pais por propiciar
orientação e suporte para sempre buscar a melhor educação. Ao meu orientador, pelo
suporte constante, contribuições e paciência durante toda a elaboração deste trabalho.
Finalmente aos meus familiares e amigos pelo apoio.
6
RESUMO
Transações com parte relacionadas (RPT) é um problema recorrente na maioria das empresas com propriedade compartilhada porque, ao mesmo tempo que pode trazer uma redução significante dos custos de transação, por outro lado apresenta o risco de ser abusada causando perdas para os acionistas minoritários e credores.
A Parceria Público Privada (PPP) de infraestrutura, sendo um empreendimento em sociedade, está sujeito a este dilema e, devido à alavancagem proporcionada pelo Project Finance, há inclusive maiores incentivos ao comportamento oportunista.
Um exemplo recente, motivando a discussão, é o case da usina hidroelétrica Santo Antônio, que, com um orçamento inicial de R$ 12 bilhões, acabou custando um total de R$ 20 bilhões. O potencial de retorno imediato por expropriação dos custos majoritários, tipo aquisição e construção para o projeto, na maioria das vezes é extremamente superior à exposição do agente oportunista às perdas durante a futura operação da infraestrutura.
Neste trabalho é proposto um modelo microeconômico simples para explorar os incentivos subjacentes nos projetos de PPP com o objetivo de encontrar alternativas para mitigar o desalinhamento de incentivos causados por RPT’s nas PPPs.
Finalmente, a literatura pesquisada, em conjunto com o modelo proposto, são usados na comparação com dados empíricos mostrando forte evidência de efeitos negativos das RPTs. Em muitas PPPs no Brasil, a presença de grandes construtoras nas holdings dos seus controladores, aliada à pouca experiência dos agentes governamentais e deficiência de recursos na utilização do modelo PPP, criou um ambiente muito desfavorável ao sucesso desses projetos.
Palavras-chave: Parcerias Público-Privadas, PPP, Transações com Partes Relacionadas, RPT, Infraestrutura, Tunneling.
7
ABSTRACT
The Related Party Transaction (RPT) is a recurring issue in most shared ownership companies because, at the same time, it has the potential to bring significant reduction of transaction costs, on the other hand, presents many pitfalls of being abused to the loss of the minority shareholders and creditors.
The infrastructure Public Private Partnership (PPP), being a shared enterprise, is prone to this dilemma and, because project finance is extremely leveraged, there are even stronger incentives for opportunistic behavior.
As a recent example to motivate the discussion there is the case of Santo Antonio hydroelectric power generation facility, which had an initial budget of R$ 12 billion and ended up costing a grand total of R$ 20 billion.
The potential immediate returns of expropriation from major expenses, such as acquisition and construction for the project, most of the time, far outweighs the opportunist’s exposure to losses in the future operation of the infrastructure.
It is proposed a simple microeconomic model for exploring the underlying incentives of PPP projects to help devise options for mitigating the incentive misalignment of RPTs in PPPs. Finally, the literature and the proposed model findings are used to compare with empirical data which has showed strong evidence of negative RPT effects.
In many PPPs in Brazil, the presence of big construction firms in the controlling shareholders’ holdings, coupled with the government’s lack of experience and adequate resources to work with the PPP model, created a difficult environment for the financial success of those projects.
Keywords: Public-Private Partnerships, PPP, Related Party Transactions, RPT, Infrastructure, Tunneling.
8 Table of Contents
1 - Introduction ... 11
2 - Theory Review ... 13
2.1 - The Related Party Transaction ... 13
2.1.1 - Tunneling ... 13
2.1.2 - Increased efficiency... 15
2.2 - The Public-Private Partnership ... 17
2.3 – Tools to Reduce the Negative Outcomes of Related Party Transactions ... 18
2.3.1 – Internal Mechanisms ... 18 2.3.1.1 – Management incentive ... 18 2.3.1.2 – ... 19 Ownership Structure ... 19 2.3.1.3 – Corporate Transparency ... 19 2.3.1.4 – Leverage ... 20 2.3.2 – External Mechanisms ... 20
2.3.2.1 – Corporate Control Dispute ... 20
2.3.2.2 – Legal Environment ... 20
2.3.2.3 – ... 21
Market Development ... 21
3.1 – La Porta’s Corporate Expropriation Model ... 22
3.2 – The Modified Infrastructure PPP Model ... 24
3.3 – Improving PPP contract models ... 27
4 – Financial incentive analysis for Infrastructure PPPs ... 29
5 – Effect of shareholder structure in Infrastructure PPPs tunneling ... 31
5.1 – Scenario 1: One large shareholder with full control and presence of RPT ... 31
5.2 – Scenario 2: 2 or more large shareholders and presence of RPT ... 31
5.3 – Scenario 3: No presence of RTP ... 32
9
6.1 - The Power Transmission sector ... 33
6.1.2 – An empirical analysis of the tunneling effect in the power transmission sector .... 34
6.1.2.1 - Detailing the hypotheses tested in the empirical wok presented ... 34
6.1.2.2 – The findings of the empirical analysis of the work presented ... 37
6.1.3 – Analysis of the results of the presented empirical analysis in light of the proposed PPP model ... 39
6.2 - The Airport sector ... 40
6.2.1 – The Concessions Auditing ... 41
6.2.1.1 – Methods used for the auditing in the TCU report ... 44
6.2.1.2 – The TCU Findings on Tunneling in The Airport Contracts with RPT presence.. 47
6.2.2 – Analysis of the TCU Monitoring Report findings in light of the proposed PPP model ... 50
6.2.2.1 – Assumptions for the monitoring report analysis ... 50
6.2.2.2 – The SPE’s shareholder structure analysis and the controller’s financial exposure ... 51
6.2.2.2.1 – Shareholder structure for Brasilia SPE ... 51
6.2.2.2.2 – Shareholder structure for Guarulhos SPE ... 52
6.2.2.2.3 – Shareholder structure for Viracopos SPE ... 53
6.2.2.3 – The Expected Rate of Return ... 55
6.2.2.4 – The Shareholder Structure Analysis ... 58
6.2.2.5 – Unbalanced Profit Pool... 59
7 – Recommendations to Mitigate the RPT Problems in Brazil’s PPPs ... 60
7.1 – Analysis of the proposed PPP Infrastructure model ... 60
7.2 – Analysis of the corporate mechanisms from literature ... 60
7.2.1 – Internal Mechanisms ... 60
7.2.1.1 – Management incentive ... 60
7.2.1.2 – Shareholder structure ... 61
10
7.2.2 – External Mechanisms ... 61
7.2.2.1 – Corporate Control Dispute ... 62
7.2.2.2 – Legal Environment ... 62
7.2.2.3 – Market Development ... 62
References: ... 64
List of Figures Figure 1 – Controller Profit Pool ... 15
List of Tables Table 1 - Variables used in the model ... 36
Table 2 - Results of the model for hypothesis 1 test, RPT effect on expected returns ... 37
Table 3 - Results of the model for hypothesis 2 test, RPT effect on CAPEX ... 37
Table 4 - Results of the model for hypothesis 3 test, RPT effect on bid aggressiveness ... 38
Table 5 - Robustness test, RPT effect on the expected excess return given the cost of capital . 38 Table 6 - List of the airport SPEs ... 41
Table 7- Shareholder structure of the SPEs ... 41
Table 8 - Starting capital structure of the SPEs ... 45
Table 9 - Estimated Revenue Progression ... 46
Table 10 - Related Parties and the Initial Cost of the Contracts ... 47
Table 11 – The TCU Comparison of Sample Costs in Brasilia airport SPE ... 48
Table 12 – The TCU Comparison of Sample Costs in Guarulhos airport SPE ... 48
Table 13 – The TCU Comparison of Sample Costs in Viracopos airport SPE ... 49
Table 14 - Consolidated Comparison of Sample Costs ... 49
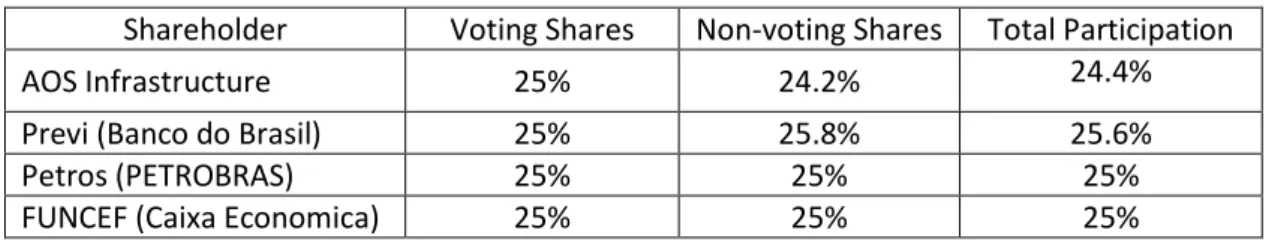
Table 15 - Invepar Shareholder Structure ... 52
Table 16 - Expected Rate of Return Comparison ... 56
11 1 - Introduction
In a shared ownership company, it is very common that one or more shareholders are able, and interested, in offering products and services demanded by the partially owned company. In a first approach, this might seem a win-win situation, as the shareholder sourcing the good should be interested in the success of the company it owns.
Also, having plenty access to the information about the company and the project, is in a strong position to offer the best deal possible.
The problem arises when the providing shareholder also has a measure of controlling power over the company.
It is possible to show that, any excess gain obtained in an expropriation, when appropriated by the providing shareholder at a higher rate than his exposure to the extra costs in the partially owned company, clearly creates a misalignment of incentives, which, compounded with control over the company, can lead to the abuse of the transaction terms.
This is an issue of deep concern because recurring abuse of transaction terms, without repercussion, can damage the development of capital markets for these projects.
The empirical work of La Porta et All (1997) involving 49 countries showed that poorer investor protection translates in smaller and narrower capital markets, applying both to equity and debt markets.
The lack of developed capital markets ends up demanding increased government involvement for finance and / or guaranteeing the investment, thus severely limiting future projects.
Despite the problems they might cause, there is a consensus that such transactions can be economically beneficial, warranting the investigation of methods to help avoid or mitigate the risks of potential abuse.
The PPP model, when applied to infrastructure, is especially prone to such problem. The huge volume of capital needed for acquiring or building the infrastructure, by far outweighs any other expense.
12
This creates strong incentives for big construction firms to engage in opportunistic behavior, maximizing their profits through the expropriation in the short term, and having little exposure to the negative effects on the long term.
13 2 - Theory Review
2.1 - The Related Party Transaction
Most of the countries adopt the IAS 24 which defines and identifies related party relationships and transactions for financial reporting purposes.
“A Related Party Transaction is a transfer of resources, services or obligations between a reporting entity and a related party, regardless of whether a price is charged (IAS 24).”
The literature points basically to three outcomes observed from related party transactions: Tunneling: Transfer of assets and profits out of firms for the benefit of their controlling shareholders.
Propping: The reverse of tunneling, where assets and profits are transferred to a firm for the benefit of a common controlling shareholder, usually with the objective of manipulating earnings.
Increased Efficiency: This is the positive effect, when the partner providing the service leverages his expertise in the field and the deeper knowledge of the needs of the shared company resulting in a win – win deal, reducing the transaction costs.
The scope of this work will focus on the investigation of tunneling versus increased efficiency, which is the more likely outcomes for infrastructure PPPs.
2.1.1 - Tunneling
It is the opportunistic behavior of a controlling shareholder to expropriate a shared company through a RPT by means such as: inflating contract prices above market and / or quantities over the necessary for the project, purchasing or selling assets at disadvantageous conditions, paying disproportionate salaries and bonuses and manipulating receivables of the related company. It is usually difficult to detect tunneling since it is hidden behind legitimate transactions, therefore, depending on the access to information, many times it is necessary to establish proxies to investigate its presence such as lower profitability and decrease in share value.
14
Expropriation through tunneling results mainly from the following incentives
Information asymmetry: One of the parties have more information or deeper knowledge about the project. This advantage at the hands of the controlling partner, allows the proposition of disadvantageous conditions or excessive quantities without challenge from the other parties thus favoring the opportunistic behavior.
Asymmetric Cashflow Control: When the controlling partner has a larger share of control over the company than his share of control over the free cashflow, he can capture the benefits of expropriation at a higher rate than his exposure to the shared company losses.
Revenue Uncertainty: The uncertainty of the future expected revenue increases the long-term risk, which impacts negatively its present value, thus, the greater the uncertainty, the more attractive the short term returns from the construction or acquisition. The uncertainty increases the incentive to engage in opportunistic behavior to increase the short-term revenue in detriment of the future revenue expectation.
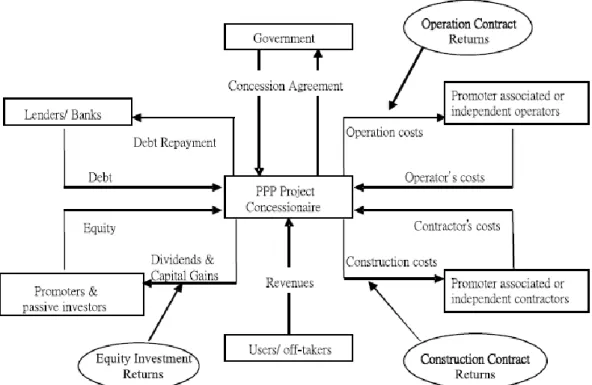
Unbalanced Profit Pool: Another factor that brings incentive to opportunistic behavior in PPP projects is the Unbalanced Profit Pool Syndrome (Ping Ho et al. 2015). This syndrome is defined comparing the potential returns of the various sources of revenue the controlling party can access in a PPP project.
In Figure 1 the possible sources of revenue for the controlling party are: equity investment returns, construction contracts and operation contracts.
The main cost in a traditional infrastructure PPP project, such as in logistics and energy sectors, is, by far, the construction contract. Compared to that, the operation contract is a very small fraction of the total costs, therefore the opportunities of revenue from contracts are greatly biased to the construction side.
Infrastructure PPPs being extremely leveraged due to the large amount of capital needed, limit the potential capital gains of the controller’s equity, thus those are also greatly dwarfed by the potential revenue from the construction contract.
This creates a very strong incentive to engage in opportunistic behavior during the execution of the construction contract, even if this hurts future profits from equity capital returns and operation contracts gains, as both are very small compared to the construction contract.
15
Figure 1 – Controller Profit Pool Souce: Ping Ho et al. 2015
2.1.2 - Increased efficiency
RPT can be effectively used to reduce the transactions costs (Leff 1978; Fisman and Khanna 2004) which might be accomplished by the alignment of interests to reach a common goal, less information asymmetry when celebrating contracts, greater expertise in the field required for the project and less risk of holdup problems due to specificity of assets.
One great example of both positive and negative outcomes of RPT can be found in the economic groups.
The economic group is a multi-company firm which transacts in different markets, but which does so under common entrepreneurial and financial control. (Leff 1978).
16
In this paper Leff (1978) the author argues that this type of organization enhances entrepreneurship by overcoming and even profiting from the various market failures found in less developed countries, with a balanced and diversified portfolio and vertical integration. These bring many advantages such as:
• Reducing overall risk for being able to offer a diversified set of products and services by operating in different industry sectors
• Secure primary factors, intermediate products and output channels in a small and closed market prone to monopolist domination and at the same time increasing margins when integrating the various companies’ operations
• Reducing transaction costs through effectively enforcing contract terms and property rights within the group (Fisman et al 2004). This is especially effective in an environment with poor rule of law found in most developing countries.
• Their size and potential influence allows them to take more risks than individual companies, which, combined with all other strengths, facilitate them to appropriate gains from overcoming government inefficiencies, market distortions and weak legislation thoroughly present in developing countries such as Brazil.
The operation integration and reduction of the transactions costs within the group, implies that RPT plays a very significant role in the efficiency gains obtained, therefore any attempt to restrain this type of transaction will reduce or even negate the benefits they can bring to any endeavor.
The PPPs projects are natural targets for such entities, which can bring significant efficiency gains, not only offering expertise, but also financing conditions, cost reduction through integration inside the same company and fulfilling government shortcomings in various areas. On the other hand, depending on the incentives, PPPs are also the perfect victim of expropriation through tunneling to the various companies inside the group which could provide most, or all services needed at disadvantageous conditions imposed by the controlling partner.
17 2.2 - The Public-Private Partnership
The Organization for Economic Co-operation and Development (OECD) defines aPublic-Private Partnership (PPP) as an agreement between the government and one or more private partners (which may include the operators and the financers). Within the agreement, the private partners deliver the service so that the service delivery objectives of the government are aligned with the profit objectives of the private partners. Furthermore, the effectiveness of the alignment depends on a sufficient transfer of risk to the private partners.
Among other objectives the PPPs reduce costs, improve service level and accelerate the deployment of new public infrastructure and services, by leveraging the efficiency of the private sector in its areas of expertise such as management, financing and procurement.
The main idea is to efficiently allocate each risk of the project to who bears the lowest cost to absorb or mitigate it, being either a shareholder, the government or outsourcing to a third party. The specificity of the assets in government infrastructure projects renders them unsuitable to serve as collateral, the solution is to use the cash flow of the project as the actionable guarantee for the investors.
This brings the Project Finance as the financing method of choice, because it structures the financial operations based on the risk of the project, instead of the assets or other collateral. This finance method requires the creation of a Special Purpose Entity (SPE) with the sole purpose of procure, build / acquire and operate one specific project. This brings more transparency for the imperatives and impacts of the financial decisions and eliminates any contamination from risks of other projects.
The SPE also brings these advantages, reducing the risks for the shareholders: • Non-recourse financing
• Off balance-sheet debt for the shareholders • Limited collateral damage in case of bankruptcy
18 • Large projects to offset the procurement costs • Stable demand to lower the revenue risk
• Mature technology to reduce the technological risk
As detailed above, several steps are taken to reduce the shareholders’ and investors’ risks, with the main goal of reducing the cost of capital and help making the project viable.
2.3 – Tools to Reduce the Negative Outcomes of Related Party Transactions
Good corporate governance practices can prevent tunneling by moderating the relation between the motives and the level of RPTs as evidenced in an empirical study of Yeh et all (2012) in the Taiwan market, which has a high level of control concentration.
By investigating propping up and tunneling in firms with different governance quality they showed that higher quality of governance reduced the RTP level and disciplined the reasons for RTP practices in favor of the firm.
The governance mechanisms are divided in two types as proposed by Denis & McConnell (2003), internal such as board of directors, management incentives, ownership structure and corporate transparency and external including corporate control dispute, legal environment, minority shareholders’ protection, market development and market competition.
2.3.1 – Internal Mechanisms 2.3.1.1 – Management incentive
One important condition to align interests is to have a good balance between the control over the firm and the control over the cash flow.
Any discrepancy towards more controlling power than cashflow control will ultimately create the incentive, for the controlling agent, to divert part of the resources towards the extraction of private benefits, maximizing his utility as shown in Jensen & Meckling (1976).
On the other hand, assuming this extraction generates, on the margin, less private gains, measured in monetary terms, than the aggregated loss in benefits incurred to extract them, as
19
proposed by Burkart et all (1998), the higher the stake the controller has in the firm, the greater his exposure to the inefficient allocation of resources caused by the expropriation.
In support of the theory, the empirical study of Gao & Kling (2008) in the corporate Chinese market, concluded that stock ownership was the second strongest deterrent of tunneling. therefore, the balance between level of control and number of owned voting shares can effectively help align the interests of the controlling party and the objectives of the company.
2.3.1.2 – Ownership Structure
A desirable ownership structure is composed of several block-holding shareholders competing for control, so none is able to fully control the firm, and all of them will have incentive and influence to oversee the management actions.
A single block-holding shareholder, even without guaranteed full control rights, can still have enough influence, over the management, to be able to obtain private benefits. This type of shareholder structure showed a negative effect in the Gao & Kling (2008) study confirming that it is prone to the tunneling practice.
Claessens et Al (2013) argues that ownership structures affect the nature of the agency problems, ranging from conflict of interests between shareholders and managers in diffuse ownership structure to minority-versus-controlling-shareholder in concentrated ownership structures. The rule in Brazil firms is very concentrated ownership, where investor protection matters most according to this finding.
2.3.1.3 – Corporate Transparency
An important tool for corporate transparency is regular auditing by independent agents together with a close monitoring of these audits by the interested parties. The desired result is to have Unqualified Audit Report, which means nothing material was found during the audit procedure. The effectiveness of this tool is reflected in Gao & Kling (2008) study where firms with unqualified audit reports showed the best results against tunneling practice.
20 2.3.1.4 – Leverage
The study of Gao & Kling (2008), found that highly leveraged firms were more prone to tunneling practice, but, unfortunately, the author does not propose a mechanism to explain this observation.
Nevertheless, this is a very concerning result because infrastructure PPPs need high financial leveraging, indicating that they might be prone to the same fragilities that affect the corporate firms with high leverage.
2.3.2 – External Mechanisms 2.3.2.1 – Corporate Control Dispute
The threat of control takeover due to poor firm performance and consequent loss of value is a strong incentive for both management and controller to avoid harming the firm through excessive private benefit extraction. Therefore, an environment that fosters reasonable conditions for control disputes is desirable as a deterrent for tunneling practice.
2.3.2.2 – Legal Environment
The level of investor protection by the legal system can influence both the concentration of control and the capital structure of the firms of a country (La Porta et all 2000).
Strong investor protection reduces the efficiency of the means to expropriate investors, thus diminishing the benefits of having full control over the firm. This translates to a lesser concentration of control in the firms due to the reduction of its potential value.
This protection will help have more leveraged firms as well. Because of the greater assurance to the capital investors of recouping their investment, with the expected gains, there would be greater offer and lower cost of financing capital.
On a final note, it is important to point out that the results of an empirical research in 49 countries conducted by La Porta et all (1998), examining the investor protection levels. The
21
study segmented the countries in 4 main legal families: Common-law, French-civil-law, Scandinavian-civil-law and German-civil-law.
The results showed that the French civil-law countries, which includes Brazil, offered the weakest legal protection to investors, behind German and Scandinavian civil-law, as intermediate and common-law countries, the strongest.
Regarding the quality of the enforcement again French civil-law countries was found to be the lowest, the common-law countries as intermediate and the strongest was found in Scandinavian and German-civil-law countries.
2.3.2.3 – Market Development
The literature shows evidence that mature markets are less prone to tunneling than the developing ones such as the result obtained by Gao, L. & Kling G. (2008) comparing, in the Chinese market, the firms with ADRs, which participate in more mature markets, to the ones without ADRs.
The development of the market could be fostered through the investment in the adoption of best practices, personnel training and incentives for the participation of foreign firms in the bids.
22 3 – A Microeconomic Model for PPP Expropriation
La Porta 2002 proposes a microeconomic model to analyze corporate expropriation.
Introducing some modifications, it is possible to address the fact that the expropriation in PPPs tends to happen during the infrastructure building, expansion and purchasing phases, when most of the capital investment is made.
3.1 – La Porta’s Corporate Expropriation Model
La Porta proposes a model where a controlling shareholder has cash flow or equity ownership α in the firm. The asymmetrical control may derive from shares with superior voting rights, constructing ownership pyramids, or controlling the board (La Porta et al. (1999a)). It is assumed that α is exogenously determined by the history and life cycle of the firm and also that the entrepreneur is the manager. In the case of professional management, separation of control from management does not stand in the way of many forms of expropriation. One example would be the controlling shareholder set up companies with which the firm deals on nonmarket terms, thereby benefitting himself personally, without actually serving as the chief executive officer.
The firm invests an amount of cash I in a project with the gross rate of return R. The firm has no costs, so the profits are RI. In this simple model, the scale of investment does not matter. Not all of the profits are distributed to shareholders on a pro rata basis. As a benefit of controlling the firm, the entrepreneur can divert a share s of the profits from the firm to himself, before he distributes the rest as dividends. This diversion or tunneling can take the form of salary, transfer pricing, subsidized personal loans, non-arms-length asset transactions, and, in some cases, outright theft.
In most countries, much of such diversion, short of theft, is legal, but requires costly transactions, such as setting up intermediary companies, taking legal risks, and so on (Burkart et al. (1998), Johnson et al. (2000)). Because of these costs, when the entrepreneur diverts a share
s of the profits, he only receives sRI – c(k,s)RI, where c(k,s) is the share of the profits that he
wastes when s is diverted. The c function is called cost-of-theft. Here k denotes the quality of shareholder protection; the better protected are the shareholders, the more has to be wasted to expropriate a given share of profits.
23
Formally, it is assumed that 𝑐𝑘> 0, 𝑐𝑠 > 0, 𝑐𝑠𝑠 > 0, and 𝑐𝑘𝑠 > 0. The first inequality means that
stealing is costlier in a more protective legal regime; the second means that the marginal cost of stealing is positive; the third means that the marginal cost of stealing rises as more is stolen; and the final—crucial—inequality means that the marginal cost of stealing is higher when investors are better protected. It is assumed that the cost c is borne by the entrepreneur rather than by all the shareholders, but this assumption does not affect the principal results.
Under these assumptions the entrepreneur total profit including the expropriation is:
(1) 𝛱 = ∝ (1 − 𝑠)𝑅𝐼 + 𝑠𝑅𝐼 − 𝑐(𝑘, 𝑠)𝑅𝐼
The solution for the optimal 𝑠 is independent of 𝑅𝐼, the scale of the firm, then the entrepreneur will maximize:
(2) 𝑈 = ∝ (1 − 𝑠) + 𝑠 − 𝑐(𝑘, 𝑠)
Hence as the first order condition La Porta obtained:
(3) 𝑐𝑠(𝑘, 𝑠) = 1 − ∝
This expression is the counterpart of the Jensen & Meckling (1976) condition for the consumption of perquisites by the entrepreneur. It states that the higher is the cashflow ownership by the entrepreneur, the greater are his incentives to distribute dividends in a proportional way rather than expropriate minority shareholders in a distortionary way, and hence the lower is the equilibrium level of expropriation for a given k. High cash-flow ownership reduces minority expropriation.
24
Differentiating the first order condition with respect to ∝ La Porta found:
(4) 𝑐𝑠𝑠(𝑘, 𝑠) 𝑑𝑠 𝑑 ∝= −1 (5) 𝑑𝑠 𝑑 ∝= − 1 𝑐𝑠𝑠(𝑘, 𝑠) < 0
This shows that a higher cash flow ownership (∝) helps reduce the incentives for expropriation.
3.2 – The Modified Infrastructure PPP Model
In the case of infrastructure PPP it is also possible to assume that α is exogenous to the process the same way proposed in the La Porta model.
On the other hand, the infrastructure PPPs are heavily leveraged through project financing and all debt is backed by strongly assured future revenue and government involvement, which sort of neutralizes the effect of increased premium to higher debt level. Therefore, assuming the controller has a participation in shares 𝑝 in the PPP equity which has total equity 𝐸 and a financing debt 𝐷, where 𝐸 + 𝐷 = 𝐼 (Total investment), the real cashflow ownership of the controller is:
(6) ∝ = 𝑝 𝐸 𝐸 + 𝐷
This clearly shows how the debt further dilutes the cashflow control of the controller or it could be interpreted as their financial exposure to the project.
At this point, it is important to examine the cash flow during the PPP lifecycle to better understand the incentives at play.
25
There are two distinct phases in the infrastructure PPP lifecycle, the build phase and the operation phase which show very different cashflow patterns.
The build phase, be it a new build, an expansion or extensive renovation, is where the majority of the expenses are located, providing the opportunity to divert the greatest amount of cash through inflating prices and / or volume.
During the rest of the PPP lifecycle the cashflow is basically expenses with O&M, which are very small compared to the build cost, and the rest of the cashflow is dedicated to the reimbursement of the financing parties.
This limits substantially the cash pool available to profit and diversion, demonstrating the full effect of the profit pool syndrome.
Therefore, the best opportunity for the PPP’s resource diversion would be tunneling through a related party transaction during the build phase, facilitated by the information asymmetry, the profit pool syndrome and compounded by the revenue uncertainty.
This means that the expropriation will occur before the actual revenue flow takes place, thus the capital diversion and its costs incur directly on the capital invested 𝐼, rather than on the revenue 𝑅𝐼.
Also, during the build phase, the agent has only a revenue expectation or an expected rate of return 𝑅𝑒, instead of the actual rate of return 𝑅, to decide on his actions. The expected rate of
return is the expected net present value of the project (𝔼(𝑁𝑃𝑉)) divided by the total investment (𝐼).
(7) 𝑅𝑒 =𝔼(𝑁𝑃𝑉) 𝐼
These differences bring some changes to the findings on corporate expropriation presented in La Porta’s work.
26
(8) 𝛱 = ∝ (1 − 𝑠)𝑅𝑒𝐼 + 𝑠𝐼 − 𝑐(𝑘, 𝑠)𝐼
The solution for the optimal 𝑠 is independent of 𝐼, the size of the project, then the agent will maximize:
(9) 𝑈 = ∝ (1 − 𝑠)𝑅𝑒+ 𝑠 − 𝑐(𝑘, 𝑠)
Hence as the first order condition for the PPP model we have:
(10) 𝑐𝑠(𝑘, 𝑠) = 1 − ∝ 𝑅𝑒
Here we have a glimpse that the return rate expectation (𝑅𝑒), which is assumed to be higher
than 1, might help compensate for the asymmetry between firm control and cash flow control. Differentiating the first order condition with respect to ∝ we have:
(11) 𝑐𝑠𝑠(𝑘, 𝑠) 𝑑𝑠 𝑑 ∝= −𝑅𝑒 (12) 𝑑𝑠 𝑑 ∝= − 𝑅𝑒 𝑐𝑠𝑠(𝑘, 𝑠) < 0
This implies that not only a higher cash flow ownership (∝), but also a higher rate of return expectation (𝑅𝑒), can help reduce the incentives for expropriation.
27 (13) 𝑑𝑠 𝑑𝑘= − 𝑐𝑘𝑠(𝑘, 𝑠) 𝑐𝑠𝑠(𝑘, 𝑠) < 0
Which indicates that the better the investor protection is, less likely is the expropriation. Once the build phase is complete, and the infrastructure PPP enters the operation phase, it is expected to behave as predicted in the original La Porta model:
(14) 𝛱 = ∝ (1 − 𝑠)𝑅𝐼 + 𝑠𝑅𝐼 − 𝑐(𝑘, 𝑠)𝑅𝐼
In this phase, although the cashflow is higher (𝑅𝐼 > 𝐼), most of the revenue will be used to pay the financial obligations, while the amount from which expropriation could be obtained would be the fraction used for O&M costs, where some information asymmetry could be exploited.
3.3 – Improving PPP contract models
Considering the findings of the model, we can devise the following strategies to improve the outcome in PPP projects regarding tunneling:
1 – Assure that the controlling partner have a significative financial exposure (∝): The ideal situation would be the perfect balance between participation and control. To attain this goal would require that equity and debt should be similar limiting leverage and thus posing a financial problem due to the high cost of equity capital. Another solution that might work, without the financing limitation, would be to have many independent parties with similar level of control over the PPP, this way they could effectively guard each other, thus limiting expropriation. This precludes the strong participation of the government or any other institution as a silent partner. Incentive from the government should come through facilitating the financing to reduce the cost of the capital.
28
2 – Ensure an attractive expected rate of return for the Project (𝑅𝑒): Although model indicates
that the increase of the expected rate of return (𝑅𝑒) helps reduce the level of expropriation (s),
this brings some concern regarding the cost of the service for the end users. Any revenue enhancement would come either from the tariff charged or tax resources through government subsidize.
Also, it is important to point out that the uncertainty introduced by the risks of demand and regulatory change, causes a negative effect to the expected return, penalizing this incentive. Therefore, having a consistent and stable regulatory environment will help reduce the incentive to expropriate and, while fully allocating the risk of demand to the private agent might not be the best overall solution, revenue associated to quality and availability of service and a bonus associated to demand might result in a better arrangement for incentive alignment.
3 – Have strong governance procedures in place (k): This demands experience from the institutions involved, access to independent auditing firms and a favorable and well developed legal environment, therefore, the effective implementation of an actionable governance structure might take some time in a new PPP environment and developing countries.
29 4 – Financial incentive analysis for Infrastructure PPPs
Infrastructure PPPs are highly leveraged and show strong effects of the unbalanced profit pool syndrome. Also, there is a low financial exposure (∝) of the controller, which results that, according to the model, it might not be feasible to financially align the incentives of a RTP transaction involving the controller and its partners in a corporate group.
Analyzing the equation (10) the first order condition:
𝑐𝑠(𝑘, 𝑠) = 1 − ∝ 𝑅𝑒
In order to minimize the controller’s optimum expropriation level when optimizing his revenue (𝑠∗→ 0), considering that c(k,s) = 0 when 𝑠 = 0 and 𝑐𝑠𝑠 > 0, it is necessary:
(15) ∝ 𝑅𝑒 → 1
A high enough rate of return (𝑅𝑒) could get the desired result but, unfortunately, the profile of
PPP project financing, long time for the return of the investment and strong assurance of the revenue, implies an expectation of lower risk premium and consequent a lower rate of return. Also, it is important to consider that the financial exposure of the controller (∝) is expected to be very low, further reducing the effect of the expected rate of return (𝑅𝑒).
This leaves only the cost of theft (𝑐𝑠(k,s)) to compensate for the unbalance created by the
financial leverage, which might prove insufficient or prohibitively costly to implement. In extreme cases it is even possible to have the following situation:
30
This would suggest that, even with the complete failure of the project and consequent total loss of the controller’s invested equity as well as expected gains, there would still be a positive result for the controller after all losses are accounted for.
Therefore, the agent would simply maximize:
(17) 𝑈 = 𝑠 − 𝑐(𝑘, 𝑠)
And seek the optimal level of the cost of theft
(18) 𝑐𝑠(𝑘, 𝑠) = 1
It is possible to imagine a real-world situation where, after a severe tunneling expropriation (𝑠𝐼), the financial balance of the project becomes very compromised, the controller presses for a renegotiation (increase 𝑅𝑒) to keep the project afloat and avoid losing the expected return (∝
𝑅𝑒𝐼).
Nevertheless, in the case of refusal, the controller can simply abandon the project with more profit than initially expected and, depending on the contract terms, might even recover a significant portion of the equity invested.
31
5 – Effect of shareholder structure in Infrastructure PPPs tunneling
The shareholder structure of the SPE can have a significant effect on the incentive to opportunistic behavior, this is an analysis of the expected effect of the structure based on the proposed PPP model.
5.1 – Scenario 1: One large shareholder with full control and presence of RPT
The basic structure for this scenario would be an infrastructure PPP with a single shareholder which is part of a corporate conglomerate with a construction arm. In this scenario the participation in the shares (𝑝) would be 100%, the controller would get the full benefits of the theft (𝑠𝐼) minus the expropriation cost (𝑐𝑠(𝑘, 𝑠)), but also have the full financial exposure (∝) of
the total equity invested. Even then, because of the high leverage of infrastructure PPPs which reduces the financial exposure (∝), there still might be a significative incentive to expropriate. The situation gets worse when the controller obtains full control with a reduced participation, such as 51% of the voting shares. This proportion can get even lower if either there are only other scattered minor shareholders or large silent partners owning a significant number of the remaining shares. The controller can expropriate without being significantly penalized by the losses from the negative effects on the company.
5.2 – Scenario 2: 2 or more large shareholders and presence of RPT
In this scenario it is considered that there are large non-controlling shareholders which have effective means of litigation and /or overcoming the controlling shareholder authority if necessary.
To expropriate, the controlling partner would be forced to share the spoils (𝑠 = 𝑠1 + 𝑠2 + ⋯ + 𝑠𝑛) and the basic cost of theft (𝑐(𝑘, 𝑠)) should remain the same as it only depends of the investor protection level (𝑘) and the amount diverted (𝑠). But an additional cost function should be considered (𝑐(𝑛)), with the same behavior of (𝑐(𝑘, 𝑠)), to account for the cost of the negotiation for the concerted opportunistic behavior and added risk of getting caught due to the multiple parties involved.
Therefore, clearly, on the margin, it is safe to assume there is a significant reduction of the overall profit from opportunistic behavior the more parties are involved.
32 5.3 – Scenario 3: No presence of RTP
Even in the case the controller is not part of a conglomerate with an infrastructure arm, there is still possibility of expropriation through an opportunistic association with a third party infrastructure firm.
This case brings a situation much like the scenario 2 with 𝑛 = 2, and all the same negative effects to the incentive to expropriate already detailed.
In short, the criteria to have the highest incentive for tunneling in the infrastructure PPP model would be:
• Least possible number of shares (𝑝) which still guarantee control, thus minimizing the financial exposure (∝).
• The highest leverage (𝐷) allowed, thus further reducing the financial exposure (∝). • The controller is part of a corporate group with a construction arm, thus minimizing
expropriation transaction costs (𝑐(𝑘, 𝑠)) through RPT.
Considering these findings, the model prediction is that, for highly leveraged PPPs, the use of RPT for the build phase of the infrastructure should be avoided if the controller is from a construction group.
On the other hand, PPPs that do not need high leverage, such as pure O&M and service PPPs, should be able to benefit from RTP lower transaction costs.
These cases would fit in the model proposed by La Porta for corporate expropriation. Since there would be no need of high leverage to finance the PPP project, the controller does not have their financial exposure (α) reduced by the leverage and there is no effect of the unbalanced profit pool syndrome from the build phase.
33 6 - Infrastructure PPP Contracts in Brazil
Since PPPs are a relatively new endeavor for the Brazilian government, there is a limited number of cases available for study, therefore it will be presented case studies with their findings in the power transmission and airport sectors and then the findings will be analyzed, comparing to the expectations of the PPP model proposed.
6.1 - The Power Transmission sector
Given Brazil’s continental size and having hydroelectric power as the main energy source, there is a necessity of a very robust and well interconnected power transmission system to support the demand with the necessary reliability.
Hydroelectric power plants are, more often than not, very far from the consumers requiring extensive power lines for energy transport. Also, to ensure a stable and reliable energy supply throughout the year, it is necessary a well interconnected transmission network to facilitate the balance of energy production and demand among the regions during drought seasons.
The project finance was the model of choice because these systems have suitable qualities such as large projects, stable demand, long lifecycle and mature technology.
The contracts encompass monthly inflation adjustment, tariff revision every five years and were tailored to match revenues to cost of capital, minimizing where possible the revenue risk. The winning criteria would be the lowest annual revenue proposal.
As infrastructure PPPs, these projects show all the characteristics that, In the presence of RPT, strong tunneling incentives are present: information asymmetry, low exposure to SPE losses and unbalanced profit pool.
This is the sector with the most SPEs in Brazil allowing for an empirical testing to investigate which is the dominant effect of RPT in infrastructure PPPs, expropriation or increased efficiency.
34
6.1.2 – An empirical analysis of the tunneling effect in the power transmission sector
In this section it will be presented the empirical work in the power transmission sector by Jalom (2016) and then the findings will be compared to the proposed PPP model’s expectations. The work presented tests a sample of 51 SPEs from the power transmission sector, where 23 of them had the controlling shareholder being part of a holding owning a construction firm. The work considers the existence of this association together with the confirmation of the construction firm’s participation in the build as presence of RTP in the SPE for the testing.
6.1.2.1 - Detailing the hypotheses tested in the empirical wok presented
Hypothesis 1: There is an effect on the expected return by the presence of a construction firm in the same economic group of the SPE controlling shareholder.
This was tested using the rate obtained dividing the expected revenue by the CAPEX. Therefore, higher returns would indicate an efficiency increase, while lower returns would indicate the presence of tunneling.
Hypothesis 2: There is an effect on CAPEX by the presence of a construction firm in the same economic group of the SPE controlling shareholder.
This was tested using the natural logarithm of the expected CAPEX. A higher CAPEX would indicate opportunistic behavior inflating costs to maximize the profit from construction, while a lower CAPEX would indicate lower build costs through higher efficiency
Hypothesis 3: The winning bid is more aggressive by the presence of a construction firm in the same economic group of the SPE controlling shareholder.
In the presence of tunneling, the controlling shareholder would compensate his lower SPE returns with a higher margin in the build phase.
In the higher efficiency scenario, the controlling shareholder would factor the build phase lower costs to help win the bid, without compromising the expected returns of the SPE.
This was tested using the rate obtained by the value of the winning bid (lowest wins), divided by the initial ceiling value. The lower the rate, the more aggressive the winning bid was.
35
Robustness test: The goal of this test was to verify the same results obtained with hypothesis 1, using data sourced from specialized teams from BNDES that followed up the projects closely. This was tested using a variable named “Expected excess return given the cost of capital”, which is the expected IRR minus the cost of capital (WACC).
The expected return rates were obtained from BNDES and the cost of capital from each of the contracts. The tax rate was considered 34% for all contracts.
For the comparison, the SPE auctions were divided in two groups, one group of auctions with controlling shareholders having a construction firm in the same economic group and another group of auctions with controlling shareholders which did not resort to RPT.
In all hypotheses it is expected the presence of both effects, tunneling and higher efficiency, the objective is determining which one is dominant in the sample.
It was also performed a robustness test based on the excess expected return given the cost of capital which basically is the IRR minus the WACC.
36 Table 1 - Variables used in the model
Variable Description
ID Variable of Interest
A “Related Party” Dummy variable = 1, if there is presence of RPT, or 0 if not.
Control Variables for the Financing
B “Leverage”
Value of initial debt (BNDES, debentures or other debts with banks), provided to finance projects, divided be the forecast investment.
C “BNDES interest” Mean spread of the BNDES financing rate (base rate + risk rate) to the TJLP.
D “Country Risk”
Country risk percentage, from the JP Morgan Embi+, 3 months before the concession auction of each Project
E “American RF”
Percentage of return of the American treasure 10 year bond, 3 months before the concession auction of each Project..
Control Variables for the Project
F “Extension” Number, in km, of the extension of the transmission line. 0 in the case of only substation project G “Auction Competition” Number of the proposing bidders.
H “Consortium” Dummy variable = 1, if the SPE has more than one shareholder, or 0 if there is only one shareholder. I “Norte e Pantanal” Dummy variable = 1, if the Project goes through
these regions, or 0 if not.
Control Variables for the Controlling Shareholders
J “Regional Scale Gains”
Number of projects won by the controlling shareholder, also as the controlling shareholder, of other power transmission concessions in the same geographic region (North, Northeast, Southeast, Center-west and South) since the auctions started by 1999.
K
“Rate investment / total revenue of the controlling
shareholder”
Total investment of the project / Total revenue of the controlling shareholder.
L “Size of the controlling
shareholder” Total assets of the controlling shareholder. Source: Jalom (2016)
37
6.1.2.2 – The findings of the empirical analysis of the work presented
Table 2 - Results of the model for hypothesis 1 test, RPT effect on expected returns
A B C D E F G J K L H 1 -0,01 0,09 *** -1,27 * -0,81 -0,41 * -6,2.e-6 * -2.10-3 *** -2.10-3 *** -3.10-3 -2,8.e-11 2 -0,01 0,08 *** -1,30 * -0,80 -0,54 ** -3.10-3 ** -3.10-3 ** -4.10-3 -2,3.e-11 -4.10-3 3 -0,01 0,09 *** -1,26 * -0,81 -0,40 * -6,5.e-6 ** -2.10-3 ** -2.10-3 ** -2,1.e-11 4 -0,01 0,09 *** -1,34 *** -0,81 ** -0,40 * -5,8.e-6 * -2.10-3 ** -2.10-3 **
A – Related party, B – Leverage, C – BNDES interest, D – Country risk, E – American RF, F – Extension, G – Auction competition, H – Consortium, J – Regional Scale gains, K – Rate investment / total revenue of the controlling shareholder, L – Size of the controlling shareholder
Source: Jalom (2016)
In Table 2, although the test result for the RPT parameter (A) showed no statistical significance, the author argues that it is not biased, therefore, the information about the negative signal is relevant.
This indicates that, the presence of a construction firm in the same group of the controlling shareholder, tends to reduce, on average, in the present sample, the expected revenues of the SPE.
It was found evidence of a stronger presence of tunneling than increased efficiency in the RPTs.
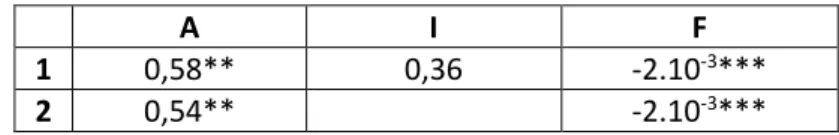
Table 3 - Results of the model for hypothesis 2 test, RPT effect on CAPEX
A I F
1 0,58** 0,36 -2.10-3***
2 0,54** -2.10-3***
A – Related party, F – Extension, I – Norte e Pantanal Source: Jalom (2016)
In Table 3 the results for the RPT parameter (A) are very clear, there is a statistical significance for the effect of the presence of a construction firm in the same group of the controlling shareholder.
38
The positive parameter shows an increase, on average, of the CAPEX in the presence of RPT, which shows evidence of a stronger tunneling effect than higher efficiency in the sample.
Table 4 - Results of the model for hypothesis 3 test, RPT effect on bid aggressiveness
A F G J K L H I
1 0,05 -2,0.e-5 0,05*** 4.10-3 0,13** 7,4.e-11* -0,09*
2 0,06 0,05*** 4.10-3 0,13** 8,2.e-11** 0,02 -0,1**
3 0,05 0,05*** 4.10-3 0,13*** 8,0.e-11* -0,1**
4 0,05 0,05*** 0,13*** 8,3.e-11* -0,1***
A – Related party, F – Extension, G – Auction competition, H – Consortium, I – Norte e Pantanal, J – Regional Scale gains, K – Rate investment / total revenue of the controlling shareholder, L – Size of the controlling shareholder Source: Jalom (2016)
In Table 4, although the test result of the RPT parameter (A) was positive, in line with the hypothesis reasoning for tunneling and high efficiency, it was not statistically significant. Therefore, it cannot be discarded the possibility of this parameter being actually zero.
Since the test of the effect of RPT on the bid aggressiveness showed no statistical significance and, at the same time, the test of the effect on the CAPEX showed a positive statistical significance, it is possible to determine that, the main route for the effect of RPT on the returns of the SPEs occurred in the build phase, through inflating the CAPEX.
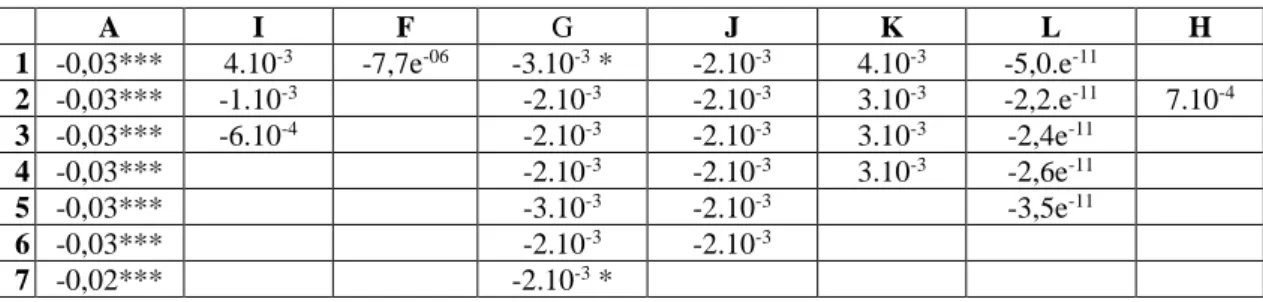
Table 5 - Robustness test, RPT effect on the expected excess return given the cost of capital
A I F G J K L H 1 -0,03*** 4.10-3 -7,7e-06 -3.10-3 * -2.10-3 4.10-3 -5,0.e-11 2 -0,03*** -1.10-3 -2.10-3 -2.10-3 3.10-3 -2,2.e-11 7.10-4 3 -0,03*** -6.10-4 -2.10-3 -2.10-3 3.10-3 -2,4e-11 4 -0,03*** -2.10-3 -2.10-3 3.10-3 -2,6e-11 5 -0,03*** -3.10-3 -2.10-3 -3,5e-11 6 -0,03*** -2.10-3 -2.10-3 7 -0,02*** -2.10-3 *
A – Related party, F – Extension, G – Auction competition, H – Consortium, J – Regional Scale gains, K – Rate investment / total revenue of the controlling shareholder, L – Size of the controlling shareholder
Source: Jalom (2016)
In Table 5, the RPT parameter (A) test resulted negative and statistically significant, showing its importance on the changes of the excess returns given the cost of capital.
39
6.1.3 – Analysis of the results of the presented empirical analysis in light of the proposed PPP model
The statistical test results analyzed are in line with the predictions of the proposed Infrastructure PPP model, highlighting that, in the findings, the presence of tunneling in the sample is most likely during the build phase of the PPP by inflating the CAPEX.
On the other hand, the test results of different approaches for RPT effect, which are not analyzed by the PPP model, such as aggressive bidding and excess returns, did not indicate any significant positive effect of higher efficiency resulting from the presence of RPT in the sample.
The evidence found in the sample shows clearly an overall negative effect of RPT in the power transmission infrastructure PPPs.
40 6.2 - The Airport sector
The airport sector in Brazil was challenged with a fast rise in demand from two main factors, that occurred in a short period time, the recent economic boom, rising people’s income, and the airlines increased competition, reducing the prices.
At the time all airports in Brazil were operated by a public company, INFRAERO, which had no condition to keep up, resulting in the airport infrastructure lacking scale to cope with the new level of demand.
The same suitable qualities for the use of the PPP model, seen in the power transmission sector, also apply to the case of the airport sector, large projects, a reasonably stable demand, as it is easier to substitute for other less expensive transportation modes, and mature enough technology, although it is more susceptible to disruption from innovations.
Presently, there are 9 international airports managed by SPEs: Governador Aluisio Alves (Sao Goncalo do Amarante - ASGA), Governador Andre Franco Montoro (Guarulhos), Tom Jobim (Rio de Janeiro - Galeão), Presidente Juscelino Kubitschek (Brasilia), Tancredo Neves (Confins), Viracopos (Campinas - Viracopos) Hercilio Luz (Florianopolis), Pinto Martins (Fortaleza), Deputado Luis Eduardo Magalhães (Salvador) and Salgado Filho (Porto Alegre).
These concessions were auctioned in three phases with different concession models and the details of each concession are listed in Table 6.
In the first phase of the PPP airport concession, the auction offered only ASGA international airport and, in the model adopted for this concession, all shareholders of its SPE were exclusively the winning private firms involved in the bid process.
In the second phase the auction included Brasilia, Guarulhos, Viracopos, Confins and Galeao airports, and the model was modified to accommodate the participation of the state-owned company of Airport Infrastructure (INFRAERO) with 49% of the share of the SPE and the winning private firms would divide the rest among them.
The justification for this new model was for the dividends from the SPE to make up for INFRAERO’s lost revenue from the airport operation and, by working with experienced airport management firms, bring INFRAERO up to date with the global best practices.
41
In the third phase the auction included Florianopolis, Fortaleza and Salvador airports, the concession model was modified again, and INFRAERO no longer participated as an SPE shareholder.
Table 6 - List of the airport SPEs
Airport Concessionaries Concession
Start Concession lifetime Sao Goncalo
do Amarante Inframerica 01/18/2012 28 years
Brasilia Inframerica 07/24/2012 25 years
Guarulhos GRU Airport 07/11/2012 20 years
Viracopos Aeroportos Brasil Viracopos 07/11/2012 30 years Galeao Aeroporto Rio de Janeiro S.A. 05/07/2014 25 years Confins Concessionária do Aeroporto
Internacional de Confins S.A. 05/07/2014 30 years Florianopolis Concessionária do Aeroporto
Internacional de Florianópolis S.A 07/28/2017 30 years
Fortaleza Fraport Brasil S.A. Aeroporto de
Fortaleza 07/28/2017 30 years
Salvador Concessionária do Aeroporto de
Salvador S.A. - CASSA 07/28/2017 30 years
Porto Alegre Fraport Brasil S.A. Aeroporto de
Porto Alegre 07/28/2017 25 years
Source: ANAC site (http://www.anac.gov.br/)
6.2.1 – The Concessions Auditing
Because of the significant financial involvement of INFRAERO in the SPEs of the second phase, as detailed in Table 7, the Tribunal de Contas da Uniao (TCU), a federal auditing institution, had the task of auditing the investment. All the findings were made public for thorough examination to guarantee government transparency; therefore, they are a very good source for detailed data on those PPPs.
Table 7- Shareholder structure of the SPEs
Airport SPE Shareholders Shareholder
Structure
42 Inframerica Aeroportos Private Shareholders (51%)
Infravix Participações S.A. (Engevix Group)
26.5% (50% of the private 51%) Corporacion America S.A.
26.5% (50% of the private 51%) Guarul hos Invepar - ACSA INFRAERO 49% Private Shareholders (51%) Invepar 45.9% (90% of the private 51%) Airports Company South Africa SOC
Limited (ACSA) 5.1% (10% of the private 51%) Viraco pos Aeroportos Brasil INFRAERO 49% Private Shareholders (51%)
TPI – Triunfo Participacoes e Investimentos S.A.
22.95% (45% of the private 51%) UTC Participações S.A.
22.95% (45% of the private 51%) Egis Airport Operation
5.1% (10% of the private 51%) Galeao Aeroportos do Futuro INFRAERO 49% Private Shareholders (51%) Odebrech Transport 30.6% (60% of the private 51%) Changi Airports International
20.4% (40% of the private 51%) Confins AeroBrasil INFRAERO 49% Private Shareholders (51%) CCR 38.25% (75% of the private 51%) Zurich Airport International AG
12.75% (25% of the private 51%) Source: TCU Monitoring Report TC 030.165/2014-8
The relevant contract conditions influencing RPT incentives in the second phase were: • INFRAERO was contractually barred to participate in the SPE management
• The board indication was proportional to the shares owned, therefore the private partners, as a group, had the majority of the board.
• INFRAERO was empowered with veto on any contract where RPTs were present and had the right to contract external independent audits on any contract before closing.
43
• INFRAERO would have 49% of the SPE shares and the airport operator, which should demonstrate extensive prior experience in airport management, would have a minimum of 5.1% (Sao Paulo Brasilia and Viracopos) or 12.75% (Galeao and Confins) of the SPE shares. This way, only up to 45.9% of the SPE shares were available to be divided among the remaining private shareholders, leaving INFRAERO as the single largest shareholder. • The risk of demand was entirely allocated to the shareholders and investors, there was
no clause for government help.
Evaluating the contract conditions in light of the findings in the literature:
The participation of the government in the SPE aggravated the already existing Unbalanced Profit Pool Syndrome, since it reduces further the private shareholders expected revenues from equity.
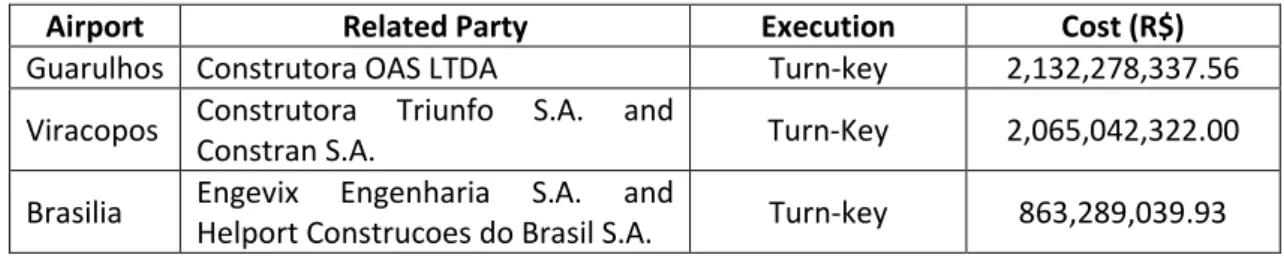
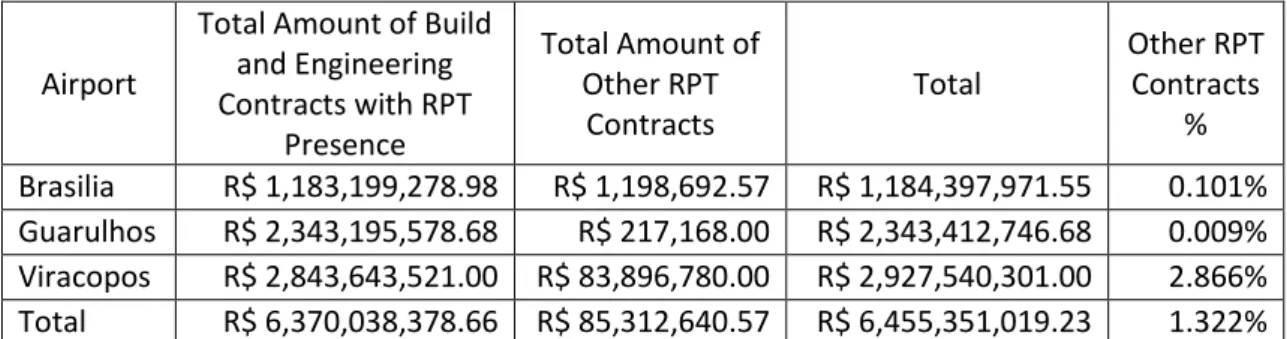
All SPEs had one or more private shareholders associated with construction firms (Table 8), and these construction firms were part of related party contracts for construction and engineering services, which, as expected in infrastructure projects, comprised most of the capital invested (Table 17)
In the presence of RPT the tunneling incentives in this case are: information asymmetry, low exposure to SPE failure (aggravated by the INFRAERO participation), unbalanced profit pool (aggravated by the INFRAERO participation) and a revenue uncertainty higher than the transmission sector due to the less stable demand.
On the other hand, the power of veto and right to external audit could level the playfield, empowering INFRAERO to circumvent any attempt to expropriate the SPE through either overpriced or overestimated RPT contract.
A preliminary operational TCU audit TC 009.780/2013, detected fragilities and lacking proper procedures in both the National Civil Aviation Agency (ANAC) and the INFRAERO management of the contracts and their execution. These findings originated the Directive 548/2014-TCU-Plenario to address the issues found and establish a closer monitoring of the contracts.
The results of the preliminary audit TC 009.780/2013 indicated INFRAERO was unable to use the power of veto and right to audits effectively. Also, it was found that the audit reports lacked the necessary details to assess whether the prices charged were within market parameters to
44
support INFRAERO decisions. It is important to state that no veto was issued by INFRAERO during the time monitored by the report.
The analysis of the airport sector will be based on the TCU monitoring report TC 030.165/2014-8 which is focused on items 9.4, 9.5 and 9.6 of the Directive 54030.165/2014-8/2014-TCU-Plenario.
The main attention will be on the results of the item 9.6.1 where the TCU demands from INFRAERO a conclusive analysis, detailed with all elements used for its substantiation, showing the related party transactions in Sao Paulo, Viracopos and Brasilia airport concessions, during the build phase, were contracted within market conditions.
Although there is also some information on the Galeao and Confins airports contracts, unfortunately, at the time, the TCU could not access the necessary data to include, in the report, a detailed evaluation of the RPTs contracted for those airports.
6.2.1.1 – Methods used for the auditing in the TCU report The general methods used in the audit were:
a) Document analysis b) Database searches
c) Reconciling between data and documentation
d) Comparative analysis of legislation, TCU case laws and doctrine e) Double check of presented calculations
45
Specifically, for the item of interest (9.6.1), there were also the following procedures:
a) Evaluation of the criteria used, by the contracted consultant, to elaborate the reports which substantiated the INFRAERO decisions.
b) Evaluation of the INFRAERO’s criteria and internal procedures used to decide whether to use its veto power.
c) Comparison between the contracted final prices with estimated parametric prices based in INFRAERO’s parameters and other airport builds.
d) Item prices obtained in some of the contracted consultants’ reports were compared to the National Civil Construction Database of Index and Prices (SINAPI) and specialized publications.
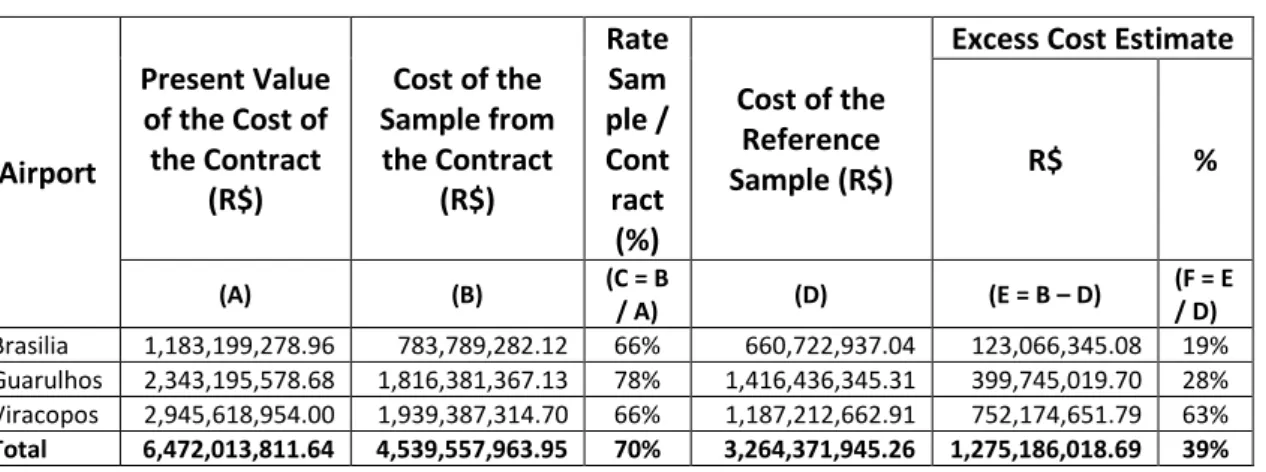
Because of the limited data obtained from the actual contracts, the TCU recognizes it is not possible to verify the effective overpricing, but, by comparing the realized costs with costs of similar airport builds, it is possible to evaluate the risk of overpricing in RPT contracts.
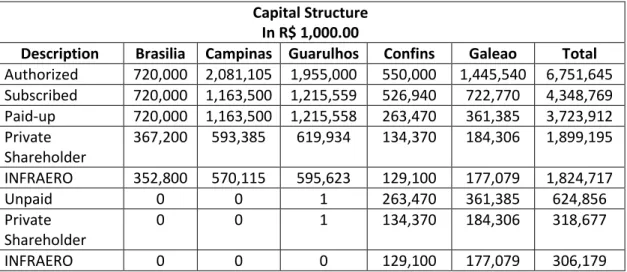
Table 8 - Starting capital structure of the SPEs
Capital Structure In R$ 1,000.00
Description Brasilia Campinas Guarulhos Confins Galeao Total Authorized 720,000 2,081,105 1,955,000 550,000 1,445,540 6,751,645 Subscribed 720,000 1,163,500 1,215,559 526,940 722,770 4,348,769 Paid-up 720,000 1,163,500 1,215,558 263,470 361,385 3,723,912 Private Shareholder 367,200 593,385 619,934 134,370 184,306 1,899,195 INFRAERO 352,800 570,115 595,623 129,100 177,079 1,824,717 Unpaid 0 0 1 263,470 361,385 624,856 Private Shareholder 0 0 1 134,370 184,306 318,677 INFRAERO 0 0 0 129,100 177,079 306,179 Source: INFRAERO