MARCELA RODRIGUEZ MELON
THE SOCIAL REPRESENTATION OF SUCCESS IN IT PROJECTS IN BRAZIL FROM THE IT PROFESSIONALS’ PERSPECTIVE
Rio de Janeiro 2016
MARCELA RODRIGUEZ MELON
THE SOCIAL REPRESENTATION OF SUCCESS IN IT PROJECTS IN
BRAZIL FROM THE IT PROFESSIONALS’ PERSPECTIVE
Master’s Research presented to the Executive Master’s in Business Administration from Brazilian School of Public and Business Administration (EBAPE), Fundação Getúlio Vargas.
Professor: Luiz Antonio Joia
Rio de Janeiro 2016
Ficha catalográfica elaborada pela Biblioteca Mario Henrique Simonsen/FGV
Rodriguez Melon, Marcela
The social representation of sucess in IT projects in Brazil from the IT professional’s perspective / Marcela Rodriguez Melon. – 2016
90 f.
Dissertação (mestrado) - Escola Brasileira de Administração Pública e de Empresas, Centro de Formação Acadêmica e Pesquisa.
Orientador: Luiz Antonio Joia. Inclui bibliografia.
1. Administração de projetos. 2. Tecnologia da informação. 3. Representações sociais. 4. Sucesso. I. Joia, Luiz Antonio. II. Escola Brasileira de Administração Pública e de Empresas. Centro de Formação Acadêmica e Pesquisa. III. Título. CDD – 658.404
I dedicate this thesis to my family, my husband Bernardo, my children Arthur and Alice, my mother Maria das Graças and my sister Flávia for the unconditional love, and also to my deceased father example of honesty and that I'm sure he would be proud of me.
ACKNOWLEGEMENTS
To my husband Bernardo that supported me throughout the path that I took in this masters to get here.
To my mother, Graça, that provided additional support over this hard way by carefully looking after my children.
To professor Luiz Antonio Joia for the knowledge that I have gained over this process and for the wise orientation.
To Gustavo Marchisotti and Alessandro Prudêncio for the support and insights. To FGV for the opportunity to be part of a very prestigious school.
To my colleagues in MEX-2015 for the shared knowledge, support and friendship. And to MEX’s teachers that contributed to my learning.
ABSTRACT
Different authors have proposed different criteria that should be considered to assess the success of Information Technology/Information Systems (IT/IS) projects. Through a review of the available literature concerning success criteria for IT/IS projects, this research identified that there is a clear trend over time to shift from the original budget, quality and time criteria to a larger set of criteria that involves not only those that are internal to the project but also external factors, such as impacts on the organization and people involved. This study aims to expose the perception of the Brazilian IT professionals about success in IT projects by using the word evocation technique and the Social Representation Theory (SRT). The data were empirically collected from 175 IT professionals through a web-based survey. The data was then processed on the software EVOC using the technique of the four quadrants from Vergès to identify the central nucleus and the peripheral system of the social representation of IT project success for the Brazilian IT professionals. The resultant data was then further analyzed and compared to the extant literature. As a result, the Brazilian IT professionals perceive the central core of the social representation of IT project success as formed by “Satisfaction” and “Scope”. The results show that while a considerably amount of IT professionals still consider Cost, Quality and Time as relevant factors for project success, due to the high frequency of evocation that these words had, they do not consider as the most important ones. This corroborates with the literature that points towards the evolution of the success criteria for IT projects. The results allow professionals and project managers to better prioritize the goals of their projects, by knowing how IT project success is recognized by the IT professionals in Brazil.
Keywords: Information Technology, Information System, IT project, success criteria, satisfaction, scope, triple constraint, Social Representation Theory, free evocation, central nucleus.
RESUMO
Diferentes autores propuseram diferentes critérios que devem ser considerados para avaliar o sucesso dos projetos de Tecnologia da Informação/Sistemas de Informação (TI/SI). Através de uma revisão da literatura disponível sobre critérios de sucesso para projetos de TI/SI, esta pesquisa identificou que há uma tendência clara ao longo do tempo em mudar do critério original de orçamento, qualidade e tempo para um conjunto maior de critérios que envolve não apenas aqueles internos ao projeto, mas também fatores externos, tais como impactos na organização e nas pessoas envolvidas. Este estudo tem como objetivo expor a percepção dos profissionais de TI brasileiros sobre o sucesso em projetos de TI, utilizando a técnica de evocação de palavras e a Teoria da Representação Social (TRS). Os dados foram empiricamente coletados de 175 profissionais de TI através de um questionário baseado na web. Os dados foram processados no software EVOC utilizando a técnica dos quatro quadrantes de Vergès para identificar o núcleo central e o sistema periférico da representação social do sucesso em projetos de TI do ponto de vista dos profissionais brasileiros de TI. Os dados resultantes foram posteriormente analisados e comparados com a literatura existente. Como resultado, os profissionais brasileiros de TI percebem o núcleo central da representação social de sucesso em projetos de TI como sendo composto por "Satisfação" e "Escopo". Os resultados mostram que, apesar de uma quantidade considerável de profissionais de TI ainda considerar Custo, Qualidade e Tempo como fatores relevantes para o sucesso do projeto, devido à alta frequência de evocação que essas palavras possuíram, eles não são considerados como os mais importantes. O que corrobora com a literatura que aponta uma evolução nos critérios de sucesso para projetos de TI. Os resultados permitem que profissionais e gerentes de projetos priorizem melhor os objetivos de seus projetos, de posse da informação de como o sucesso de um projeto de TI é reconhecido pelos profissionais de TI no Brasil.
Palavras-chave: Tecnologia da Informação, Sistema de Informação, projetos de TI, critérios de sucesso, satisfação, escopo, restrição tripla, Teoria da Representação Social, evocação livre, núcleo central.
LIST OF FIGURES
FIGURE 1-PROJECT SUCCESS CRITERIA (MARNEWICK,2012, P.327) ... 13
FIGURE 2-THE IRON TRIANGLE (ATKINSON,1999, P.338) ... 19
FIGURE 3-LIST OF SUCCESS CRITERIA (WATERIDGE,1998, P.61) ... 21
FIGURE 4-THE SQUARE ROUTE (ATKINSON,1999, P.341) ... 22
FIGURE 5-IMPORTANCE GIVEN TO COST,TIME AND SCOPE (AGARWAL AND RATHOD,2006, P. 364) ... 23
FIGURE 6-SUCCESS CRITERIA OTHER THAT COST,TIME AND SCOPE (AGARWAL AND RATHOD, 2006, P.367) ... 24
FIGURE 7-LIST OF SUCCESS CRITERIA BY CATEGORY (THOMAS AND FERNÁNDEZ,2008, P.736) ... 25
FIGURE 8-MULTI-DOMAIN PROJECT SUCCESS FRAMEWORK (BANNERMAN AND THOROGOOD, 2012, P.4879) ... 26
FIGURE 9-DOMAIN SURVEY DESCRIPTIONS AND EMPIRICAL INDICATORS (BANNERMAN AND THOROGOOD,2012, P.4879) ... 27
FIGURE 10-DOMAIN SUMMARY DESCRIPTIONS AND EMPIRICAL INDICATORS (IKA,2009, P.11) ... 28
FIGURE 11-VERGÈS QUADRANTS ... 37
FIGURE 12-DATA PREPARATION STEPS ... 37
FIGURE 13-EVOC2000 MAIN INTERFACE ... 38
FIGURE 14-CHART FOR GROUP SIZES OF THE COMPANIES ... 43
FIGURE 15-FLOW TO DETERMINE FINAL SET OF WORDS ... 49
FIGURE 16-CHART FOR GENDER DISTRIBUTION ... 86
FIGURE 17-CHART FOR AGE GROUP DISTRIBUTION ... 86
FIGURE 18-CHART FOR EXPERIENCE IN IT PROJECTS ... 87
FIGURE 19-CHART FOR TYPE OF COMPANIES ... 87
FIGURE 20-CHART OF TYPE OF EMPLOYEE'S CONTRACTS ... 88
LIST OF TABLES
TABLE 1-SUMMARY OF PRIOR RESEARCH ON ITPROJECT SUCCESS CRITERIA ... 19
TABLE 2-CHARACTERISTICS OF THE CENTRAL NUCLEUS AND THE PERIPHERAL SYSTEM IN A SOCIAL REPRESENTATION ... 31
TABLE 3-SUMMARY OF VERGÈS'QUADRANTS ... 36
TABLE 4-DISTRIBUTION OF RESPONDENTS PER REGION AND STATE IN BRAZIL ... 43
TABLE 5-DISTRIBUTION OF FREQUENCY ... 46
TABLE 6-PREMISES USED BY EVOC ... 48
TABLE 7-DISTRIBUTION OF THE EVOCATED WORDS IN VERGÈS' FOUR QUADRANTS FRAME ... 48
TABLE 8-FINAL LIST OF WORDS IN THE FOUR QUADRANTS FRAME ... 49
TABLE 9-INFERRED CATEGORY FOR SATISFACTION FROM THE CN ... 51
TABLE 10-INFERRED CATEGORY FOR SCOPE FROM THE CN ... 52
TABLE 11-COMPARISON OF DEMOGRAPHIC DATA OF THREE GROUPS ... 54
TABLE 12-TOTAL EVOCATED WORDS (TRANSLATED FROM PORTUGUESE) ... 75
TABLE 13-CONVERTED WORDS (IN THE ORIGINAL LANGUAGE:PORTUGUESE) ... 79
TABLE 14-LEVEL OF EDUCATION DISTRIBUTION ... 88
LIST OF SYMBOLS, ABBREVIATIONS AND ACRONYMS AEO Average Evocation Order
AFE Average Frequency of Evocation
AM Amazonas
AP Amapá
APM Association for Project Management
BA Bahia
BTW Between
CC Central Core
CE Ceará
CLT Consolidação das Leis do Trabalho (Consolidation of Labor Laws) CN Central Nucleus
CSF Critical success factors DF Distrito Federal
ES Espírito Santo
EVOC Ensemble de programmes permettant l’analyse des evocations (Set of programs for analyzing evocations)
ILL International Institute for Learning IT Information Technology
IT/IS Information Technology/Information Systems KPI Key Performance Indicator
MA Maranhão MG Minas Gerais MS Mato Grosso do Sul
P2M Program and Project Management for Enterprise Innovation
PA Pará
PB Paraíba PE Pernambuco
PI Piauí
PJ Pessoa Jurídica (Legal Entity or Legal Person) PM Project Management
PMAJ Project Management Association of Japan PMBOK Project Management Book of Knowledge PMI Project Management Institute
PR Paraná
RJ Rio de Janeiro RO Rondônia
RS Rio Grande do Sul SC Santa Catarina SP São Paulo
SR Social Representation
SRT Social Representation Theory TO Tocantins
UK United Kingdom
TABLE OF CONTENTS
1 INTRODUCTION ... 12
1.1 STATEMENT OF THE RESEARCH PROBLEM ... 14
1.2 OBJECTIVES AND DELIMITATIONS ... 14
1.3 STRUCTURE OF THE THESIS ... 15
2 LITERATURE REVIEW ... 16
2.1 KEY TERMS ... 17
2.1.1 Project Management ... 17
2.1.2 Project Controls ... 17
2.1.3 Key Performance Indicators (KPI) ... 18
2.1.4 Project Success in General ... 18
2.2 ITPROJECT SUCCESS ... 18
2.3 SOCIAL REPRESENTATION THEORY (SRT) ... 29
2.3.1 Definition of the Social Representation Theory (SRT) ... 29
2.3.2 Central Nucleus Approach to Social Representations ... 29
3 RESEARCH METHODOLOGY ... 32
3.1 POPULATION AND SAMPLE ... 33
3.2 DATA COLLECTION ... 34
3.3 DATA PREPARATION ... 35
4 DATA ANALYSIS AND RESULTS ... 41
4.1 SAMPLE ANALYSIS ... 41
4.2 CENTRAL NUCLEUS AND PERIPHERAL SYSTEM OF THE SOCIAL REPRESENTATION ... 44
4.3 WORD EVOCATION RESULTS ... 48
4.4 LEXICAL AND CONTENT ANALYSES ... 50
4.5 DEMOGRAPHIC ANALYSIS OF RESPONSES ... 53
5 DISCUSSION ... 55
6 CONCLUSION ... 58
6.1 ACADEMIC AND MANAGERIAL IMPLICATIONS ... 59
6.2 LIMITATIONS OF THE STUDY ... 60
6.3 RECOMMENDATIONS FOR FUTURE RESEARCH ... 61
7 REFERENCES ... 63
APPENDIX ... 68
APPENDIXI–RESEARCH QUESTIONNAIRE ... 68
APPENDIXII–COMPLETE LIST OF EVOCATED WORDS USED IN THIS STUDY ... 75
APPENDIXIII–CATEGORIZATION TABLE FOR THE EVOCATED WORDS ... 79
APPENDIXIV–DEMOGRAPHIC DATA OF THE SAMPLE ... 86
1 Introduction
It was back in the fifties that the project management tools and techniques were first used by companies to manage complex engineering projects (Young-Hoon, 2005). Before that, projects were managed using informal techniques and tools.
In the middle of the 20th century, project management was recognized as a new discipline (Cleland and Gareis, 2006) and since then, different methodologies have been used for project management. According to PMI (pmi.org), a renowned not-for-profit international professional membership association, project management “is the application of knowledge, skills, tools, and techniques to project activities to meet the project requirements”1. Independently of methodologies, the project management discipline is constituted by a group of processes (PMI, 2010).
An essential concern of the project management discipline is to assess whether a project succeed or failed. But, what is a project’s success?
So far, there is neither consensus on the definition of success in projects in general nor in IT/IS projects. This subject continues to be a central concern in the scientific community. Authors have different points of view when defining success in projects. For Baker, Murphy and Fisher (1974), there is no “absolute success” in project management, there is only the “perceived success of a project”, which leads to the fact that the concept of success might also be dependent on individual’s perception.
Cambridge Dictionary defines success as “the achieving of desired results, or someone or something that achieves positive results”2. But what defines project success? There is plenty of available literature concerning this topic, but the concept is still ambiguous and remains very broad (Wateridge, 1998; Atkinson, 1999; Agarwal and Rathod, 2006; Thomas and Fernández, 2008; Marnewick, 2012; Bannerman and Thorogood, 2012; Ika, 2009).
1
pmi.org. Available in: http://www.pmi.org/About-Us/About-Us-What-is-Project-Management.aspx. Retrieved on: 29/march/2016
2
Cambridge Dictionary. http://dictionary.cambridge.org/us/dictionary/american-english/success. Retrieved on 09/july/2015.
Going further, De Wit (1988) suggested a distinction between project success and project management success. Munns and Bjeirmi (1996) corroborates with this approach by pointing that the project management objectives differ from project objectives. For example, a project management objective can be related to delivering results on time, on budget and with the required quality, whereas the project success can also involve the customers’ acceptance.
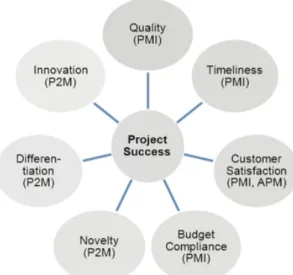
Figure 1 represents a summary of the success criteria of the three major project management standards and methodologies, namely: PMI – Project Management Institute; APM – Association for Project Management; and PMAJ – Project Management Association of Japan, with its standard guide book: Program and Project Management for Enterprise Innovation (P2M). It is noticeable that project success should not be measured by applying just the classical criteria that focus on budget, time, and quality – often referred to as the Iron Triangle (Atkinson, 1999). It should also consider other factors as relevant influencers of success.
Figure 1 - Project success criteria (Marnewick, 2012, p. 327)
With that in mind, this study intend to use the Social Representation Theory (SRT) to identify the core and peripheral systems associated with the social representation of IT project success (Novikoff and Neiva, 2005), as well as ascertain how IT professionals in Brazil perceive success in IT/IS projects.
1.1 Statement of the Research Problem
This paper aims to identify the social representation of “Success in IT Projects” in Brazil from the IT professionals’ perspective by answering the following question: “What is the social representation of success in IT projects in Brazil from the IT professionals’ perspective?”
1.2 Objectives and Delimitations
The main goal of this thesis is to identify how IT professionals perceive success in IT projects by using the Social Representation Theory (SRT).
In order to achieve the proposed goal, this study intends to:
i) Understand the concept of success in IT/IS Projects;
ii) Apply the Social Representation Theory (SRT), as well as how the software EVOC works, in order to duly identify the “Success in IT Projects” social representation.
The scope of this work is limited to IT/IS projects and the respondents should be IT professionals that have worked in IT/IS projects for at least one year, to guarantee a minimum experience in projects.
The increasing demand for IT in companies and the increasing demand for project management professionals in IT (Rockart and Short, 2012) support the importance of this study. Another relevant factor supporting the development of this study is the increasing adoption of project management tools in organizations for reaching its goals, and the direct relationship between project performance with business performance (Crawford, 2005). Besides IT has had not only a technical role in the organizations anymore, it has become to be an important aspect for companies business development (Peppard, Edwards and Lambert, 2011).
As such, the relevance of this study is in identifying how IT professionals perceive success in order to be able to better understand how that perception impacts the actual performance of executed projects maximizing thus business performance.
1.3 Structure of the Thesis
This thesis comprises six chapters including this introduction. The introductory chapter discusses in general the “success in IT projects” concept. It also describes the main objective of this thesis and the delimitations of the study.
Chapter 2 addresses the literature review concerning success in IT projects and defines the Social Representation Theory (SRT) and some Project Management concepts. The 3rd chapter presents the methodological approach. The 4th chapter presents the data analysis and the results achieved.
Going further from it, chapter 5 discusses the findings comparing them with the related literature. The conclusion of this study is presented in chapter 6, as the limitations of the research, implications to the academic and managerial fields and suggestions for future studies.
Additionally, it will end with the references that were used to support this thesis followed by some support material in the appendixes.
2 Literature Review
This chapter presents the necessary literature review to address the goal of this study. It is divided in three sections: the first one presents the definition of some key terms that are used in the study, the second one covers the success criteria for IT projects definition and the third one discusses the Social Representation Theory (SRT) in order to better understand this concept used in this study.
The literature review concerning success in IT projects covers articles concerning success criteria for IT projects. Its purpose is to identify, consolidate and summarize extant research that may provide complementary or divergent views on the definition of success on IT projects.
The search was focused on the literature available in academic journals such as International Journal of Project Management and ACM Digital Library due to their relevance to the academic community. The keywords used to search the literature include: project management, IT project management, project performance, project success, project success criteria, project success definition, project success measure, project controls, IT controls, monitoring, controlling, key performance indicators and KPIs.
The search also considered relevant books concerning Project Management including publications from Harold Kerzner, a Senior Executive Director for Project Management for the International Institute for Learning (IIL) and a Ph.D. in Aeronautical and Astronautical Engineering from the University of Illinois, and the Project Management Book of Knowledge (PMBOK), a reference guide in the project management field, published by PMI.
The research tried to select articles for review from disperse geographical locations and publications distributed over time, in order to analyze whether these variables might influence the criteria used for IT project success.
The selected publications covered various perspectives on defining success criteria for IT projects.
2.1 Key Terms
2.1.1 Project Management
Project Management (PM) was recognized as a knowledge field just as operations, information technology or marketing (Kenny, 2003), been extensively used by organizations in order to increase their productivity (Frame, 1995).
Oisen (1971, p. 12) have defined the project management discipline as:
Project Management is the application of a collection of tools and techniques (such as the CPM and matrix organization) to direct the use of diverse resources toward the accomplishment of a unique, complex, one-time task within time, cost and quality constraints. Each task requires a particular mix of theses tools and techniques structured to fit the task environment and life cycle (from conception to completion) of the task.
The British Standard (2010, p. 5) for project management defined it as:
The planning, monitoring and control of all aspects of a project and the motivation of all those involved in it to achieve the project objectives on time and to the specified cost, quality and performance.
The UK Association of Project Management (APM, 1995, p.15) developed the UK Body of Knowledge (UK BoK), which described project management as:
The planning, organization, monitoring and control of all aspects of a project and the motivation of all involved to achieve the project objectives safely and within agreed time, cost and performance criteria. The project manager is the single point of responsibility for achieving this.
It is noticeable that the definitions of project management along the years commonly refer to the project’s goal, and in-as-such its success, as to deliver the objectives on time, within budget and according to the required specifications.
2.1.2 Project Controls
For monitoring and controlling a project’s execution, a project manager needs to define the metrics or the Key Performance Indicators (KPIs) that will be used to monitor the project’s progress. Metrics management is an important process within the project management discipline, although many of these metrics are often ignored, as they are hard to define and therefore measure. Yet, without metrics the focus tends to be more on reactive rather than proactive management (Kerzner, 2013).
2.1.3 Key Performance Indicators (KPI)
According to Eckerson (2006, p. 294) “A KPI is a metric measuring how well the organization or an individual performs an operational, tactical or strategic activity that is critical for the current and future success of the organization.” Although Eckerson’s (2006) definition is more applicable to business, it can also be expanded to projects, since KPIs are used to measure how well a project is progressing toward its goals.
2.1.4 Project Success in General
The concept of project success in general is not easy to define since there isn’t a consensus on the definition of the success criteria in projects.
Cooke-Davies (2002) states that project success is measured against overall objectives of the project, rather than being measured via time, cost and quality.
According to Myers (1994) success in IT/IS projects is achieved when an information system is perceived to be successful by stakeholders.
Wateridge (1998) concludes that the success criteria of a project should be defined prior to project’s start, in order that project managers can plan accordingly to deliver that criteria by considering the appropriate factors.
More recently, Thomas and Fernández (2008) reinforced the findings of Wateridge (1998) finding that companies that clearly define success, and effectively measure success, improve the IT project outcomes and have a greater chance of achieving success in their IT projects.
2.2 IT Project Success
The classical view of project management (PM) indicates that the criteria for a project’s success are related to meeting budget, time and quality. As seen in section 2.1.1, the definition of PM itself is usually related to the achievement of planned cost, schedule and quality as a measure of success. These criteria for measuring the project’s success are referred to as The Iron Triangle (Figure 2) (Atkinson, 1999).
In one hand, some studies support the concept of The Iron Triangle, that is, a project’s success is anchored in an one-dimensional construct solely concerned with meeting budget, time and quality (Brown and Adams, 2000; Bryde, 2008; Fortune et. al, 2011; Muller and Turner, 2007; Turner, 2009).
Figure 2 - The Iron Triangle (Atkinson, 1999, p. 338)
On the other hand, there are authors (Thomas and Fernández, 2008; Bannerman and Thorogood, 2012) who consider project’s success as a complex, multi-dimensional concept involving many other factors. Table 1 below summarizes the analysis of selected studies focused on the success in IT/IS projects.
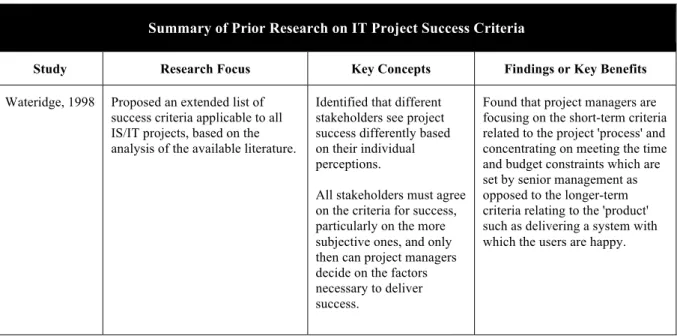
Table 1 - Summary of Prior Research on IT Project Success Criteria
Summary of Prior Research on IT Project Success Criteria
Study Research Focus Key Concepts Findings or Key Benefits
Wateridge, 1998 Proposed an extended list of success criteria applicable to all IS/IT projects, based on the analysis of the available literature.
Identified that different stakeholders see project success differently based on their individual perceptions.
All stakeholders must agree on the criteria for success, particularly on the more subjective ones, and only then can project managers decide on the factors necessary to deliver success.
Found that project managers are focusing on the short-term criteria related to the project 'process' and concentrating on meeting the time and budget constraints which are set by senior management as opposed to the longer-term criteria relating to the 'product' such as delivering a system with which the users are happy.
Study Research Focus Key Concepts Findings or Key Benefits
Atkinson, 1999 Proposed a new framework, The Square Route, that extends the Iron Triangle to include other success criteria for IT/IS projects.
Still considered the “Iron Triangle” as one of its success criteria, but also included criteria that focus on the technical strength of the system, the benefits to the organization (direct benefits) and the benefits to a wider stakeholder community (indirect benefits).
The Square Route is trying to prevent Type II error (i.e., things not done as well as they could be or things not previously considered) in PM by extending the Iron Triangle to a more balanced indication of success.
Agarwal and
Rathod, 2006 Exploratory study that evaluated the success priority, between time, cost and scope among internal project’s team members in 12 Indian software organizations.
Internal stakeholders to project agree that meeting the ‘scope’ of software projects, which comprises the functionality and quality of the project outcome, as the highest determinant of success.
All the 105 software professionals unanimously chosen scope as the most important criterion in defining the software project success.
Cost was considered the least important criterion, even for the Customer Account Managers interviewed, which are more inclined to have a market view. Thomas and
Fernández, 2008
Performed an exploratory study with 36 companies on how they measure the success of their IT projects and than identified three effective practices: (1) an agreed definition of success, (2) consistent measurement, and (3) the use of results.
Grouped success in three categories: project management success, technical success and business success. Considered between 2-11 success criteria that usually belong to a unique category, although customer and stakeholder satisfaction were considered in two categories (Figure 7).
Results have explained in practice how project success is defined and highlighted success criteria rarely considered in the literature: sponsor satisfaction, business continuity, project team satisfaction, and steering group satisfaction.
Marnewick, 2012
Practical longitudinal research to understand the success rates and success factors of information and communication technology (ICT) projects in South Africa.
Companies are measuring success differently than they were in the past; they are progressing from the original triple constraint to more business-related criteria.
In 2003, success was defined as compliance to the Iron Triangle and, although in the 2008 and 2011 studies the Iron Triangle was still a relevant factor for success, other criteria, such as user satisfaction, meet project requirements and benefits of the project and/or service, gained relevance as success markers. Bannerman and
Thorogood, 2012
Proposed a multi-domain framework for defining information technology (IT) project success.
The model extends the criteria available on literature focusing on what different stakeholders perceive as important. The framework contains five domains of success: process, project management, product, business and strategic.
Domains are totally independent and each one can be measured at different times. This leads to the fact that a project can fail in one domain but still succeed in another.
In 1998, Wateridge (1998) performed a study to better understand the success criteria for IT/IS projects. By reviewing the extant literature on success criteria, the author extended the common assessment that successful IT projects are the ones that are delivered on time, budget and within the required specifications, to a much wider view of success criteria as shown in Figure 3. After putting together these criteria, the author tested the concept through an empirical research interviewing 132 different stakeholders to gather their perceptions of success in projects that were carried out between 1992 and 1994.
Figure 3 - List of success criteria (Wateridge, 1998, p. 61)
The study revealed that budget, schedule and user requirements are still very important in defining the success of IS/IT projects, but it also revealed that other proposed criteria, as shown in Figure 3, are also important drivers of success and showed how these criteria are considered differently among the stakeholders. For example, both users and project managers agree that meeting user requirements is a very important criteria, but besides this, whereas users care more about being happy and the project achieves its purpose, while project managers think that being on time and budget are the most important indicators of a project’s success. At the end, the research confirmed that the success criteria proposed by Wateridge (1998) are appropriate to all IT/IS Projects, yet for a better management of success, it is essential that these criteria should be agreed in advance among all projects stakeholders.
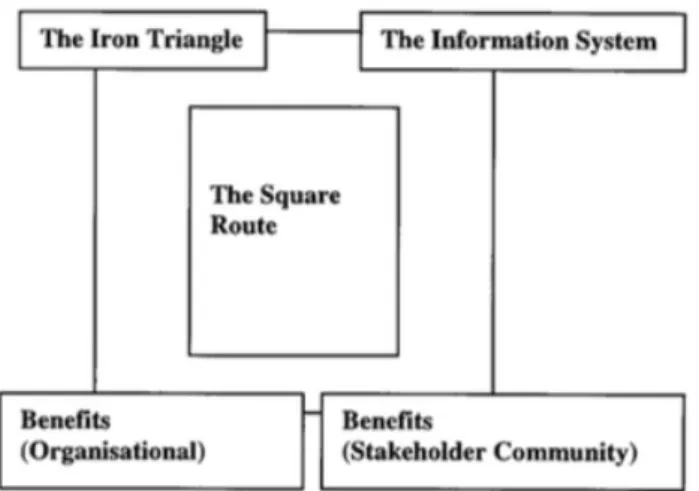
The Square Route framework (Figure 4) proposed by Atkinson (1999) complemented the classical Iron Triangle (cost, time and quality) providing a more accurate and balanced criteria for success in IS/IT project management. It continues to include the “Iron Triangle” as one of its vertices, since it is a necessary criterion to measure the project management process. But it also includes a vertex for “The Information System” focusing on measuring the technical strength of the resultant system, as well as two more vertices related to the
project’s “Benefits” – one focusing on the internal benefits for the organization and the other on the external benefits for stakeholder community.
Atkinson (1999) suggests that using only the Iron Triangle can result in a biased measurement of project management success that focuses solely on the project management process. That’s why the author proposed the Square Route to measure the success not only until the project’s implementation, but also post implementation, confirming, for example, if its users then accepted the delivered project.
Figure 4 - The Square Route (Atkinson, 1999, p. 341)
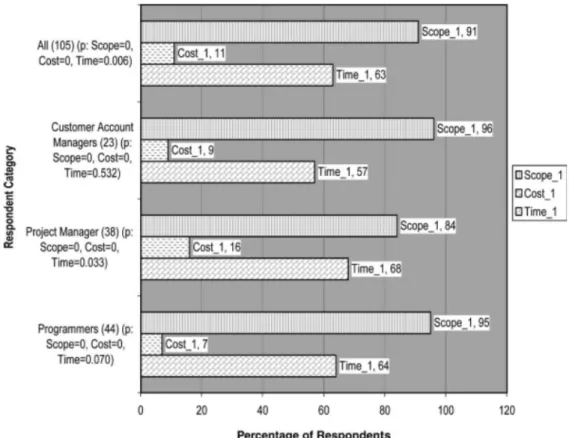
An exploratory survey was conducted by Agarwal and Rathod (2006) with internal stakeholders, involving programmers, project managers and customer account managers, to determine their view of a successful software project. The author assessed the respondents on what would be their priority, between time, cost and scope in case of (1) some urgency in project schedule, (2) in general, if the objective is to be isolated and (3) in the order of preference. The sample was formed by 105 questionnaires received from 12 Indian software organizations.
The results from Agarwal and Rathod’s (2006) study, as shown in Figure 5, found that although cost, time, functionality and quality continue to be important criteria for assessing the performance of software projects, all software professionals unanimously chosen scope as the most important criterion in defining the software project success. Additionally, in contrast to general belief, cost is considered to be the least important criterion for project success. This unanimous result causes surprise since it is expected that customer account manager should
be more inclined to have a market view, while project managers would be expected to be more business oriented.
Figure 5 - Importance given to Cost, Time and Scope (Agarwal and Rathod, 2006, p. 364)
Additionally, only 15% of the respondents provided their personal views (Agarwal, Rathod, 2006) of success criteria other that the ones from The Iron Triangle as can be seen in Figure 6. It is important to mention that these criteria were suggested without any provided reference.
Figure 6 - Success criteria other that Cost, Time and Scope (Agarwal and Rathod, 2006, p. 367)
Another practical exploratory study was performed by Thomas and Fernández (2008) with 36 Australian companies. The focus was to identify how organizations define the IT project success and evaluate the most effective methods in use. According to the authors a “key finding of this study is that companies who clearly define and effectively measure the elusive concept of IT project success have a greater chance of achieving success” (p. 739). The authors categorized the criteria used by companies to define success into three groups: project management success, technical success, and business success, as shown in Figure 7. Among the findings, the involved companies recognized that it was possible to have project management success without business success, and vice versa, what means that, for example, satisfying the customer may not constitute success overall if company goals have not been met.
Figure 7 - List of success criteria by category (Thomas and Fernández, 2008, p. 736)
In addition, Thomas and Fernández (2008) empirically evidenced that among 27 companies that tried to measure success, only 5 of them were effective in doing so, showing how challenging measuring the success criteria can be to companies
Marnewick (2012) did a research to understand the success rates and success factors of information and communication technology (ICT) projects in South Africa. Samplings were done in 2003, 2008 and 2011. One of the key findings as it relates to this review is that the companies are now (at the conclusion of the study) measuring success differently than they were in 2003. In 2003, success was defined as compliance to the Iron Triangle and, although in the 2008 and 2011 studies the Iron Triangle was still a relevant factor for success: with 73% of respondents indicating it as a primary factor of success, other factors – such as the benefits of the project and/or service – are gaining relevance as success markers. Notably, five other factors were indicated as important by more than 60% of respondents on the 2011’s study: user satisfaction (72%), meeting of project requirements (70%), delivery of business benefits (68%), stakeholders satisfaction (64%) and sponsor satisfaction (60%).
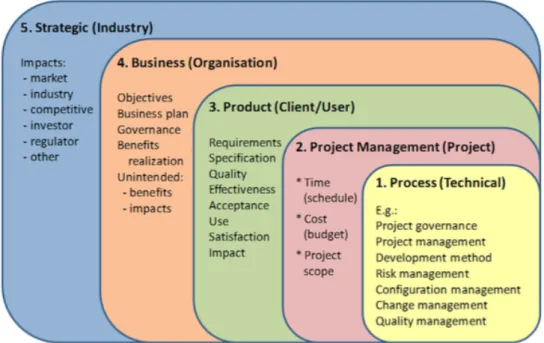
Finally, an article from Bannerman and Thorogood (2012) proposes an integrated framework to evaluate success in IT projects (Figure 8). The model extends the criteria available on literature focusing on what different stakeholders perceive as important. The framework contains five domains of success: process, project management, product, business and strategy. As seen in Figure 8, each domain represents a particular performance milestone
from a particular stakeholder perspective (in brackets after the domain name). Domains are totally independent and each one can be measured at different times. For example, a project can fail in one domain but succeed in another. Additionally, the table in Figure 9 clarifies the indicators that can be used to measure success at each domain.
Yet, according to Bannerman and Thorogood (2012), the paper has limitations since the model was developed from a literature review and empirically tested with just three cases. So, it still needs to be empirically validated to confirm its relevance for the literature.
Figure 9 - Domain survey descriptions and empirical indicators (Bannerman and Thorogood, 2012, p. 4879)
As aforementioned, this literature review covered articles from different periods of time in order to identify how the understanding of IT project success has evolved as supported in the findings from Jugdev and Müller (2005).
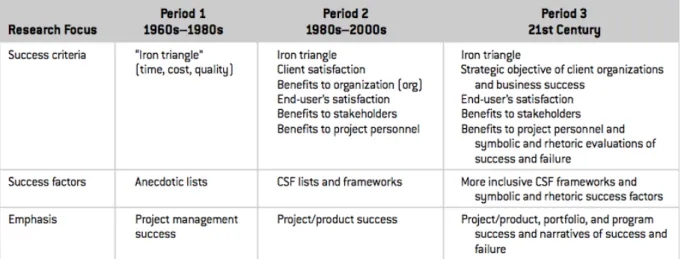
The change on the understanding of success was also demonstrated in an article published in 2009 (Ika, 2009) that evaluated all articles regarding project success published between 1986 and 2004 in the Project Management Journal (PMJ) and the International Journal of Project Management (IJPM). After analyzing a total of 30 articles, the author summarized the measurement of success overtime in Figure 10 below.
Figure 10 - Domain summary descriptions and empirical indicators (Ika, 2009, p. 11)
The findings shown in Figure 10 are supported by the research summarized on Table 1. All research mentioned the classical “iron triangle” view from 1960s-1980s focusing solely in the IT project management success. The studies comprising the 1980s-2000s timeframe extend the iron triangle proposing additional drivers toward success, such as client satisfaction, users satisfaction, benefits to stakeholders and to the organization, with a focus not only on project management success, but also on the whole IT project success (Wateridge, 1998; Atkinson, 1999). Besides, the other studies from the 21st century suggest also a newer extension from the previous frameworks, including also the business success with a broader focus on the overall program success (Thomas and Fernández, 2008; Bannerman and Thorogood, 2012).
Another major finding of this review concerns the importance of defining the success criteria prior to starting the project (Wateridge, 1998; Atkinson, 1999; Thomas and Fernández, 2008; Bannerman and Thorogood, 2012). There is a consensus among these authors that to measure success consistently, the criteria should be defined upfront, since success can be perceived differently among the individuals (Baker, Murphy and Fisher, 1974).
2.3 Social Representation Theory (SRT)
2.3.1 Definition of the Social Representation Theory (SRT)
Social Representation Theory (SRT) is a method created to analyze the relationship of individuals and the society. The theory was first presented by Serge Moscovici in 1961 and is described by Moscovici (1973, p. xiii) as:
[…] systems of values, ideas and practices with a two-fold function; first, to establish an order which will enable individuals to orientate themselves in their material and social world and to master it; secondly, to enable communication to take place amongst members of a community by providing them with a code for social exchange and a code for naming and classifying unambiguously the various aspects of their world and their individual and group history.
Later, Denise Jodelet deepened the theory of social representation, applying it in other areas of knowledge (Arruda, 2002). The SRT was initially used in social psychology studies, to probe the relationship between individual and society, and later in area of administration (Vergara and Ferreira, 2006). Jodelet (2016) also confirms that the SRT can be applied not only to understand the relationship between individuals and the society, but also to understand the relationship between a subject and an object, that can be a person, a thing, an event, a natural phenomenon, an idea, among others.
For this study, the subjects are IT professionals and, borrowing from Jodelet’s (2016) extension to the SRT, the object is the concept of “success in IT projects”. Using the SRT model the plan is to extract the relationship between the IT professionals and their notion on what is success in the projects that they work. By examining this connection, the intent is to expose the subjective meaning of success in IT projects as perceived by the very people that work on them.
2.3.2 Central Nucleus Approach to Social Representations
In 1976, the idea of the central nucleus was proposed by Abric (1994a), and since then it has been developed, refined and operationalized by research teams in France (Sá, 2002). The Central Nucleus Theory does not intend to replace the theoretical approach of the SRT, but rather to contribute “so that the SRT can be more heuristic to research and to social practices” (Flament, 1989, p. 204). Sá (2002, p. 14) indicates that a “complementation of the general theory is believed to be provided by the central nucleus theory”, reinforcing that the central nucleus (CN) approach does not intend to substitute the SRT.
The idea was presented as a theoretical solution for the apparent paradox of social representations, which can be at the same time stable and mobile, rigid and flexible, consensual and also marked by strong interindividuality. The Central Nucleus Theory (CNT) proposed that social representations are organized in two systems: a central system and a peripheral system in order to account for the contradictory features of the phenomenon (Abric, 1994b)
The central system or the central nucleus of the representation consists of a small number of cognitive elements that are responsible for the cohesion and consensually of the representation. In this sense, the central nucleus can generate the overall meaning of the representation and of determining the organization of the other elements (Vergara and Ferreira, 2006; Abric, 1994b).
Besides the central system, there is the peripheral system, which is composed by all elements of the representation that allow for mobility, flexibility and differences between individuals. This system supports the heterogeneity of the group enclosing the differences in perception of their members. Thus, it is more sensitive to the variable contexts and can adapt to social practices. As such, it protects the central system from circumstantial transformations (Vergara and Ferreira, 2006; Mazzoti, 2001; Abric, 1994b).
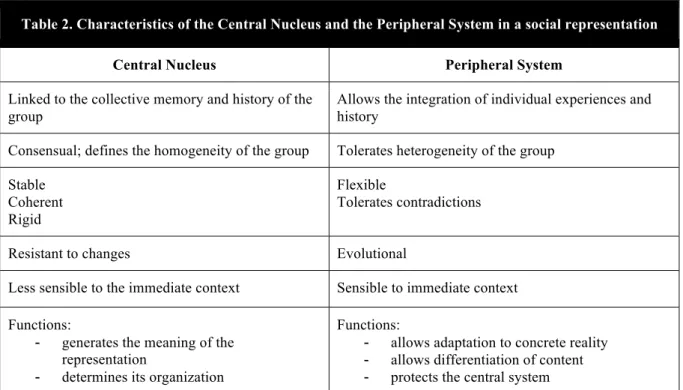
Table 2 summarizes the main aspects of the central nucleus and peripheral system in accordance to Abric (1994b, p. 80).
Table 2 - Characteristics of the Central Nucleus and the Peripheral System in a social representation
Table 2. Characteristics of the Central Nucleus and the Peripheral System in a social representation
Central Nucleus Peripheral System
Linked to the collective memory and history of the group
Allows the integration of individual experiences and history
Consensual; defines the homogeneity of the group Tolerates heterogeneity of the group Stable
Coherent Rigid
Flexible
Tolerates contradictions
Resistant to changes Evolutional
Less sensible to the immediate context Sensible to immediate context Functions:
- generates the meaning of the representation
- determines its organization
Functions:
- allows adaptation to concrete reality - allows differentiation of content - protects the central system Source: Abric (1994b, p. 80) apud Sá (2002 p. 74).
According to Sá (2002), the proposition of a dual system to the internal organization of the representations seems to go into the direction of a theoretical solution for the contradictions presented in social representation studies.
Based on the idea of the central core with its essential explanation of the shared connotation of the object, this study focus is in identifying the central nucleus of the social representation of Success in IT Projects from IT professionals’ perception, without despising the peripheral system of the social representation.
3 Research Methodology
The proposed methodology combines qualitative and quantitative data and uses the Social Representation Theory (SRT) with the technique of the free association of words – also called word evoking test – (De Rosa, 1988) to identify shared conceptions.
According to Abric (1994b), the free evocation or association of words technique is indicated in order to capture essential elements that can be masked when using only discursive or quantitative responses. The data collected through the free evocation is prepared using the “table of four quadrants” technique developed by Abric (1994b) – as presented in the next sessions – being the data then analyzed.
This method was chosen in order to provide a practical knowledge to an event that is common to people as stated by Jodelet (1989) when trying to reflect what is a consensus among scholars of the social representation in a concise formula: “a form of knowledge, socially elaborated and shared, which has a practical purpose and contributes to the construction of a common reality to a social group” (p. 36).
The methodology proposed in this dissertation is based on the principles of qualitative-quantitative research (Gomes and Araújo, 2005), with data being collected through the evocation of words technique and being processed through the technique of "four framework houses". (Vergara and Ferreira, 2006; Vergès, 2003; Abric, 1998). The social representation of success in IT projects is then compared to the existing literature in order to ascertain within the perception of success for IT professionals complies with existent literature and a lexical and qualitative analysis is performed on the results found.
The theoretical framework of Vergara (2013) and its methodological structure, which defines the research about the ends and means, in addition to defining the sampling universe, collection and processing of data was used by the author as a guideline.
3.1 Population and Sample
This section describes the population, or the group of elements (such as, companies, products, research), that are the object of this study (Vergara, 2013). Additionally, it defines the sample, which is the part of the population that was chosen according to a selection criterion.
With this in mind, the population in this research comprises all Information Technology professionals in Brazil with more than one year of experience participating in projects.
Initially, the research was done with IT professionals that were part of the author’s network and then it was also distributed to other groups of professionals using LinkedIn groups, PMI Chapters contact lists, other professionals indicated by friends, and so on.
Although the research was restricted to Brazilian IT professionals, no restriction was made on age, sex, role in IT and level or area of education. While only answers from professionals with over one year of experience were accepted, no further limitation or restriction was imposed on the seniority of the respondents.
There was also no limitation or restriction of collected results based on the size of companies, their segment or sector. IT professionals from small to big companies were considered independently of their contract type (i.e.: indefinite contracts, owners, contractors).
While there was no geographical restriction for the selection of sample, the results indicate that since respondents that were invited to participate were part of the author’s contact network, the city of Rio de Janeiro had the largest share of participants. Professionals from other states, such as São Paulo, Bahia, Minas Gerais, Florianópolis, Porto Alegre, Distrito Federal, Amapá, etc. also participated on the survey.
Even though the professionals that were targeted by the survey were Brazilian IT professionals with at least one year of experience working on IT projects many respondents did not fit this profile. Their responses were thus discarded to prevent noise or bias on the results.
3.2 Data Collection
This research involves two phases for collecting data and information in order to increase the confidence of its results. First, this study developed a literature review on articles concerning success criteria for IT projects. The purpose was to identify, consolidate and summarize extent research that might provide complementary or divergent views on the definition of success on IT projects. Additionally, the SRT methodology was probed. Thus, an empirical research was made to map the social representation of success in IT projects from the perspective of IT professionals that have worked in IT projects for more than 1 year.
Firstly, the research was focused on the literature concerning success criteria for IT projects and studied the SRT focusing on the aspects related to the central nucleus approach for the social representation.
The empirical research, the second phase of data collection, was based on an online field survey. The survey was split into two parts: a) word evocation and b) supplementary questionnaire to identify the respondents profile and retrieve additional information relevant to the study’s topic.
According to Vergara (2013), the free word evocation test is based on collecting words that first come to mind of the sample population when a specific word or phrase is presented to them, verbally or written. For this research, the phrase “IT Project Success” was used. This phrase was presented to survey participants through an online form and they were asked to write the first five words or phrases that occur to them when they thought about “IT Project Success”.
Following the word evocation part of the questionnaire, a supplementary survey with additional questions was presented to the participants. These additional responses support the lexical and content analyses, allow for a better profiling of the respondents, and validate if they are indeed in the desired population profile.
Both interactions, word evocation test and questionnaire were presented and were responded at the same time to correctly present a snapshot of the respondent perception
(transversal analysis) as it is not the scope of this research to conduct an analysis on how the population perception changes over time (longitudinal analysis).
3.3 Data Preparation
In this study, it will be adopted the model from Pierre Vergès to analyse the data, by using the technique of the four quadrants (Vergès, 2003) and using the software EVOC to perform the data analysis.
Prior to running the data analysis, the data resultant of the survey conducted was prepared for this process. Many responses included phrases or sentences and some had misspelled words or were close synonyms to other more commonly mentioned words. To maximize the quality of the outcome, a referential table (Appendix III) was made to translate misspelled words, sentences or phrases to a more common close synonym. While this procedure might have improved the result by increasing the frequency of words by joining words with the same meaning, it might add bias to the result as some of the references made were subjective and were based on the author’s interpretation of what the respondent has meant with his response.
After the normalization of the words as described in the previous paragraph, the words with their respective order of evocation were then processed in EVOC software, allowing the calculation of the frequency of evocation in comparison to the order in which they were raised (Abric, 1994b) to populate the four quadrants, identifying the core and peripheral system of the social representation of IT Project Success.
According to Sá (2002) and Abric (2005), as summarized in Table 3, the four quadrants technique from Vergès combines the frequencies of evocations, which provides more quantitative data, with the orders of the evocations, that have more qualitative information. Each quadrant from Vergès (1992) has a unique meaning of representation, as argued by Guimelli and Rouquette (1992) and described below:
• First quadrant: indicates the central core of the representation, which carries functions to generate the meaning of representation in a stable and organized manner. In this quadrant are located evocations with evocation frequency higher than the average frequency of evocation (AFE) and evocation order lower than the average evocation order (AEO).
• Second and Third quadrants: correspond to the less salient elements in the representation structure. In the second quadrant are the elements that have obtained a high frequency, but were evoked in late position. In the third quadrant are the elements that have been cited in low frequency, but were raised first in the evocation. Both quadrants have a close relationship with the central core.
• Fourth quadrant: are the elements that are more distant to the central nucleus, being considered peripheral elements since they combine a lower evocation frequency and a greater place in the evocation order. The elements of this quadrant are the ones that are more distant to what IT Project Success represents to them.
Table 3 - Summary of Vergès' Quadrants
Vergès’ Quadrants for success in IT projects from IT professionals perspective
First Quadrant: Central Nucleus
Above average frequency (> AFE) Below average evocation order (< AEO)
Second Quadrant
Above average frequency (> AFE) Above average evocation order (> AEO)
Third Quadrant
Below average frequency (< AFE) Below average evocation order (<AEO)
Fourth Quadrant: Peripheral System
Below average frequency (<AFE) Above average evocation order (>AEO)
In summary, the elements in the first quadrant, which are those more frequent and more promptly evoked, are more likely to be central. Conversely, those in the fourth quadrant are more likely to be peripheral ones. Elements in the other two quadrants could be thought as peripheral cognitions that are closely related to the central nucleus.
According to Vergès’ technique of the four quadrants (Vergès apud Sá, 2002) it is presented in Figure 11 the distribution of the quadrants according to the average frequency of evocation (AFE) and the average evocation order (AEO). In this study the evocated words were categorized in those quadrants to perform the analysis.
Figure 11 - Vergès Quadrants
Figure 12 consolidates the steps for data preparation described above in order to define de central nucleus of the social representation using Vergès’ four quadrants technique.
Figure 12 - Data preparation steps
Data was organized and processed by EVOC software resulting in the four quadrants frame from Vergès, indicating the central core and peripheral systems of the social representation of success in IT projects among IT professionals (Vergès, 2003). The EVOC software allows statistical calculations and builds arrays of co-occurrences, which are the basis for the construction of the four quadrants frame. Moreover, an important outcome of the software is the organization of the words into the four quadrants.
EVOC, which depicts a set of programs that perform different functions and that together organize and generate statistical analysis related to the evocation. According to
Oliveira et al. (2005), to use EVOC it is enough to create a text file that can be in “.TXT” format with the collected evoked words, upload the file in the system and select the buttons in the system’s interface from the programs that should be executed respecting the flow of execution displayed in the system’s interface as show in Figure 13.
Figure 13 - EVOC 2000 main interface
For this study, the first step in EVOC was to run LEXIQUE, which created a lexicon vocabulary for the tabulated evocations. The next step was to sort the evocations putting them in alphabetical order by using TRIEVOC.
Although NETTOIE is an optional function, it was decided to use NETTOIE, the main processing in this stage of the file set-up. It organizes the evocated words by applying different lemmatizations to different lexical units, according to the rules previously defined. The goal is to group together the different inflected forms of a word, so they can be analyzed as a single element. The NETTOIE performs a file cleaning, eliminating possible typos, spelling and lexical units.
Besides LEXIQUE, TRIEVOC and NETTOIE, it was used RANGMOT and RANGFRQ programs. RANGMOT provides the list of all words evocated in alphabetical order, indicating how many times they are raised and the order of their evocation. Besides, the RANGMOT provides: total frequency of each word, the weighted average of each word evocation of order, overall frequency and overall average of recall orders. Then, the last step in the system was to use RANGFRQ program, which organized into the four quadrants frame the elements that belong to the core and the periphery of the representation.
Two additional techniques are performed to deepen the understanding of the results found – a lexical and content analysis and a statistical observation on the demographic data of the respondents. The complementary analyses in this study are an attempt to extrapolate the result found on the analysis based on the EVOC software.
According to Freitas and Janissek-Muniz (2000, p. 29), the lexical analysis “consists of changing from the analysis of the text to the analysis of the lexicon (the set of all words found in the statements or answers). The content analysis, however, “consists of an in-depth reading of each answer, where, encoding each one, we can obtain an idea of the whole” (Freitas and Janissek-Muniz, 2000, p. 29).
These analyses are developed over the following open questions of the questionnaire:
• “Which of these five words or phrases do you consider to be the most important when you think of ‘Success in IT Projects’? Why?”
• “Describe what you understand by ‘Success in IT Projects’:”
Initially, the respondents were grouped based on the words that they evocated and that were part of the central core. For example, all the respondents that associated a word that is in the central nucleus were grouped together and their respective open questions were evaluated by using the techniques of lexical and content analyses. The total number of groups evaluated is the same as the number of words in the central core.
The first step for each group involves the lexical analysis to indicate the most frequent phrases and words from the open questions in order to identify key ideas that can be categorized and compared to their respective word of the central nucleus of the SR.
The second step to be followed for data analysis is the content analysis that consists of an in-depth reading of each of the answers. As suggested by Freitas, Janissek-Muniz and Moscarola (2005), using the result of the lexical analysis as the basis for defining the categories facilitates the content analysis, since its focus will be on revising and complementing the categories identified in the lexical analysis and no longer to fully identify the key ideas.
It is important to mention that lexical and content analyses were not performed on all the respondents, since the objective of using these analyses in this study was not to support the presence of the words in the central nucleus. The purpose is to validate if the responses to the open questions corroborate or contradict the words identified on the CN so the elements that are part of the central nucleus in Vergès’ frames are compared to the results from the lexical and content analyses.
The second and last analysis focuses on demographical aspects and tries to identify discerning trends, such as average time of experience, or average company size, among different groups of respondents. How the responds are grouped is further detailed on Chapter 4.
4 Data Analysis and Results
4.1 Sample AnalysisThe online survey was distributed initially to contacts belonging the author’s network and then it was sent more than one time to other distribution lists of IT professionals from different regions in Brazil. 267 responses were obtained. Among those responses, only the ones from professionals that explicitly indicated that their occupational area was IT and that they had more then one year of experience with IT Projects were considered. With this initial selection 175 responses were harnessed and 92 were initially discarded.
It would be possible to increase the number of respondents in the sample of 175 elements by using different filters rather than just the “company department” filter, in order to validate if the professional is from IT. Besides “company department” filter, other filters such as “company segment” or “job position” could also indicate IT professionals. For example, respondents that did not indicate their department as IT but that indicated they work on a company on the IT sector or that have IT related job positions such as system developer, system analyst, IT Manager, Director of Technology, CTO, etc., could also be part of the sample. Anyway, it was decided that given sufficient valid responses from the initial triage, it would be more cost-beneficial not to extend the filters.
The next step was an analysis of the evocated words from the 175 responses under consideration. Thus, a detailed analysis on the quality of the data provided by the respondents was done. Subjects that have left blank responses on the evocation were eliminated and so were the ones that included incomprehensible, out of context, or confusing words or expressions. Responses that could not be clearly related to a single word or phrase during the normalization process described on section 3.3 were also disregarded. In this second analysis of the responses an additional number of 10 samples were discarded from the database.
According to Moscarola (1990), a sample analysis of less than 30 registers can present a wrong or outdated result. Above 100 responses the success rate raises considerably becoming even more precise above 300. Based on this, by analyzing 165 subjects in this research it is possible to have a satisfactory result.
In general, the more numerous the group of participants is, the more stable the results will be. This is, a larger sample tends to produce results less susceptible to be influenced by
the presence of extreme cases and is closer to the reality observed in the population that is extracted. For this reason, the samples are usually larger, performed about 100 (Gomes, Oliveira and Sá, 2008) or 200 (Sá, 1998) participants. So, with regard to the sample, this study considers 165 subjects for the evocation test and for the analysis.
From this sample, the time of experience of the IT professionals in IT projects is above 10 years for 62% of the respondents. Considering all respondents that have above 5 years of experience it represents 86% of the total sample, which indicates seniority among the elements with a weighted average time of experience of 18.4 years. In regard to the age of the respondents, a weighted average of 36.8 years old was found, which supports the indication of a sample containing more experienced professionals. The complete distributions of respondents per time of experience in IT projects and per groups of ages are detailed in Appendix IV.
From the 165 IT professionals that have answered the survey, 154 (88%) are male and only 21 (12%) are female. Mishra et al. (2014) already alerted for the fact that women are low represented in the IT area. This is further explained by Castro (2011), indicating that the low participation of women in IT is due to historical and cultural reasons.
The sample is distributed across the 5 Brazilian regions, having 10 respondents from the Norte region representing 5.7% of the sample, 11 from Nordeste representing 6.3%, 110 are from Sudeste region with the greater representation of 62.8% of the sample, Centro-Oeste has 11 respondents or 6.3% of representation and Sul region with 33 people and 18.9% of the total subjects. The states that concentrate respondents are RJ, SP and MG, all belonging to region Sudeste as shown in Table 4.
Table 4 - Distribution of Respondents per Region and State in Brazil
Region States Number of Subjects %
Norte (10; 5.7%) AM 1 0.6% AP 2 1.1% PA 4 2.3% TO 1 0.6% RO 2 1.1% Nordeste (11; 6.3%) BA 5 2.9% CE 1 0.6% MA 1 0.6% PI 1 0.6% PE 2 1.1% PB 1 0.6% Sudeste (110; 62.8%) ES 4 2.3% MG 17 9.7% RJ 58 33.1% SP 31 17.7% Centro-Oeste (11; 6.3%) DF 9 5.1% MS 2 1.1% Sul (33; 18.9%) PR 10 5.7% RS 11 6.3% SC 12 6.9%
In regards to where the respondents work, 151 (86%) work for private companies, 11 for public companies (6%), 7 (4%) belongs to Non-Governmental Organizations and the other 6 (4%) respondents are part of other types of companies (Appendix IV). Additionally, from the organization’s size perspective as shown in Figure 14, 98 (56%) subjects are employed in big companies with over 500 employees, 33 (19%) are part of a company that have between 100 and 500 employees, 28 (16%) in companies with 20 to 100 employees and 16 (9%) in small companies with less than 20 employees.
Additional information concerning the sample demonstrates that the level of education among the individuals is divided as the following: 126 (71.9%) postgraduate/MBA, 26 (14.9%) graduate, 18 (10.3%) master, 4 (2.3%) high school/technical school and 1 (0.6%) doctorate. This shows that only 2.3% of the sample does not have the graduation as a minimum level of education. According to Ferreira (2003) companies in Brazil want IT professionals that are at least graduated, what is applicable to the majority of this sample, although answers from non-graduate respondents were also considered.
Continuing, another information provided was regarding the schools of the subjects, which have a considerable concentration of professionals in Information Technology with 135 (78.3%), Engineering with 18 (10.3%) and Administration with 13 (7.4%). This results shows that the sample is in accordance with the study from Ferreira (2003) that showed that the schools that most concentrate IT professionals are Information Technology, Business Administration and Engineering.
Concerning the certifications related to project management, 90 (51%) respondents stated that they do not have any certification related to project management and the other 85 (49%) elements of the sample answered that they have at least one certification. From the 165 elements, 42 (24%) of the sample have the PMP certification from PMI and 133 (76%) are not PMP certified. Additionally, 14 (8%) subjects are Certified Scrum Professionals.
However when the professionals were questioned if they used any methodology in the projects they are working or have worked on, 130 (74% of the sample) indicated the use of PMBOK framework from PMI and 93 (53%) indicated the use of an Agile Methodology.
4.2 Central Nucleus and Peripheral System of the Social Representation
For the identification of the core and the peripheral systems of the social representation of success in IT projects, the software EVOC was used for data processing. The data was resulted from the free association of words collected through the online survey as detailed in Chapter 3.