Carlos Pestana Barros & Nicolas Peypoch
A Comparative Analysis of Productivity Change in Italian and Portuguese Airports
WP 006/2007/DE _________________________________________________________
António Afonso and Christophe Rault
What We Really Know about Fiscal Sustainability in the EU? A Panel Data Diagnostic.
WP 020/2007/DE/UECE _________________________________________________________
Departament of Economics
WORKING PAPERS
ISSN Nº0874-4548
School of Economics and Management
What do we really know about fiscal sustainability
in the EU? A panel data diagnostic
*António Afonso
#and Christophe Rault
$2007
*
We are grateful to Ad van Riet, Jürgen von Hagen and an anonymous referee for helpful comments and suggestions and to Simone Ruiz for assistance with the data. The opinions expressed herein are those of the authors and do not necessarily reflect those of the European Central Bank or the Eurosystem. Christophe Rault thanks the Fiscal Policies Division of the ECB for its hospitality.
#
European Central Bank, Kaiserstraße 29, D-60311 Frankfurt am Main, Germany, email: [email protected].
ISEG/TULisbon – Technical University of Lisbon, Department of Economics; UECE – Research Unit on Complexity and Economics, R. Miguel Lupi 20, 1249-078 Lisbon, Portugal, email: [email protected]. UECE is supported by FCT (Fundação para a Ciência e a Tecnologia, Portugal), financed by ERDF and Portuguese funds.
$
Contents
Abstract ...3
Non-technical summary ...4
1. Introduction...6
2. The analytical framework of public finance sustainability...9
3. Fiscal data overview ...13
4. Stationarity analysis of fiscal series...15
4.1. Standard (individual) unit root tests...16
4.2. Individual unit root tests allowing for structural breaks ...17
4.3. First generation panel unit root tests (cross-country independence) ...21
4.4. Second generation panel unit root tests (cross-country dependence) ...23
4.5. Panel unit root tests allowing for structural breaks...25
5. Cointegration between government expenditure and revenue ratios...31
6. Conclusion ...36
References...39
Appendix A. Data sources ...44
Appendix B. Standard individual unit root test results ...45
Appendix C. Results of individual unit root tests with breaks ...48
Abstract
We assess the sustainability of public finances in the EU15 over the period 1970-2006 using stationarity and cointegration analysis. Specifically, we use panel unit root tests
of the first and second generation allowing in some cases for structural breaks. We
also apply modern panel cointegration techniques developed by Pedroni (1999, 2004), generalized by Banerjee and Carrion-i-Silvestre (2006) and Westerlund and Edgerton (2007), to a structural long-run equation between general government expenditures and revenues. While estimations point to fiscal sustainability being an issue in some countries, fiscal policy was sustainable both for the EU15 panel set, and within sub-periods (1970-1991 and 1992-2006).
Keywords: intertemporal budget constraint, fiscal sustainability, EU, panel unit root, panel cointegration.
Non-technical summary
The sustainability of public finances is a key policy issue for the European Union
(EU). Within the EU fiscal framework, fiscal discipline is an important support for the
implementation of monetary policy, particularly in the case of the European and
Monetary Union (EMU) countries. In EMU, the existence of sound fiscal policies is
seen as a necessary objective for individual countries to pursue. For example, it is not
possible to discard adverse responses from the financial markets when fiscal
behaviour is deemed to be unsustainable. Indeed, the accumulation of government
debt, following continued budgetary imbalances, may in the end trigger the need for
higher long-term interest rates in order to place additional sovereign debt in the
markets. Moreover, the Treaties governing the EU also require sustainable public
finances. Countries are urged to comply with the budgetary requirements of EMU, by
avoiding excessive deficits, keeping government debt levels below the 60 percent of
GDP reference value, and respecting the requirements of the Stability and Growth
Pact (SGP).
The aim of this paper is to examine the sustainability of public finances for the EU15
countries (covering the EU Member States before the 1 May 2004 enlargement) by
applying recent advances in the econometrics of non-stationary panel data methods.
The econometric literature on unit roots and cointegration testing has been expanding
rapidly, and now distinguishes between the first generation tests developed on the
assumption of cross-section independence (except for common time effects), and the
second generation tests that allow, in a variety of forms and degrees, the dependence
that might prevail across the different units in the panel. In the context of our paper,
cross-dependence can mirror possible changes in the behaviour of fiscal authorities
related to the signing of the EU Treaty in Maastricht on 7 February 1992, with the
setting up of the fiscal convergence criteria that urged the EU countries to consolidate
public finances in the run-up to the EMU on 1 January 1999, when most EU legacy
currencies were replaced by the euro, and in the context of the SGP since then.
The econometric methods used in the paper to assess the sustainability of public
sectional independence among panel units (apart from common time effects); (iii) two
second generation panel data unit root tests that relax the assumption of
cross-sectional independence; (iv) panel data unit root tests that enable to accommodate
structural breaks, and (v) the panel data cointegration tests developed by Pedroni
(1999, 2004) and generalized by Banerjee and Carrion-i-Silvestre (2006), and the
bootstrap panel cointegration test by Westerlund and Edgerton (2007).
The results from these panel unit root tests, allowing for structural breaks, support the
results of both the first and second generation panel data unit root tests, leading us to
conclude that the first difference of stock of public debt series is integrated of order
zero, thus indicating that the solvency condition would be satisfied for EU15
countries, which is a necessary condition for fiscal policy sustainability. Moreover,
our results also show that general government expenditure and the revenue series are
integrated of order one.
Even if the results of the analysis may question fiscal sustainability in some cases
when taken individually, it is nevertheless true that the tests point to the solvency of
government public finances when considering the EU15 panel data set. This is an
advantage of the panel approach, since the time series dimension of the data is not that
long for individual countries. Even if there is no single fiscal policy in the EU, the
panel sustainability of public finances indicated by our results is relevant in a context
of EU countries seeking to pursue sound fiscal policy behaviour within the Stability
and Growth Pact framework.
Interestingly, the panel cointegration results for the entire 1970-2006 period allow us
to draw the conclusion that a long-run relationship does exist between general
government revenueand expenditure for the set of EU15 countries, at least at the 10
per cent level of significance, both using conventional (asymptotic) critical values
given in Pedroni (1999), and bootstrap panel cointegration proposed by Westerlund
and Edgerton (2007). Moreover, this conclusion holds for the two sub-periods,
1970-1991 and 1992-2006 (broadly before and after the Maastricht Treaty) for most of the
1. Introduction
The sustainability of public finances is a key policy issue for the European Union
(EU). Within the EU fiscal framework, fiscal discipline is an important support for the
implementation of monetary policy, particularly in the case of the EMU member
countries. In EMU, the existence of sound fiscal policies is seen as a necessary
objective for individual countries to pursue. It is not possible to exclude adverse
responses from the financial markets when fiscal behaviour is deemed to be
unsustainable. Indeed, the accumulation of government debt, following continued
budgetary imbalances, may in the end trigger the need for higher long-term interest
rates in order to place additional sovereign debt in the markets.1 Moreover, the
Treaties governing the EU also require sustainable public finances. Countries are
urged to comply with the budgetary requirements of EMU, by avoiding excessive
deficits, keeping debt levels below the 60 percent of GDP reference value, and
respecting the requirements of the Stability and Growth Pact (SGP).2
The aim of this paper is to examine the sustainability of public finances for the EU15
countries (covering the EU Member States before the 1 May 2004 enlargement) by
applying recent advances in the econometrics of non-stationary panel data methods.3
The econometric literature on unit roots and cointegration testing has been expanding
rapidly, and now distinguishes between the first generation tests developed on the
assumption of cross-section independence (except for common time effects), and the
second generation tests that allow, in a variety of forms and degrees, the dependence
that might prevail across the different units in the panel. This question is crucial and
responds to the complex nature of the interactions and dependencies that generally
exist over time and across the individual units in the panel. For instance, observations
on firms, industries, regions and countries tend to be cross-correlated as well as
serially dependent. As pointed out by Breitung and Pesaran (2005), the problem of
cross-section dependence is particularly difficult to deal with since it could arise for a
1
Afonso et al. (2007) report evidence on the relevance of fiscal variables as determinants of sovereign credit ratings, which also points to the need for sound fiscal policies.
2
See Morris et. al (2006) on the revised framework of the SGP. 3
variety of reasons, including spatial spillover effects, common unobserved shocks,
social interactions, or a combination of these factors.
In the context of our paper, cross-dependence can mirror possible changes in the
behaviour of fiscal authorities related to the signing of the EU Treaty in Maastricht on
7 February 1992, with the setting up of the convergence criteria that urged the EU
countries to consolidate public finances in the run-up to the EMU on 1 January 1999,
when most EU legacy currencies were replaced by the euro, and in the context of the
SGP since then.
Generally, fiscal sustainability is considered on a country basis and can usually only
be restored by changing national fiscal policies. From a monetary policy point of
view, fiscal policy in the current institutional setting of EMU must be considered a
largely national competence and responsibility. Although, even if there is no single
fiscal policy in the EU, a panel sustainability analysis of public finances has to be
seen as relevant in a context of EU countries seeking to pursue common and sound
fiscal policy behaviour within the SGP framework. Possible cross-country
dependence can be envisaged either in the run-up to EMU or, for example, via
integrated financial markets. Indeed, with cross-country spillovers in government
bond markets especially after the completion of the single EU15 capital market from
1994 were to be expected, interest rates comovements inside the EU became also
more noticeable.
To the best of our knowledge, few comparable studies have taken into account the
possible cross-sectional dependence among countries when investigating the
sustainability of public finances for the EU15 countries. A few studies provide panel
unit root and panel cointegration analysis in this context, notably Prohl and Schneider
(2006), for eight OECD countries and Claeys (2007) for the EU (not allowing for
cross-section dependence). Indeed, although the main analytical techniques used to
analyse the sustainability of public finances have been stationarity tests for the stock
of public debt and cointegration tests between government expenditures and
sometimes poses the problem of relatively short time series.4 This paper takes these
results in the literature regarding the sustainability of public finances, and assesses
them to see whether they still hold when more powerful cointegration techniques are
employed in a panel framework.
Our econometric methodology uses three approaches for unit root testing: panel data
integration tests of “first generation” (Breitung, 2000; Choi, 2006; Hadri, 2000; Im,
Pesaran and Shin, 2003; Levin, Lin and Chu, 2002; Maddala and Wu, 1999), which
assume cross-sectional independence among panel units (except for common time
effects); panel data unit root tests of the “second generation” (Choi, 2006; Moon and
Perron, 2004), which allow for more general forms of cross sectional dependency
(not only limited to common time effects); and panel unit root tests that allow for
structural breaks (Im and Lee, 2001). We also implement panel cointegration
techniques developed by Pedroni (1999, 2004), and generalised by Banerjee and
Carrion-i-Silvestre (2006) and Westerlund and Edgerton (2007), to a structural
long-run equation between general government expenditures and revenues. To make the
analysis robust, the results of panel data unit root tests are also compared with those
obtained with individual unit root tests.
The advantages of panel data methods within the macro-panel setting include the use
of data for which the spans of individualtime series data are insufficient for the study
of many hypotheses of interest. Other benefits include better properties of the testing
procedures when compared to more standard time series methods, and the fact that
many of the issues studied, such as convergence, purchasing power parity or the
sustainability of public finances, naturally lend themselves to being studied in a panel
context.
The remainder of the paper is organised as follows. In section two we briefly review
the analytical framework of public finance sustainability. In section three we present a
brief overview of our fiscal data. In section four we perform the stationarity analysis
4
of the fiscal series. In section five we report the cointegration results for the general
government expenditure and revenue series. Finally, section six concludes the paper.
2. The analytical framework of public finance sustainability
In the beginning of the 1920s, when writing about the public debt problem faced by
France, Keynes (1923) highlighted the need for the French government to conduct a
sustainable fiscal policy in order to satisfy its budget constraint. Keynes stated that the
absence of sustainability would be evident when “the State's contractual liabilities
(…) have reached an excessive proportion of the national income” (p. 54).
In modern terms, the sustainability of public finances is challenged when the
government debt-to-GDP ratio reaches an excessive value. There is a problem of
sustainability when the government revenues are not enough to keep on financing the
costs associated with the new issuance of public debt or, again in Keynes words, when
“it has become clear that the claims of the bond-holders are more than the tax payers
can support” (p. 55). At that point the government will have to take measures that
restore the sustainability of fiscal policy, meaning that the State “must come in due
course to some compromise between increasing taxation, and diminishing
expenditure, and reducing what (…) [it] owe[s]” (p. 59).
From an analytical perspective, the issue of fiscal policy sustainability can be
presented in a straightforward way with the so-called present value borrowing
constraint (PVBC). In order to derive the PVBC of a single country, the flow
government budget constraint for a given period t can be written as
t t t t
t r B R B
G +(1+ ) −1 = + , (1)
where G is the primary government expenditure, R is the government revenue, B is
the government debt, and r is the real interest rate.5 Rewriting (1) for the subsequent
periods, and recursively solving that equation leads to the following intertemporal
budget constraint:
5
∑
∏
∏
∞ = = + + = + + + + ∞ → + + − = 1 1 1 ) 1 ( lim ) 1 ( s sj t j
s t s j j t s t s t t r B s r G R B . (2)
When the second term from the right-hand side of equation (2) is zero, the present
value of the existing stock of public debt will be identical to the present value of
future primary surpluses. For empirical purposes it is useful to make several algebraic
modifications to equation (1). Assuming that the real interest rate is stationary, with
mean r, and defining
1
)
( − −
+
= t t t
t G r r B
E , (3)
it is possible to obtain the following PVBC:
∑
∞ = + + + + + − = + − + →∞ + 0 1 1 1 ) 1 ( lim ) ( ) 1 ( 1 s s s t s t s t s t r B s E R rB . (4)
A sustainable fiscal policy needs to ensure that the present value of the stock of public
debt, the second term of the right hand side of (4), goes to zero in infinity,
constraining the debt to grow no faster than the real interest rate. In other words, it
implies imposing the absence of Ponzi games and the fulfilment of the intertemporal
budget constraint. Faced with this transversality condition, the government will have
to achieve future primary surpluses whose present value adds up to the current value
of the stock of public debt.6
It is also worth noting that the hypothesis of fiscal policy sustainability is related to
the condition that the trajectory of the main macroeconomic variables is not affected
by the choice between the issuance of public debt and the increase in taxation. Under
such conditions, it would therefore be irrelevant how the deficits are financed, which
also implies the assumption of the Ricardian Equivalence hypothesis.7
6
In addition, one can also derive the solvency condition, with all the variables defined
as a percentage of GDP.8 The PVBC, with the variables expressed as ratios of GDP,
with y being the real GDP growth rate, and neglecting for presentation purposes
seigniorage revenues, is then written as
t t t t t t t t t t Y R Y G Y B y r Y B − + + + = − − 1 1 ) 1 ( ) 1 ( . (5)
Assuming the real interest rate to be stationary, with mean r, and considering also
constant real GDP growth, the budget constraint is then given by
[
]
( 1)0 ) 1 ( 1 1 1 lim 1 1 + + + + ∞ = + − ⎟ ⎠ ⎞ ⎜ ⎝ ⎛ + + ∞ → + − ⎟ ⎠ ⎞ ⎜ ⎝ ⎛ + + =
∑
s s t s t s t s s t r y b s e r yb ρ , (6)
with bt = Bt/Yt, et = Et/Yt and ρt = Rt/Yt. When r > y, it is necessary to introduce a
solvency condition, given by 0
1 1
lim ( 1)
= ⎟ ⎠ ⎞ ⎜ ⎝ ⎛ + + ∞ → + + s s t r y b
s , in order to bound public debt
growth.9 This yields the familiar result that fiscal policy will be sustainable if the
present value of the future stream of primary surpluses, as a percentage of GDP,
matches the “inherited” stock of government debt. In a similar fashion, looking at the
US after the end of the Second World War, Domar (1944) pointed out that it would be
possible to sustain successive primary budget deficits as long as the real growth rate
surpasses the real interest rate (y > r).
A common practice in the literature is to investigate past fiscal data to see if
government debt follows a stationary process or to establish if there is cointegration
between government revenues and government expenditures.10
8
For instance, Hakkio and Rush (1991) suggest that an analysis based on ratios (to GDP) is more appropriate for growing economies.
9
This implies that the growth rate of the debt-to-GDP ratio should be less than the
factor
(
(1+y)/(1+r))
(s+1). 10Recalling the PVBC in equation (4), it is possible to ascertain empirically the absence
of Ponzi games by testing the stationarity of the first difference of the stock of public
debt, using unit root tests both at the country level and for a European panel. It is also
possible to assess fiscal policy sustainability through cointegration tests. The implicit
hypothesis concerning the real interest rate, with mean r, is also stationarity. Using
again the auxiliary variable Et =Gt +(rt −r)Bt−1, and the additional definition
1
−
+ = t t t
t G rB
GG , the intertemporal budget constraint may also be written as
1
0 1 (1 )
lim ) ( ) 1 ( 1 + + ∞ = − + + →∞ + + ∆ − ∆ + =
−
∑
t sss s t s t s t t r B s E R r R
GG , (7)
and with the no-Ponzi game condition, GGt and Rt must be cointegrated variables of
order one for their first differences to be stationary.
Assuming that R and E are non-stationary variables, and that the first differences are
stationary variables, this implies that the series R and E in levels are I (1). Then, for
equation (7) to hold, its left-hand side will also have to be stationary. If it is possible
to conclude that GG and R are integrated of order 1, these two variables should be
cointegrated with cointegration vector (1, -1) for the left-hand side of equation (7) to
be stationary.
The procedure to assess the sustainability of the intertemporal government budget
constraint therefore involves testing the following cointegration regression:
t t
t a bGG u
R = + + . If the null of no cointegration, i.e. the hypothesis that the two I(1)
variables are not cointegrated, is rejected (with a high-test statistic), this implies that
one should accept the alternative hypothesis of cointegration. For that result to hold
true, the series of the residual ut must be stationary, and should not display a unit root.
Hakkio and Rush (1991) also demonstrate that if GG and R are non-stationary
variables in levels, the condition 0 < b < 1 is a sufficient condition for the budget
constraint to be obeyed. However, when government revenues and expenditures are
1 in order for the trajectory of the government debt to GDP ratio not to diverge in an
infinite horizon.11
In terms of our subsequent empirical analysis, we will assess the stationarity of
government debt, a sufficient but not necessary condition for fiscal sustainability, and
the existence of cointegration between government revenues and expenditures, a
necessary condition for fiscal sustainability.
3. Fiscal data overview
All data are taken from the European Commission AMECO (Annual
Macro-Economic Data) database, covering the period 1970-2006 for the EU15 countries. The
precise AMECO codes are reported in Appendix A, and Table 1 reports summary
statistics for our main fiscal variables.
In the period 1970-2006 the highest government debt-to-GDP ratios were recorded in
Belgium, Italy, Greece and Ireland, related to high budget deficits incurred by those
countries, and resulted notably in the pushing up of interest payments. The
government expenditure-to-GDP ratios ranged overall between some 20 per cent and
70 per cent, with the lower values being recorded in the beginning of the period, while
the government revenue-to-GDP ratios were in the interval between 20 and 60 per
cent. Additionally, visual inspection of the revenue and expenditure time series as a
ratio of GDP, as exemplified in Figure 1 for selected countries, and in advance of the
subsequent econometric analysis, may help to assess sustainability issues in individual
cases.
11
Table 1 – Statistical summary for fiscal variables (% of GDP, 1970-2006)
Government debt Primary balance
Country Mean Max Min n Mean Max Min n
Austria 48.0 67.9 16.7 37 0.9 3.5 -2.0 37
Belgium 97.9 133.4 54.3 37 2.0 6.8 -4.8 37
Denmark 48.3 80.1 6.2 36 4.5 11.6 -3.0 37
Finland 26.6 57.8 6.1 36 4.0 9.7 -3.3 37
France 42.3 66.6 19.8 30 0.2 1.9 -2.3 37
Germany 42.5 67.9 18.0 37 0.2 2.8 -4.1 37
Greece 67.2 114.0 17.5 30 -0.7 5.0 -6.7 37
Ireland 67.5 112.9 25.8 37 0.8 6.6 -7.3 37
Italy 84.9 121.5 37.4 37 -0.7 6.6 -6.7 37
Luxembourg 9.3 20.3 4.1 37 2.6 6.4 -1.6 37
Netherlands 60.6 78.5 39.6 32 1.7 5.0 -1.3 37
Portugal 47.7 67.4 14.2 34 -0.4 3.9 -7.4 37
Spain 37.3 66.8 11.8 32 0.0 3.1 -4.4 37
Sweden 49.2 73.2 24.6 34 4.0 10.3 -5.6 37
United Kingdom 49.9 77.4 33.4 37 1.1 6.8 -4.8 37
Government revenue Government expenditure
Country Mean Max Min n Mean Max Min n
Austria 48.0 52.5 38.3 37 50.1 56.7 37.1 37
Belgium 46.3 51.1 38.1 37 51.6 62.1 40.2 37
Denmark 52.9 58.1 44.0 37 52.6 60.6 39.5 37
Finland 48.9 57.1 33.6 37 46.5 64.7 29.5 37
France 46.2 50.9 37.1 37 48.4 54.5 36.5 37
Germany 44.3 46.6 39.6 37 46.6 49.9 39.1 37
Greece 34.0 47.0 22.5 37 40.3 52.0 22.6 37
Ireland 36.5 43.6 29.2 37 40.9 53.2 31.6 37
Italy 38.7 47.6 27.9 37 46.2 56.3 32.1 37
Luxembourg 40.4 44.4 27.8 35 38.5 45.2 25.3 35
Netherlands 48.5 53.8 41.2 37 51.0 59.2 42.7 37
Portugal 32.6 43.5 20.6 37 36.9 47.8 18.6 37
Spain 32.8 40.1 20.9 37 35.2 46.6 20.3 37
Sweden 57.4 62.3 46.0 37 57.6 72.4 41.8 37
United Kingdom 39.8 44.1 34.9 37 42.3 45.4 36.9 37
Figure 1 – Fiscal variables for selected countries
a - France b - Ireland
10 20 30 40 50 60 70 1 970 1 972 1 974 1 976 1 978 1 980 1 982 1 984 1 986 1 988 1 990 1 992 1 994 1 996 1 998 2 000 2 002 2 004 2 006 D e bt ( % of G D P ) 35 37 39 41 43 45 47 49 51 53 55 57 59 R ev . and E x p. ( % o f G D P )
Debt Revenue Expenditure
10 30 50 70 90 110
1970 1972 1974 1976 1978 1980 1982 1984 1986 1988 1990 1992 1994 1996 1998 2000 2002 2004 2006
Debt (% of GDP
) 30 32 34 36 38 40 42 44 46 48 50 52 54 56
Rev. and Exp. (% of GDP
)
Debt Revenue Expenditure
c - Italy d – United Kingdom
10 30 50 70 90 110 130 197 0 197 2 197 4 197 6 197 8 198 0 198 2 198 4 198 6 198 8 199 0 199 2 199 4 199 6 199 8 200 0 200 2 200 4 200 6 D ebt ( % o f G D P ) 30 32 34 36 38 40 42 44 46 48 50 52 54 56 58 60 R ev . an d E x p . ( % o f G D P )
Debt Revenue Expenditure
30 35 40 45 50 55 60 65 70 75 80 19 70 19 72 19 74 19 76 19 78 19 80 19 82 19 84 19 86 19 88 19 90 19 92 19 94 19 96 19 98 20 00 20 02 20 04 20 06 De b t ( % o f G DP ) 30 32 34 36 38 40 42 44 46 48 50 R e v . an d E x p. ( % of G D P )
Debt Revenue Expenditure
Source: European Commission AMECO database.
4. Stationarity analysis of fiscal series
In this section we study the stationarity of the fiscal series in our country panel,
specifically the stock of government debt in real terms and the ratios to GDP of
government revenue and government expenditure, using several unit root tests, which
allow notably for cross-country independence and dependence, and for structural
4.1. Standard (individual) unit root tests
The first step of the analysis is to look at the data univariate properties and to
determine the degree of integration of our fiscal series, and also to assess the
existence of a unit root in the first difference of the stock of government debt.
Theoretically, a process is either I(0), I(1) or I(2). Nevertheless, in practice many
variables or variable combinations are borderline cases, so that distinguishing
between a strongly autoregressive I(0) or I(1) process (interest rates are a typical
example), or between a strongly autoregressive I(1) or I(2) process (nominal prices
are a typical example) is far from easy. Therefore, we have applied a sequence of
standard unit root tests (Augmented Dickey-Fuller (ADF) test; the Phillips-Perron
(PP) test, 1988; the Kwiatkowsky, Phillips and Shin (KPSS) test, 1992; the Elliot,
Rothenberg, and Stock Point Optimal (ERS) test, 1996; and the Ng and Perron (NP)
tests, 2001), to investigate which of the I(0), I(1), I(2) assumptions is most likely to
hold.12
All these tests have been implemented for the first difference of the stock of
government debt at 1995 constant prices, while taking general government
expenditure and the general government revenue as a percentage of GDP. The results
for a model with a constant and no trend are reported in Tables B1, B2 and B3 in
Appendix B (respectively for the debt, revenue and expenditure variables).13
According to the ADF tests (see Table B1 in Appendix B), the first difference of the
stock of public debt seems to be non-stationary in most countries, since the null of a
unit root is rejected at the five per cent level of significance only for Austria, Finland,
France, the UK and Sweden, indicating that the solvency condition would not be
satisfied for ten out of the 15 EU15 countries. At the ten per cent level of significance,
the non-stationarity hypothesis would also be rejected for Germany and the
Netherlands. A similar result is obtained by the PP test, where the unit root
assumption is rejected at the five per cent level only for Austria, Ireland, Luxembourg
and Sweden. The Ng-Perron test more or less confirms this, suggesting that real
12
These tests are sufficiently well known, and the reader will find references at the end of the paper. 13
government debt is not stationary at the five per cent level for most EU15 countries
except for Austria, Finland, Germany, the Netherlands, Sweden and the UK.
Additionally, one notices that these results are in line with the ones reported by
Afonso (2005a) for the period 1970-2003.14
The KPSS test that considers the null hypothesis of stationarity against the alternative
unit root hypothesis confirms these results. Finally, the results given by the ERS test
are in accordance with the previous ones and favour the non-stationarity of the first
difference of the stock of government debt for EU15 countries, with the notable
exceptions of Austria, Finland, France, the Netherlands, Sweden and the UK.15
Concerning the general government expenditure and revenue-to-GDP ratios, four
standard unit root tests out of five (the ADF, PP, Ng-Perron and ERS tests) indicate
that the two series would be non-stationary in levels for most countries. Note that the
ERS test is similar to an ADF "t" test, as performed by Dickey-Fuller, but has the best
overall performance in terms of small-sample size and power, dominating the
ordinary Dickey-Fuller test. The problem here is that the test critical values are
calculated for 50 observations and may not be accurate for a sample size with a time
dimension of 37 observations. Consequently, the results obtained with this test may
be questionable. The KPSS test provides relatively similar results for general
government revenues (which are found to be non-stationary at the five per cent level
of significance except for Germany, Ireland, the Netherlands and UK), but the
opposite results for general government expenditures (which appear to be stationary at
the five per cent level of significance except for Finland, France, Ireland, Portugal and
Spain).
4.2. Individual unit root tests allowing for structural breaks
The results obtained in the previous section are based on the assumption that no
structural break exists in the series under consideration. However, it is now
14
According to Afonso (2005a), general government revenues and expenditures are cointegrated only for Austria, Finland, Germany and the Netherlands, but the cointegration coefficient is quite below unity. Furthermore, for Belgium, Denmark, Portugal and the UK, there are significant structural breaks in the cointegration relationship.
15
Note that as it is a one-sided unit root test, with the alternative H1:ρ<1, a calculated statistic smaller than the
established that examining time series for the presence of structural breaks is an
important component of any empirical analysis. Indeed, the standard unit root tests
have serious power distortions in the presence of structural breaks, which could be the
case, for instance, for Germany following reunification in 1990. For this reason, we
now investigate this issue, using two endogenous unit root tests for structural breaks,
the Zivot and Andrews (1992) and the Lumsdaine and Papell (1997) tests.16
We use the C version of the sequential trend break model proposed by Zivot and
Andrews (1992) to investigate the presence of a unit root in the first difference of the
stock of public debt at 1995 constant prices, and the general government expenditure
and the general government revenue-to-GDP ratios. This model combines the
one-time change in the level and the slope of the trend function of the series. Hence, to test
for a unit root against the alternative of a one-time structural break, Zivot and
Andrews use the following regression equation:
1
1
1,..., k
t t t t j t j t
j
Y α Y− βt θDU γDT d Y− ε t T
=
∆ = + Φ + + + +
∑
∆ + = , (8)where DUt is an indicator dummy variable for a mean shift occurring at each possible
break-date (TB), while DTtis the corresponding trend shift variable. Formally, DUt =1
if t >TB and 0 otherwise; and DTt = t-TB if t >TB and 0 otherwise. The ∆Yt-j terms on
the right-hand side of the above equation allow for serial correlation and ensure that
the disturbance term is white noise.
The null hypothesis of the test is Φ=0, which implies that the series Yt contains a unit
root with a drift that excludes any structural break, while the alternative hypothesis
Φ<0 implies that the series is a trend-stationary process with a one-time break occurring at an unknown point in time. The Zivot and Andrews method regards every
point as a potential break-date (TB), and runs a regression for every possible
break-date sequentially.
16
In applying the Zivot and Andrews (1992) test, some region must be chosen such that
the end points of the sample are not included, because in the presence of these end
points, the asymptotic distribution of the statistics diverges to infinity. Zivot and
Andrews suggest the “trimming region” [0.15, 0.85]. Among all possible break-points
(TB), the procedure selects as its choice of break-date (TB*) the date for which the
ADF t-statistic (the absolute value of the t-statistic for Φ) is maximised.
Although asymptotic critical values are available for this test, Zivot and Andrews
warn that with small sample sizes (such as the one we are using for our fiscal
sustainability analysis) the distribution of the test statistic can deviate substantially
from its asymptotic distribution. To circumvent this distortion, ‘exact’ critical values
for the test are computed following the methodology advocated in Zivot and Andrews
(1992, p. 262).
The results of the test by Zivot and Andrews (1992) together with exact critical values
are reported in Tables C1, C2 and C3 of Appendix C, respectively for the first
difference of the stock of government debt, government expenditure and government
revenue series. The outcome clearly favours the non-stationary hypothesis. Indeed, at
the five per cent level of significance the test allows the rejection of the unit root
hypothesis in the stock of government debt for Finland and the UK, in general
government expenditures only for Finland, France, Luxembourg, Portugal, and Spain,
and cannot reject it in the general government revenues for all EU15 countries.
A possible problem with the Zivot and Andrews (1992) test is the loss of power if
there are two structural breaks in the series.17 Lumsdaine and Papell (1997) explore
this possibility by extending Zivot and Andrews’s models to allow for two
endogenous breaks under the alternative hypothesis and additionally to accommodate
for breaks in the level and the trend. Series are generally interpreted as broken trend
stationary if the null unit root hypothesis is rejected in favour of the alternative of two
breaks. More precisely, model C of Zivot and Andrews (1992), as used previously and
17
extended by Lumsdaine and Papell (1997) (model CC, which allows for two breaks in
the intercept and slope of the trend), is written as follows:
1 1 1 1 1 2 2 2 2
1
1,..., k
t t t t t t j t j t
j
Y α Y− βt θDU γ DT θ DU γ DT d Y− ε t T
=
∆ = + Φ + + + + + +
∑
∆ + = , (9)where DU1t and DU2t are indicator dummy variables for a mean shift occurring
respectively at time (TB1) and (TB2) with TB2 > TB1+ 2, while DT1t and DT2t are the
corresponding trend shift variables. Formally, DU1t =1 if t >TB1 and 0 otherwise; and
DU2t =1 if t >TB2 and 0 otherwise. In the same way, DT1t = t-TB1 if t >TB1 and 0 and
otherwise; and DT2t = t-TB2 if t >TB2 and 0 and otherwise. As in the previous test, the
∆Yt-j terms on the right-hand side of the above equation allow for serial correlation
and ensure that the disturbance term is white noise. Note that the break points are
chosen using the same approach as in the one break case, and that the critical values
are generated as in the case of the Zivot and Andrews(1992) test.
The Lumsdaine and Papell (1997) two-break test results are reported in Tables C1, C2
and C3 of Appendix C, again respectively for the first difference of the stock of public
debt, government expenditure, and government revenue. Here, two important results
emerge. First, by allowing for two structural breaks it is not possible to reject the unit
root null hypothesis in the general government expenditure as well as in the general
government revenue series for all EU15 countries, at the five per cent level of
significance. A similar result is obtained for the stock of public debt for most EU
countries except Finland and Germany.
Second, in the majority of cases the results of the Lumsdaine and Papell (1997)
two-break test are in accordance with those previously obtained with the Zivot and
Andrews (1992) one-break test, which is a relatively satisfactory result. For instance,
no statistically significant structural break can be detected by the two tests in the
general government expenditures. The two tests are also able to detect a structural
break for Finland and for the UK in the first difference of the stock of government
debt, and the date break found is the same for Finland (1991). Of course, some
series for several EU15 countries. Finally, it may be relevant to note that the years
selected as the break points for Finland and Germany in the government debt variable
were 1991, a period closely related to an economic downturn in the former country,
where the government stepped in to solve the banking crisis, and to reunification in
the latter.
4.3. First generation panel unit root tests (cross-country independence)
In addition to the previous unit root tests applied to individual series, we have also
carried out a set of panel data unit root test the robustness of the degree of integration
of our series. In this sub-section, we implement more particularly the following panel
data unit root tests (Breitung, 2000; Hadri, 2000; Im, Pesaran and Shin, 1997, 2003;
Levin, Lin and Chu, 2002; Maddala and Wu, 1999; Choi, 2006; and Moon and
Perron, 2004). Note that all tests except the last two are “first generation” panel data
unit root tests.
First, we used the test proposed by Im, Pesaran and Shin (2003, hereafter IPS), which
has been widely implemented in empirical research due to its rather simple
methodology and alternative hypothesis of heterogeneity. This test assumes
cross-sectional independence among panel units (except for common time effects), but
allows for heterogeneity in the form of individual deterministic effects (constant
and/or linear time trend), and heterogeneous serial correlation structure of the error
terms. Tables 2, 3 and 4 report the results of the IPS test for the government debt, and
for the revenue and expenditure ratio series. In order to facilitate comparisons, we
also provide the results of five other panel unit root tests: Levin, Lin and Chu (2002),
Breitung (2000), and Fisher-type tests using ADF and PP tests (Maddala and Wu,
1999, hereafter MW; and Hadri, 2000).
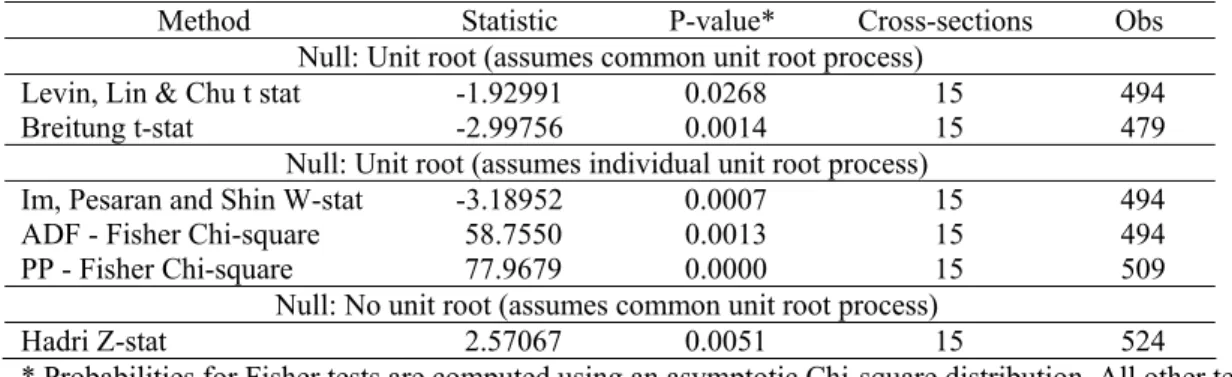
Concerning the first difference of the stock of government debt, the results given by
the panel data unit root tests are more concomitant than those provided by the
standard (individual) unit root ones. Indeed, at the five per cent level of significance,
five panel data tests out of six (with the exception of the Hadri test) reveal that the
null unit root hypothesis can be rejected at the five per cent level for EU15 countries
government debt and hence the non-rejection of the solvency condition for the overall
country sample.18
Table 2 – Summary of panel data unit root tests for the first difference of the stock of government debt, constant prices (1970-2006)
Method Statistic P-value* Cross-sections Obs
Null: Unit root (assumes common unit root process)
Levin, Lin & Chu t stat -1.92991 0.0268 15 494
Breitung t-stat -2.99756 0.0014 15 479
Null: Unit root (assumes individual unit root process)
Im, Pesaran and Shin W-stat -3.18952 0.0007 15 494
ADF - Fisher Chi-square 58.7550 0.0013 15 494
PP - Fisher Chi-square 77.9679 0.0000 15 509
Null: No unit root (assumes common unit root process)
Hadri Z-stat 2.57067 0.0051 15 524
* Probabilities for Fisher tests are computed using an asymptotic Chi-square distribution. All other tests assume asymptotic normality.
Automatic selection of lags based on SIC. Newey-West bandwidth selection using a Bartlett kernel
As far as the general government revue-to-GDP ratio is concerned, five panel data
tests out of six (with the exception of the Breitung test) produce significant evidence
in favour of their integration of order one for all EU15 countries at the 5 per cent level
of significance (see Table 3). In other words, the non-stationarity of the
revenue-to-GDP ratio cannot be rejected.
Table 3 – Summary of panel data unit root tests for general government
revenue-to-GDP ratios(1970-2006)
Method Statistic P-value* Cross-sections Obs
Null: Unit root (assumes common unit root process)
Levin, Lin & Chu stat -0.77258 0.2199 15 534
Breitung t-stat -2.57515 0.0050 15 519
Null: Unit root (assumes individual unit root process)
Im, Pesaran and Shin W-stat 2.09943 0.9821 15 534
ADF - Fisher Chi-square 20.8225 0.8934 15 534
PP - Fisher Chi-square 20.1458 0.9127 15 537
Null: No unit root (assumes common unit root process)
Hadri Z-stat 9.94807 0.0000 15 553
* Probabilities for Fisher tests are computed using an asymptotic Chi-square distribution. All other tests assume asymptotic normality.
Automatic selection of lags based on SIC. Newey-West bandwidth selection using a Bartlett kernel
18
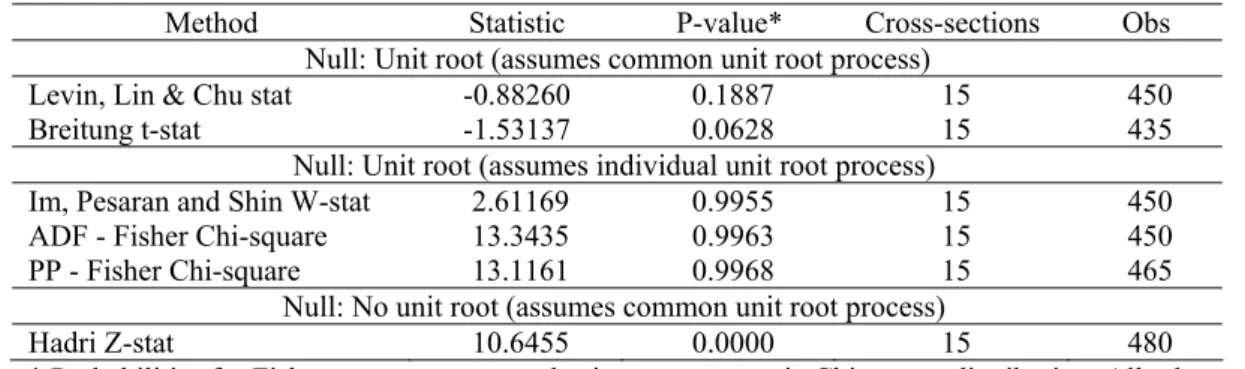
Finally, and according to Table 4, the general government expenditure-to-GDP ratio
also appears to have a unit root for all countries at the 5 per cent level of significance
if one refers to the results of all panel data unit root tests.
Table 4 – Summary of panel data unit root tests for general government
expenditure-to-GDP ratios(1970-2006)
Method Statistic P-value* Cross-sections Obs
Null: Unit root (assumes common unit root process)
Levin, Lin & Chu stat -0.88260 0.1887 15 450
Breitung t-stat -1.53137 0.0628 15 435
Null: Unit root (assumes individual unit root process)
Im, Pesaran and Shin W-stat 2.61169 0.9955 15 450
ADF - Fisher Chi-square 13.3435 0.9963 15 450
PP - Fisher Chi-square 13.1161 0.9968 15 465
Null: No unit root (assumes common unit root process)
Hadri Z-stat 10.6455 0.0000 15 480
* Probabilities for Fisher tests are computed using an asymptotic Chi-square distribution. All other tests assume asymptotic normality.
Automatic selection of lags based on SIC. Newey-West bandwidth selection using a Bartlett kernel
However, as shown by several authors (notably O’Connell, 1998; and Banerjee,
Marcellino and Osbat, 2004, 2005), the assumption of cross-sectional dependence
limited to the case of common time effects on which the asymptotic results of the
IPS's procedure relies (like most panel data unit root tests of “the first generation”,
including Maddala and Wu, 1999; Levin, Lin and Chu, 2002; and more generally all
previous six panel data unit-root tests) is often unrealistic and can be at odds with
economic theory and empirical results. Besides, as shown in two simulation studies
by Banerjee et al. (2004a, 2004b), if panel members are cross-correlated or even
cross-sectionally cointegrated, all these tests experience strong size distortions and
limited power This point is analytically confirmed by Lyhagen (2000) and Pedroni
and Urbain (2001).
4.4. Second generation panel unit root tests (cross-country dependence)
As Breitung and Pesaran (2005) note, time series are contemporaneously correlated in
many macroeconomic applications using country or regional data. Prominent
examples of this are the analysis of purchasing power parity and output convergence
(see for instance Pesaran, 2004). However, the literature on how to model
can arise due to a variety of factors, such as omitted observed common factors, spatial
spillover effects, for example via integrated financial markets, unobserved common
factors, or general residual interdependence, all of which could remain even when all
observed and unobserved common effects have been taken into account. In the EU
context, some possible cross-country dependence can be envisaged in the presence of
a similar policy measures (i.e. in the run-up to EMU), coupled with similar fiscal
behaviour (e.g. pursuing fiscal consolidation in the run-up to EMU and within the
SGP framework), and cross-country spillovers in government bond markets especially
after the completion of the single EU15 capital market from 1994 (stage 2 of EMU).
For this reason, various recent studies have proposed panel unit root tests allowing for
more general forms of cross-sectional dependency, e.g. Choi (2006), Bai and Ng
(2003), Moon and Perron (2004), Pesaran (2007) and Phillips and Sul (2003). We
have decided to investigate the presence of a unit root using two second generation
tests, namely Choi (2006) and Moon and Perron (2004), to whom we refer the reader
for further details.19 This last test in particular seems to show good size and power for
different values of T and N and model specifications, according to the Monte Carlo
experiments conducted by Gutierrez (2006).20
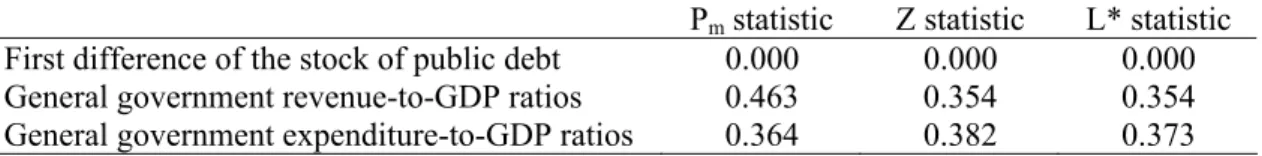
The results reported in Tables 5 and 6 indicate that the null unit root hypothesis
cannot be rejected by the two tests at the 5 per cent level for the government
expenditure and revenue ratios, but can be rejected for the government debt for all
EU15 countries, which supports the initial results produced by the first generation
panel data unit root tests. Furthermore, tests on the series in first differences confirm
the hypothesis of stationarity for government expenditure and revenue ratios.
Therefore, we may conclude that the general government revenueand
expenditure-to-GDP ratios expressed in level are integrated of order 1 for all EU15 countries,
independently of the panel unit root tests considered, thereby demonstrating that the
non-stationarity property of our revenue and expenditure series is a robust result.
19
Table 5 – Results of Choi's (2006) test a (1970-2006)
Pm statistic Z statistic L* statistic First difference of the stock of public debt 0.000 0.000 0.000 General government revenue-to-GDP ratios 0.463 0.354 0.354 General government expenditure-to-GDP ratios 0.364 0.382 0.373
Note: All figures reported in the table are P-values.
a - Note that the Pmtest is a modification of Fisher’s (1932) inverse Chi-square tests, and rejects the null unit root hypothesis for positive large value of the statistics, and that the L*is a logit test. The tests (Z and L*) reject the null for large negative values of the statistics. The P, Z and L*tests converge under the null to a standard normal distribution as (N, T →∞) (see Choi, 2006 for further details).
Table 6 – Results of Moon and Perron's (2004) test a (1970-2006)
t*a t*b
First difference of the stock of public debt 0.000 0.000 General government revenue-to-GDP ratios 0.526 0.541 General government expenditure-to-GDP ratios 0.382 0.434
Note: All figures reported in the table are P-values.
a - The null hypothesis of the two tests proposed by Moon and Perron (2004) is the unit root for all panel units. Under the null H0, they show that for ( N, T →∞) with N / T → 0, the statistics t*a
and t*b have a standard normal distribution.
4.5. Panel unit root tests allowing for structural breaks
The presence of structural breaks in panel series data can induce behaviour similar to
that of an integrated process, making it difficult to differentiate between a unit root
and a stationary process with a regime shift. For this reason, the panel unit root tests
in the previous section, such as the IPS and MW tests, may potentially suffer from a
significant loss of power if structural breaks are present in the data.
In this section, we employ the panel data unit root test based on the Lagrangian
multiplier (LM) principle developed by Im and Lee (2001), which is very flexible
since it can be applied not only when a structural break occurs at a different time
period in each time series, but also when the structural break occurs in only some of
the time series. The proposed test is not only robust to the presence of structural
breaks, but is also more powerful than the popular IPS test in the basic scenario where
no structural breaks are involved. Furthermore, as reported by Im and Lee (2001),
since the LM test loses little power by controlling for spurious structural breaks when
they are only at a suspicious level. Moreover, this panel LM test does not require the
simulation of new critical values that depend on the number and location of breaks.21
In order to provide a robust analysis, we compare both univariate and panel LM unit
root test results with and without a structural break. We begin with the Schmidt and
Phillips (1992) univariate LM unit root test without any structural change. Then, we
move to extensions that allow for one break, since our time series covers periods
during which structural change may have occurred due to structural and institutional
changes in the EU15 countries. In addition to the Schmidt and Phillips (1992)
no-break test, we employ the univariate test and the Lee and Strazicich (2003) minimum
LM unit root tests with one break to determine the structural break point in each
country. After determining the optimal break point, we employ the panel LM unit root
test of Im and Lee (2001). For comparison, we also show the panel LM test results
with no breaks.
To determine the optimal break point in the panel LM test, we utilize the univariate
minimum LM unit root tests of Lee and Strazicich (2003). These tests are comparable
to the corresponding Dickey and Fuller-type endogenous break tests of Zivot and
Andrews (1992). The performance of the LM test is comparable to or superior to
these counterpart tests in terms of size and power. In addition, the LM unit root tests
are not subject to spurious rejections under the null. In each test, the break point is
determined endogenously from the data via a grid search by selecting the break where
the value of the unit root test statistic is at its minimum. Using the minimum LM tests
of Lee and Strazicich (2003), the unit root test statistic is estimated at each break
point. The procedure is repeated over the time interval [0.1T, 0.9T] in order to
eliminate end points, until the break is determined where the unit root t-test statistic is
minimized. The optimal number of lags in each country is determined by sequentially
examining the t-statistic for the last lag coefficient to see if it is significant at the
approximate 5 per cent level in an asymptotic normal distribution. We begin with the
one-break LM test. If less than one break is significant, we employ the no-break LM
unit root test. The corresponding LM unit root test statistic is then chosen after
determining the optimal break point. After determining the appropriate unit root test
statistic for each country, the panel LM test statistic is then calculated.22
The results are reported in Tables 7, 8 and 9, which respectively show the first
difference of the stock of government debt at 2000 constant prices, and general
government expenditure and revenue taken as a percentage of GDP. For the univariate
LM test with no break, the unit root null can be rejected at the 5 per cent level of
significance in three countries for government debt (Austria, Greece and Italy), in two
countries for government expenditure (Finland and the UK), and in two countries for
government revenue (Denmark and Sweden). After allowing for a structural break,
the univariate minimum LM test rejects the unit root null in four countries for
government debt (Austria, Denmark, France and Italy), in four countries for
government expenditure (Finland, France, Italy and the Netherlands), and cannot
reject it for government revenue at the 5 per cent level.
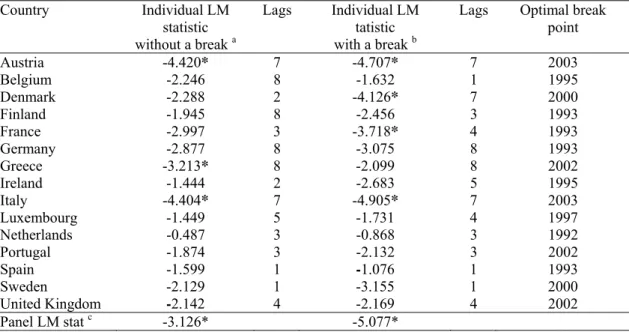
Table 7 – Panel LM unit root tests allowing for structural break for the first difference of the stock of government debt (1970-2006)
Country Individual LM
statistic without a break a
Lags Individual LM tatistic with a break b
Lags Optimal break point
Austria -4.420* 7 -4.707* 7 2003
Belgium -2.246 8 -1.632 1 1995
Denmark -2.288 2 -4.126* 7 2000
Finland -1.945 8 -2.456 3 1993
France -2.997 3 -3.718* 4 1993
Germany -2.877 8 -3.075 8 1993
Greece -3.213* 8 -2.099 8 2002
Ireland -1.444 2 -2.683 5 1995
Italy -4.404* 7 -4.905* 7 2003
Luxembourg -1.449 5 -1.731 4 1997
Netherlands -0.487 3 -0.868 3 1992
Portugal -1.874 3 -2.132 3 2002
Spain -1.599 1 -1.076 1 1993
Sweden -2.129 1 -3.155 1 2000
United Kingdom -2.142 4 -2.169 4 2002
Panel LM stat c -3.126* -5.077*
Notes: i) As all tests are one-sided, a calculated statistic smaller than the critical value leads to the rejection of the null of a unit root. At 5 per cent the critical value for the LM test without break is - 3.06. At 5 per cent the critical value for the minimum LM test with one break is - 3.566.
ii) The critical value for the panel LM test (with or without breaks) is -1.645 with an asymptotic standard normal distribution.
iii) * denotes significance at the 5 per cent level.
a) Schmidt and Phillips (1992) test; b) Lee and Strazicich (2003) test; c) Im and Lee (2001) test.
22
Without allowing for structural breaks, the panel LM test statistic is -3.126 for the
stock of real government debt series clearly indicating that the unit root null can be
rejected at the 5 per cent level of significance, due to increased power from panel data
(see Table 7). In addition, after allowing for structural breaks, the panel test statistic
of -5.95 strongly rejects the unit root null at the 5 per cent level. These results clearly
demonstrate the gain in power from combining structural breaks with panel data.
Since the panel LM test statistic is calculated using the average test statistic of all
countries, it is possible that the panel results are due to a small number of outliers
having a relatively large impact.
Examination of the univariate test statistics (with breaks) for each country reveals that
Austria, Denmark, France and Italy might qualify as such an outlier, as they are the
only four countries that reject the unit root null at the 5 per cent level. In order to see
if our panel results are robust to a possible outlier effect, we therefore recalculated the
panel LM test statistic (with breaks) omitting these four countries. The resulting panel
test statistic of -3.62 continues to reject the unit root null at the 5 per cent level of
significance, thus firmly supporting our hypothesis that the panel test results are not
due to outliers.
Concerning the general government expenditure and the revenue series taken as a
percentage of GDP, it appears that the panel LM test statistics with or without a break
cannot reject the null unit root hypothesis at the 5 per cent level of significance, thus
Table 8 – Panel LM unit root tests allowing for structural break for general government revenue-to-GDP ratios (1970-2006)
Country Individual LM
statistic without a break a
Lags Individual LM statistic
with a break b
Lags Optimal break point
Austria -2.667 2 -2.957 2 1989 Belgium -1.627 3 -2.313 3 1990 Denmark -2.128 6 -2.467 6 1989 Finland -3.901* 8 -3.806* 8 2001 France -3.063 4 -4.205* 6 1995 Germany -1.593 7 -2.492 8 1998 Greece -1.292 0 -1.443 0 1992 Ireland -0.916 5 -0.346 8 1997 Italy -2.284 8 -3.950* 8 1991 Luxembourg 0.502 8 0.362 8 1992 Netherlands -2.070 2 -4.168* 8 1992 Portugal -1.674 0 0.105 8 1988
Spain -1.928 0 -1.577 8 1983
Sweden -0.595 6 -0.811 8 1991
United Kingdom -3.156* 6 -2.141 5 1987
Panel LM stat c -0.292 -1.62
Notes: i) As all tests are one-sided, a calculated statistic smaller than the critical value leads to the rejection of the null of a unit root. At 5 per cent the critical value for the LM test without a break is - 3.06. At 5 per cent the critical value for the minimum LM test with one break is - 3.566.
ii) The critical value for the panel LM test (with or without breaks) is -1.645 with an asymptotic standard normal distribution.
iii) * denotes significance at the 5 per cent level.
a) Schmidt and Phillips (1992) test; b) Lee and Strazicich (2003) test; c) Im and Lee (2001) test.
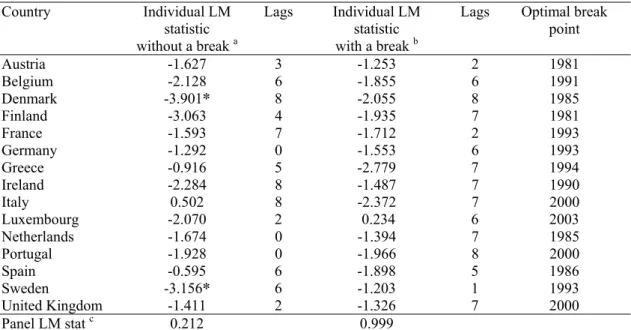
Table 9 – Panel LM unit root tests allowing for structural break for general government expenditure-to-GDP ratios (1970-2006)
Country Individual LM
statistic without a break a
Lags Individual LM statistic
with a break b
Lags Optimal break point
Austria -1.627 3 -1.253 2 1981 Belgium -2.128 6 -1.855 6 1991 Denmark -3.901* 8 -2.055 8 1985 Finland -3.063 4 -1.935 7 1981 France -1.593 7 -1.712 2 1993 Germany -1.292 0 -1.553 6 1993 Greece -0.916 5 -2.779 7 1994 Ireland -2.284 8 -1.487 7 1990 Italy 0.502 8 -2.372 7 2000 Luxembourg -2.070 2 0.234 6 2003 Netherlands -1.674 0 -1.394 7 1985 Portugal -1.928 0 -1.966 8 2000
Spain -0.595 6 -1.898 5 1986
Sweden -3.156* 6 -1.203 1 1993
United Kingdom -1.411 2 -1.326 7 2000
Panel LM stat c 0.212 0.999
Notes: i) As all tests are one-sided, a calculated statistic smaller than the critical value leads to the rejection of the null of a unit root. At 5 per cent the critical value for the LM test without a break is - 3.06. At 5 per cent the critical value for the minimum LM test with one break is - 3.566.
ii) The critical value for the panel LM test (with or without breaks) is -1.645 with an asymptotic standard normal distribution.
iii)) * denotes significance at the 5 per cent level.
Overall, our findings using panel data unit root tests that allow for structural breaks
support the previous results of first and second generation panel data unit root tests,
leading us to conclude that the stock of government debt series is integrated of order
zero (indicating that the solvency condition would be satisfied for the EU15
countries), and that the general government expenditure and the revenue series are
integrated of order one. These findings are summarized in Table 10.
Table 10 – Summary of stationarity tests, 5 per cent level of significance
(H0: unit root, non-stationarity, for most cases)
Set of results
1st difference of stock of real government debt (2000 constant prices)
1 Individual unit root tests
ADF, no unit root: AT, FI, FR, UK, SW
PP, no unit root: AT, IR, LU, SW 2 Individual unit root
tests, with breaks
Zivot-Andrews (1992), no unit root: FI, UK
Lumsdaine-Papell (1997), no unit root: FI, DE, UK 3 Panel unit root 1st
generation tests, country independence
Levin-Lin-Chu, Breitung, Im-Pesaran-Shin, ADF, PP: no unit root, stationarity.
Hadri, unit root. 4 Panel unit root 2nd
generation tests, country dependence
Choi (2006): no unit root.
Moon-Perron (2004): no unit root.
5 Individual LM unit root tests
Schmidt-Phillips (1992), no breaks, no unit root: AT, GR, IT
Lee-Strazicich (2003), with breaks, no unit root: AT, DK, FR, IT
6 Panel LM unit root tests Im-Lee (2001), no breaks: no unit root.
Im-Lee (2001), with breaks: no unit root.
General government revenue (% of GDP)
General government expenditure (% of GDP) 7 Individual unit root
tests
ADF, no unit root: AT, DE, LU, SW
PP, no unit root: AT, FI, DE, LU, SW, UK
ADF, no unit root: DE, UK PP, no unit root: DE, LU, PT, UK
8 Panel unit root 1st generation tests, country independence
Levin-Lin-Chu, Im-Pesaran-Shin, Hadri, ADF, PP: unit root, non-stationarity. Breitung, no unit root.
Levin-Lin-Chu, Breitung, Im-Pesaran-Shin, Hadri, ADF, PP: unit root, non-stationarity.
9 Panel unit root 2nd generation tests, country dependence
Choi (2006) and Moon-Perron (2004): unit root.
Choi (2006) and Moon-Perron (2004): unit root.
10 Individual LM unit root tests
Schmidt-Phillips (1992), no breaks, no unit root: FI, UK. Lee-Strazicich (2003), with breaks, no unit root: FI, FR, IT, NL.
Schmidt-Phillips (1992), no breaks, no unit root: DK, SW. Lee-Strazicich (2003), with breaks, no unit root: reject for all countries.
11 Panel LM unit root tests Im-Lee (2001), no breaks: unit root.
Im-Lee (2001), with breaks: unit root.
5. Cointegration between government expenditure and revenue ratios
After having confirmed the non-stationarity of our series of government revenue and
expenditure for the EU15 as a whole, in particular if one refers to the panel data unit
root tests of the previous section, it is natural to test the existence of a structural
long-run relationship between both series. This is the procedure we use in this section to
assess fiscal sustainability on the basis of the intertemporal budget constraint as given
in (7).
Compared to panel unit root tests, the analysis of cointegration in panels is still at an
early stage of development. So far, the focus of the panel cointegration literature has
been on residual-based approaches, although there have been a number of attempts to
develop system approaches as well. As is the case for panel unit root tests, panel
cointegration tests are based on homogeneous and heterogeneous alternatives. The
residual-based tests were developed to ward against the spurious regression problem
that can arise in panels when dealing with I(1) variables. Such tests are appropriate
when it is a priori known that at most there can be only one within-group
cointegration in the panel. Notable contributions to this strand of the literature include
Kao (1999), Pedroni (1999, 2000, 2004), and more recently Westerlund and Edgerton
(2007) and Westerlund (2005, 2007). System approaches are required in more general
settings where more than one within-group cointegrating relation might be present,
and/or unobserved common I(1) factors exist. Recent contributions in this area
include the work of Larsson, Lyhagen and Lothgren (2001), Groen and Kleibergen
(2003) and Breitung (2005), who has generalized the likelihood approach introduced
in Pesaran, Shin and Smith (1999).
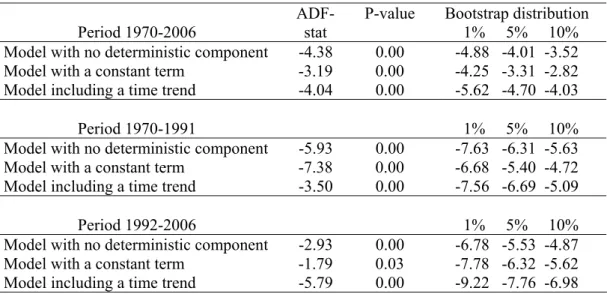
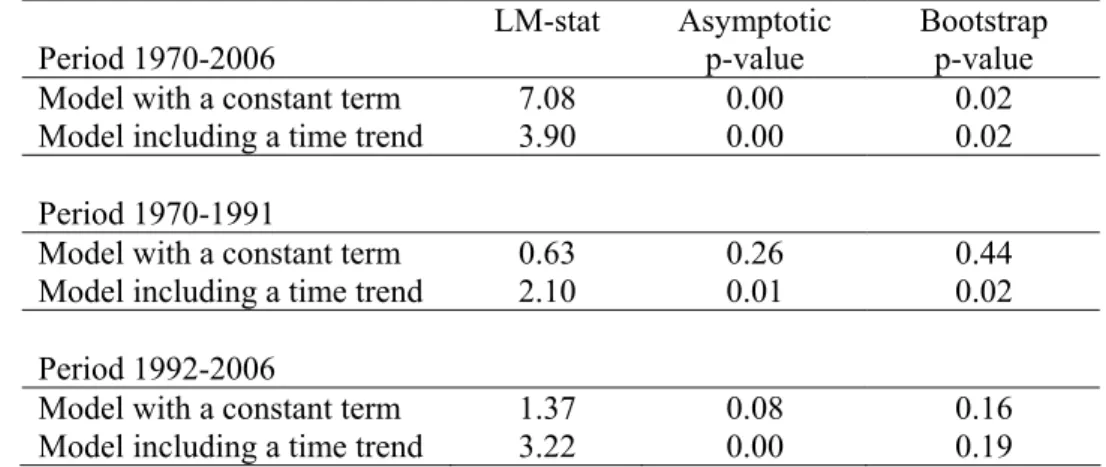
The computation of the Pedroni test statistics assumes cross-sectional independence
across individual units (apart from common time effects), an assumption that, as we
have already mentioned, is probably absent for many macroeconomic time series. To
take into account the possible cross-sectional dependence when carrying out the
cointegration analysis, we decided to compute the bootstrap distribution of Pedroni’s
test statistics, thereby generating data-specific critical values. As in Banerjee and
Carrion-i-Silvestre (2006), we have of course not used the seven statistics proposed