ISCTE- IUL – School of Social Sciences Department of Social and Organizational Psychology
Gluten, With or Without It –
The Impact of Color of “Gluten-Free” and “With-Gluten” Claims in Food Perception.
Filipe Alexandre Recto Rosendo
Dissertation submitted as partial requirement for the conferral of Master in Social and Organizational Psychology
Supervisor:
Dr. Marília Prada, Invited Assistant Professor ISCTE – Instituto Universitário de Lisboa
AGRADECIMENTOS
Quero começar por agradecer aos meus pais. Não por esta dissertação, não pelo mestrado ou outro momento em específico. Agradeço-lhes por fazerem de mim quem sou hoje, por me encherem de objetivos e de sonhos por concretizar; São os responsáveis por ter em mim próprio a vontade para continuar, por olhar em frente, por procurar mais desafios e concluir mais etapas - sejam elas quais forem.
Aos meus avós, por todo o apoio, por serem o meu porto mas, acima de tudo, pelo orgulho que têm em mim, obrigado.
Gostava também de agradecer aos meus amigos, à Folia, aos de Sintra e aos do ISPA-IU, os que vejo todos os dias e os que vejo de tempo a tempo. Pelas experiências do passado e pelas que ainda hei de viver com eles; porque tudo o que retiro delas me fazem ser mais de mim. Todos são importantes, desde os que estão comigo agora, aos que as circunstâncias foram deixando para trás.
Gostava de dedicar um especial obrigado à minha prima, pela paciência, pelos cafés infinitos e por gostar tanto de partilhar o seu tempo comigo como eu gosto de partilhar o meu com ela. Por ser a irmã que sempre esteve comigo.
No que respeita à realização desta dissertação, gostaria ainda de agradecer ao designer gráfico, Nuno Porto, que dedicou do seu tempo para ajudar à criação das imagens e rótulos utilizados neste trabalho e, sem dúvida, à minha orientadora, Profª Marília Prada, pela disponibilidade e todo o acompanhamento ao longo deste (extenso) processo.
Nenhum destes obrigados é mais relevante que outro. Todos eles me trouxeram até aqui e todos me vão levar mais longe. Obrigado a todos.
RESUMO
Várias modas emergem frequentemente no que diz respeito à alimentação saudável e os produtos livres de glúten são uma das mais relevantes atualmente. A presente investigação tem como objetivo entender o impacto da informação relativamente à presença ou ausência deste componente nas embalagens de produtos alimentares (rótulos “com glúten” e “sem glúten”) na perceção dos alimentos. Propomo-nos ainda a entender de que forma a manipulação da cor deste rótulo (verde vs. vermelho) pode influenciar tais avaliações. Neste estudo experimental conduzido online (Qualtrics) colaboraram voluntariamente 370 participantes (77.6% mulheres, MIdade = 28.57 DP = 10.61) distribuídos aleatoriamente pelas seis condições resultantes do delineamento : 3 (livre de glúten; contém glúten; control) x 2 (verde; vermelho). A tarefa consistia em avaliar um conjunto de 12 exemplares de produtos alimentares (e.g., diferentes tipos de pão e bolachas) relativamente à sua salubridade, teor calórico e sabor. Verificou-se que os participantes tendem a considerar mais saudáveis e menos calóricos os alimentos que possuem o rótulo “sem glúten” comparativamente a alimentos sem qualquer rotulagem. Porém, a condição “com glúten” não se diferenciou significativamente diferente da condição “sem glúten” ou da de controlo. Não se verificou um impacto direto da manipulação da cor na perceção dos alimentos, nem uma interação deste fator com o tipo de rótulo. As avaliações de sabor não diferiram significativamente entre as condições de nenhuma das variáveis independentes. É ainda relevante mencionar que os sujeitos tendem a subestimar o seu conhecimento relativamente ao glúten – quando comparado com o seu conhecimento objetivo – e que estes entendem uma dieta livre de glúten como sendo superior a uma dieta convencional. Esta investigação representa uma contribuição para entender como os consumidores percebem os alimentos e de que forma este tipo de instrumentos informativos podem enviesar as suas escolhas alimentares.
Palavras-chave: Glúten, dieta livre de glúten, rotulagem alimentar, alegações alimentares, teor calórico, salubridade, sabor
Código de Classificação PsychINFO: 2323 (Visual Perception)
3900 (Psicologia do Consumidor);
ABSTRACT
Various trends emerge frequently concerning healthy eating and gluten-free products are one of the most relevant at the moment. The present research has the goal of understanding how information regarding this component (claims “with-gluten” and “gluten-free) on the package of food products impacts the consumer’s evaluations of healthiness, caloric content and taste. We also seek to understand how the manipulation of the color of this label (green and red) can lead to a change in said evaluations. In this experimental study conducted online (Qualtrics) voluntarily participated 370 subjects (77.6% women, Mage = 28.57, SD = 10.61) distributed randomly between six conditions of the design: 3 (gluten-free, with-gluten and control) x 2 (red and green). The task consisted on the evaluation of 12 items from two distinct food categories – biscuits and bakery goods. We verified that subjects tend to consider products with the claim “gluten-free” as healthier and less caloric than others without claim; the “with gluten” condition did not differ significantly from the control condition neither from the “gluten-free” one. The manipulation of color did not impact significantly any of the evaluations. Nor did de evaluations of taste differ significantly for any of the conditions of the independent variables. It is also relevant to mention that the self-evaluated knowledge of gluten tends to be underestimated – when compared to objective knowledge – and that a gluten-free diet is thought of as superior to a conventional diet. This investigation represents a contribution for the understanding of how consumers perceive aliments and how this type of informational instruments can bias their food choices.
Keywords: Gluten, gluten-free diet, food labelling, food claims, caloric content, healthiness, taste
PsychINFO Classification Codes: 2323 (Visual Perception)
3900 (Consumer Psychology);
INDEX
INTRODUCTION ... 1
CHAPTER I – THEORETICAL FRAMEWORK AND HYPOTHESIS ... 3
1.1 Diet, Health and Trends ... 3
1.2 Consumers’ Sources of Information and Product Claims ... 4
1.3 Impact of Health Information and Claims on the Consumer ... 5
1.4 Gluten and the Gluten-free Diet ... 7
1.5 Gluten-related and Free-from Claims ... 8
1.6 The Influence of Color on (Food) Risk Perception ... 9
1.7 Goals and Hypothesis ... 10
CHAPTER II – METHODOLOGY ... 13
2.1 Participants and Design ... 13
2.2 Instruments ... 14
2.3 Material ... 16
2.4 Procedure ... 18
CHAPTER III – RESULTS ... 21
3.1 Manipulation Check regarding Claim ... 22
3.2 Impact of the Credence (color and claim) on the Evaluations of Healthiness, Caloric Content and Taste ... 23
3.3 General Evaluations of Food Categories ... 25
3.4 Effect of Food Category on Evaluations of Healthiness, Caloric Content and Taste .... 26
3.5 Subjective and Objective Knowledge about Gluten ... 27
3.6 Attitudes towards a Gluten-free Diet ... 29
3.7 Correlation between Individual Characteristics and Attitudes towards a Gluten-free Diet ... 30
CONCLUSION ... 39 REFERENCES ... 41 APENDIX A – Survey ... 45
TABLE INDEX
Table 1 – Characterization of the sample ... 13
Table 2 – Set of labels used in all six conditions ... 17
Table 3 – Example image with claims from all six conditions ... 18
Table 4 – Answers to manipulation checks by condition ... 22
Table 5 – Means and standard deviations for each evaluative dimension according to claim and color ... 23
Table 6 – Means and standart deviations for each evaluative dimension according to food category ... 25
Table 7 – Differences in evaluations regarding food product category. ... 27
Table 8 – Mean answers and percentage of correct answers per food product on the assessment of knowledge of gluten ... 28
Table 9 – Attitudes towards a gluten-free diet comparing to a conventional diet ... 30
Table 10 – Pearson correlation between individual characteristics and attitudes towards a gluten-free diet ... 31
FIGURE INDEX
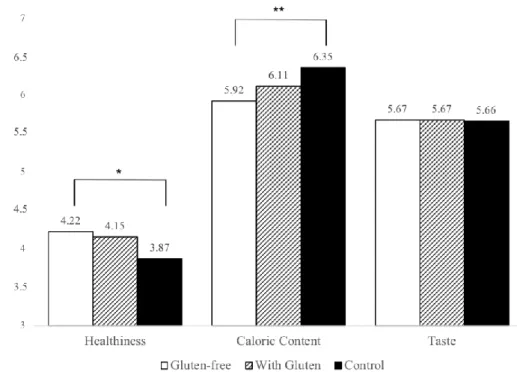
Figure 1. Comparison of mean evaluations for healthiness, caloric content and taste between categories of claim presented in the package ... 25
ACRONYMS GLOSSARY
GFD – Gluten-free Diet GF – Gluten-free
NCD – Noncommunicable Diseases NIP – Nutritional Information Panel FoPL – Front-of-Pack Labels BMI – Body Mass Index
INTRODUCTION
With the increasing awareness of consumers about the importance of living a healthy lifestyle, comes the acknowledgement of how crucial a balanced diet is in maintaining the health of an individual. Several trends emerge from time to time regarding the food
consumption habits of society and the gluten-free diet (GFD) is exponentially becoming one of those trends (Lis, Stellingwerff, Shing, Ahuja, & Fell, 2015; McCabe, 2010).
A diet free from gluten is being more and more adopted by individuals with no health conditions regarding this component (Gaesser & Angadi, 2012) and research has suggested that it is not always the healthiest option (e.g., McCabe, 2010; Quinteros-Fernandez, 2015; Worosz & Wilson, 2012). Hence, it is the scientific community’s responsibility to uncover as much of this phenomenon as possible in order to understand how to prevent potential negative outcomes from it.
For that reason, the current work tries to shine a light on a particular subject of this matter: how claims about gluten content on food packaging influence the consumer’s perception of the product. Specifically, we are interested in examining how such claims impact consumer’s perception of healthiness, caloric content and taste of food products. The present dissertation is divided into four main chapters:
1. The first chapter is dedicated to review the theoretical framework of diet trends and impact of labels and claims on the consumer. Initially we approach the emergence of health eating trends and how diet and food choices relate with the health of an individual. Then follows a topic presenting an overview of all the instruments on foodstuff’s packaging that intent to orient and give information to the consumer, detailing how claims – specifically health claims - have been framed by past literature in the array of all the different labels. A third part considers how health information and health claims have been shown to impact different aspects of food products in past studies. The following part focuses on providing a notion as to what gluten and GFD are, what health conditions surround this component, as well as characterizing how the adherence to this type of diet has been increasing. A fifth part reviews the scarce previous experimental research focused on the influence of the gluten-free (GF) claim on food perception, both internationally and for the Portuguese context. Afterwards, we clarify the impact of color on perception of risk and – considering the premises of pragmatic persuasion – how that perception can be manipulated. Finally, we state the goal and hypothesis for the present study.
2. On the second chapter we present the method used for conducting this research. Firstly, a characterization of the sample and explanation of the design of the study. Then, a description of the used instruments, the material and a detailed explanation of the procedure.
3. The third chapter concerns the analysis of results; all the statistical analysis was conducted with the usage of the software SPSS Statistics (version 24).
4. Lastly, a fourth chapter is dedicated to discussing the results and establishing a parallelism between the conclusions from the present research and others with similar goals. On a first approach, we discuss if the data supported our hypothesis and, afterwards, limitations, implications and future research directions are discussed.
CHAPTER I – THEORETICAL FRAMEWORK AND HYPOTHESIS
1.1 Diet, Health and Trends
Our dietary habits have a direct impact on our health. Indeed, healthy eating helps to prevent or to cope with some pathologies (Viana, 2002; World Health Organization, 2015). In turn, unhealthy eating habits are one of the primary causes of non-communicable diseases (NCD) which are currently the leading cause of death in modern societies (Musaiger, Al-Mufty, & Al-Hazzaa, 2014). For instance, one of this NCD is obesity, which has already reached epidemic proportions in the western societies (Campos, Doxey, & Hammond, 2011; Mancini, Marchini, & Simeone, 2016).
Nowadays, individuals are more concerned about the effect (may it be positive or negative) that certain food products can have on their health and wellbeing (Bigliardi & Galati, 2013). Food itself has gotten a lot more attention drawn to it, and there is more
information available for the lay people about several aspects such as its nutritional quality or production method. As the awareness of the impact of dietary habits on health increases, new health trends have emerged. Certain food products grow in popularity and, even if they do not cause the direct change in the subject’s eating habits, the information about the alleged
“ultimate healthy food” is spread. These constantly emerging trends may lead individuals to enroll in different eating behaviors such as opting for organic products, functional foods, going vegan, vegetarian or even adopting GFDs (Prada, Rodrigues, & Garrido, 2016).
Because of this relationship between what we eat and our overall health, this topic has been very much addressed by institutions, such as the World Health Organization, who are concerned with providing the population with information as to what healthy eating is and how to prevent diet related pathologies from occurring with so much frequency (World Health Organization, 2015).
1.2 Consumers’ Sources of Information and Product Claims
As a mean to help the population in choosing better and healthier options for its diet, some instruments were created. According to Cavaliere, Ricci, & Banterle (2015), these instruments can be divided into two categories: means of market intervention (e.g., taxes over less healthy products); and means of information (e.g., informative campaigns, nutritional education campaigns and health claims). The latter category includes the nutritional information
transmitted to the consumer through food packaging, namely the nutritional information panel (NIP), the health claims and the front-of-pack labels (FoPL) (Talati, Pettigrew, Hughes, et al., 2016). These three elements are usually positioned in different places of the package and intent to give to the consumer different types of information.
The NIP appears in the back or side of the food pack reporting the levels of some key nutrients (e.g., sugar, fiber). As for the claims, they are usually placed in front of the pack but generally only refer to a singular nutritional characteristic. In a similar way, FoPL’s, as the name implies, are also placed in the front of the package but transmit numeric information about the level of some key nutrients included in the product (Talati, Pettigrew, Hughes, et al., 2016). In this last category fits the Nutritional Traffic Lights system, which presents nutritional levels (typically regarding less healthy nutrients like fat or sugar) considering their recommended daily dosages with an association to the colors red, amber and green to
symbolize high, medium and low quantities of the component (Sacks, Rayner, & Swinburn, 2009).
Considering that understanding how claims impact the consumer is the main goal for the present paper, it is of relevance to understand them in a more detailed way. According to the review conducted by Fernqvist and Ekelund (2014), one can distinguish – among other types of credence – three main categories of claims: origin claims – which provide the consumer with clues regarding the provenance of the product (e.g., “national product”); production method claims – which transmit information concerning the methods of processing of the product until it arrives to the consumer (e.g. “organic”, “fair trade”); and health claims – which allow the inference of particular nutritional attributes in the foodstuff (e.g., “gluten-free”).
Currently, in the European Union, the inclusion of claims in food packages is regulated (Regulation No. 1924/2006) to minimize the risk of the deceitful impact that claims tend to exert on the consumers. This regulation defines claim as “any message or representation, which is not mandatory under community or national legislation, including pictorial, graphic or symbolic representation, in any form, which states, suggests or implies that a food has
particular characteristics” (Regulation No. 1924/2006, p. 11). Although this regulation
specifies a lot of details regarding this issue, in a general way it demands that such allegations are only to be made if an established nutritional profile provides enough evidence for it and if it concerns a scientifically proven beneficial nutrient. This allows for a more regulated control over the allowed type of claims, as well as for how the consumers are biased by it, topic discussed in the next chapter.
1.3 Impact of Health Information and Claims on the Consumer
According to the review conducted by Campos et al. (2011), it is safe to assume that – independently of the country – the use of labels to guide food nutrition choices is very
common and widespread among the population (typically more than 50% in most reviewed studies). Despite health claims representing only one of the many labelling categories that intent to provide the consumer with information of foodstuffs, they have been considered as one of the types of most importance for their dietary choice (for a review, see Campos et al., 2011). Being so, the persuasive impact of health claims over the consumer’s behavior is of special interest, for it may lead the consumers into making different dietary choices just for their presence.
Research has been providing evidence suggesting that consumers do value health information when considering food products. Moreover, consumers often infer properties unrelated to the claim – a bias known as the health halo effect (Chandon & Wansink, 2007). For example, Chandon and Wansink (2007) compared the caloric estimation of meals from both McDonald’s and Subway – American fast-food chains. These two restaurants diverge in how healthy they claim their food to be (with Subway delivering a more health-concerned message to the consumer). The results allow for a conclusion that this “healthy” brand positioning actually leads towards consistently biased conclusions about the caloric
estimation of a meal; with Subway receiving significantly lower estimations even when the meals were in fact 50% higher in calories. Similar results can be observed in a study addressing how providing health information (regarding antioxidant properties) influenced various perceptions towards two types of açaí juices (Sabbe, Verbeke, Deliza, Matta, & Van Damme, 2009). The results demonstrated that whenever the participants were informed about the health benefits of the product, the overall liking, perceived nutritional value, taste and purchase intention significantly improved. These findings are of particular interest because
inferring completely unrelated attributes in a food product can potentially be harmful for the consumers’ habits leading into biased and unhealthier dietary choices.
In a similar way, regarding packaging information, the presence of production method claims like “organic” – which has been extensively studied– seems to allow the inference of completely unrelated attributes like healthiness, diminished caloric content and increased tastefulness (when compared to the conventional counterparts; Prada, Garrido, & Rodrigues, 2017). A study from Lee, Shimizu, Kniffin, and Wansink (2013) also found evidence that specific nutritional components like expected fiber and fat content were positively influenced by this credence. Specifically for the case of health claims in the packaging of food products, they have also been shown to cause a positivity bias in multiple dimensions regarding the product. Research has been finding evidence of favorable influence over factors such as purchase intention, attitudes towards the product, nutritional value (Kozup, Creyer, & Burton, 2003; Lee et al., 2013) as well as healthiness (Priven, Baum, Vieira, Fung, & Herbold, 2015) and caloric content (Lopes, 2017).
Even though this halo effect has been reported multiple times, it is important to mention that not all placement of claims influence the subject in the same way, nor does the claim per se is going to make the subject dramatically change its attitude towards a specific product – some other variables are at play. In the review elaborated by Wänke and Reutner (2010), based on pragmatic persuasion, one can withdraw some possible explanations for these nuances and its underlying mechanism. The authors defend a phenomenon in which a subject is persuaded by the inferences they make from an argument (and not from the information contained in said argument). Giving examples for this specific kind of
persuasion, they argue that it is not the information itself that convinces the subject, but what he makes of it. For the ignorant receiver, presenting an argument perceived with the intention to support a specific conclusion, makes it of potential relevance for said conclusion. For example, for this specific context, if the consumer perceives the intent of placing the “high on fiber” claim on the package to be an attempt to make it more desirable, it must be a good attribute of the product, otherwise it would not be mentioned.
In this work we will focus on the impact of health claims and, more specifically, how gluten claims affect the consumer. To our knowledge at the present moment, the studies carried out on gluten claims only use the statement of its absence; using foodstuffs typically named as “free-from” products (Priven et al., 2015). In the subsequent chapter we will focus on this nutrient, providing an overview of its particularities and increasing popularity.
1.4 Gluten and the Gluten-free Diet
Regarding the aforementioned emerging healthy-eating trends, gluten is one of the food compounds that has been getting more and more attention - consequentially GF products have been increasing in variety and popularity. Portuguese retailers have addressed this higher demand by increasing the variety of GF products available. As an example, the online retailer Continente.pt now provides a special tab – with the name “Healthy and Bio” – in their website which contains GF alternatives ranging from loafs of bread to complete ready-to-eat meals. Up to now, this retailer already counts with up to 150 different products in this category.
Gluten is a general name given to a mixture of protein that can be found mainly in wheat – but also in rye and barley – which can exert a toxic effect in individuals with specific health concerns like celiac disease. This condition is a chronic systemic autoimmune disorder provoked by the permanent intolerance to this specific protein and the person’s inability to digest it in the gastric system and the only way these individuals can cope with this condition is by following a strict GFD (Green, Rostami, & Marsh, 2005; Saturni, Ferretti, & Bacchetti, 2010)
With the number of cases of celiacs increasing (Saturni et al., 2010; Worosz & Wilson, 2012) - an estimation of around 1 to 1.5% of population already being affected by this condition – and other 5 to 10% of population being diagnosed with gluten sensitivity (Lis et al., 2015; Sanders & Aziz, 2012), it is natural that the demand for gluten-free products is also growing. Nonetheless, according to Packaged Facts (2013, cit. by Lis et al., 2015) the adherence to a GFD has increased around 28% from 2008 to 2012 (data from Canada). Hence, one can understand that the general consumer – with no health restrictions related to this compound – is also opting for gluten-free products (Gaesser & Angadi, 2015).
Several factors have contributed to this increased adherence to a GFD among non-celiacs. For example, this diet has received extensive media exposure; many celebrities have been popularizing the health benefits of the GF lifestyle, books are being written on this topic and the general consumer seems to believe this idea (Marcason, 2011) and adhere to a GFD because of this advertisement (Quinteros-Fernandez, 2015).
The connection between going gluten-free and weight-loss is by far the most popular alleged benefit. Unfortunately, there is no scientific evidence to support this claim on healthy individuals (Gaesser & Angadi, 2012, 2015; Marcason, 2011). For example, a correlational study from Quinteros-Fernandez (2015) found no significant results on reported benefits for eliminating gluten when the individuals were not medically diagnosed with a gluten-related disorder. As a matter of fact, some research has been showing the opposite results. A study
conducted with celiac individuals showed that, initially overweight individuals who followed a GFD for two years ended up gaining weight (for a review, read Gaesser & Angadi, 2012).
Some other negative issues have been reported to surround the adherence to this restricted diet. Research on healthy subjects who followed a strict GFD, concluded that this diet is not always the healthiest option (McCabe, 2010; Quinteros-Fernandez, 2015; Worosz & Wilson, 2012) and that it is common for these subjects to present nutritional deficiencies such as low calorie ingestion, lack of protein, dietary fiber, minerals and vitamins (Lee, Ng, Zivin, & Green, 2007; Miranda, Lasa, Bustamante, Churruca, & Simon, 2014; Saturni et al., 2010). Furthermore, the financial impact of this diet is also very noticeable, with studies reporting the gluten-free products being two to three times more expensive than their conventional counterparts (Lee et al., 2007; Stevens & Rashid, 2008).
1.5 Gluten-related and Free-from Claims
When considering gluten claims, it is very noticeable that food products usually only include “free-from” claims. With gluten being perceived as a potential health hazard, it is starting to be understood as a risky nutrient for consumption (Priven et al., 2015). Therefore, it makes sense that the retail market opts for presenting it with the statement of its absence – potentially increasing sales with consumers aware of this characteristic. Recent examples can demonstrate this trend with products like a new Cornetto ice-cream being added to the current array solely for being gluten-free (and advertised as such) or brands like Herbal Essences shampoo opting for (and marketing) leaving out gluten in their composition. For the ice-cream example, it can be justified with being a food product directed towards people with restricted diets for medical reasons. However, considering gluten does not have known negative consequences on contact with skin (Beyond Celiac, 2018), the second example seems to constitute an example of taking advantage from the free-from label’s influence alongside the consumer.
When considering the influence of gluten-free claims on the evaluation of foodstuffs, the research is scarce; especially when compared to claims such as “organic” (for a review see Prada et al., 2017). Nonetheless, an exception for this is the study conducted by Priven et al. (2015) that presented to the participants two packages of crackers with whether no claim or a gluten-free claim, and to a different group, the same package with no claim a or fabricated false claim (MUI-free). On the two different groups the participants were asked to choose between the crackers in regard to which was healthier (the ones with the free-from claim or
the one with no claim); the option to consider them equally healthy was also given. The results point out that both the MUI-free and the gluten-free claimed products where significantly more times considered healthier than the conventional product – but did not differ significantly from each other. Hence, prior risk information about the component itself had little to no impact over how healthy subjects considered the product – the free-from claim is responsible for this effect. Being so, one can conclude that, not only does this study provide an insight of the aforementioned health halo effect regarding specifically gluten-free products, but it also allows the drawing of other interesting conclusions regarding the influence of previous information about what the product is free-from on the consumer.
As for the Portuguese context, to our knowledge and up to the moment of writing of this paper, only one study focused on the impact of the specific gluten-free claim in the evaluation of products. In this work from Lopes (2017), participants evaluated an array of four food products in regard to their healthiness, taste and caloric content. These products presented whether a gluten-free claim or no claim at all. The results pointed towards a significantly more favorable evaluation – in terms of healthiness and caloric content – for the products containing the GF claims. Curiously, this health halo effect was also found in products which are typically gluten-free – e.g., rice cakes (Lopes, 2017).
1.6 The Influence of Color on (Food) Risk Perception
Assuming that consumers may perceive gluten as a hazardous component (Priven et al., 2015), it makes sense to construe gluten-free claims as some kind of warning. This may happen especially for those who have impeding health conditions or are trying to follow a GFD for any other reason.
Therefore, having in mind the aforementioned premises of pragmatic persuasion (Wänke & Reutner, 2010), it is important to analyze how the intents of the message are perceived by the consumer. It is reasonable to argue that a claim may cause different
evaluations of the product when it is perceived as a cautionary advice or as way to favorably highlight the qualities of the product (ultimately with the purpose of increasing sales).
When reviewing possible variables (extrinsic to the subject of manipulation) that may have the capacity to influence this judgement, we came across one that represents a very common association in a subject’s day-to-day life – color. The examples where colors in our everyday life – specifically red and green – are associated with whether positive or negative messages are numerous. For example, in the case of traffic lights, green means “go” and red
means “stop”, whereas in the beach flags code green means “safe” and red means “danger”; the same type of reasoning is present for the functioning of the nutritional traffic lights explained before.
Supporting this well-spread lay association, there is empirical research showing that red is strongly associated with risk signal words (Griffith & Leonard, 1997;
Pravossoudovitch, Cury, Young, & Elliot, 2014). On the other end of the spectrum, though to a lower degree, green has been found to be associated with words like safety
(Pravossoudovitch et al., 2014), as well as very strongly related with positive emotions such as hope and calmness (Kaya & Epps, 2004).
Some research has been establishing this associations with color to also be true in the context of food. As an example, a study carried out by Rohr, Kamm, Koenigstorfer,
Groeppel-Klein and Wentura (2015) using color information in circles surrounding different food products – specifically red and green – found evidence that red elicits avoidance
behavior whereas green is more associated with approach behavior. Other studies also found this tendency to be true, with red colored plates and cups significantly reducing snack and drinks consumption when compared to blue and white ones (Genschow, Reutner, & Wänke, 2012).
Some studies have focused on the specific impact of these colors on the consumer and, even though not all results point in the same direction, some research identifies the capability of color to simplify the consumer decision making process (presenting itself as a simple clue; Hieke & Wilczynski, 2012). Furthermore, the research conducted by Schuldt (2013) on this matter shows that the presence of the color green on this type of credence (as it is seen many times on packaging) symbolizes the product as being a healthier option and having lower calories. Specifically, for the credence in food products, to the best of our knowledge, no other study has examined the combined effect of colored claims on consumer evaluation.
1.7 Goals and Hypothesis
Presenting health claims on food packaging has the potential for influencing the way an individual perceives the product and, ultimately, eating behavior. Some types of claims have been extensively studied (e.g., organic, for a review see Prada et al., 2017), whereas others – such as gluten-free – are still understudied (for an exception, see Priven et al., 2015). The relevance of examining the influence of gluten-related claims on food perception emerges
from the recent increase of adherence to GFD among non-celiac individuals as a way to attain a healthier lifestyle.
Besides replicating the results found by other studies for the gluten-free claim (Lopes, 2017; Priven et al., 2015), the present paper focuses on understanding the effects of
manipulating this claim in a way that states the presence of gluten – i.e., introducing a “contains gluten” claim. This manipulation may help us understand if, like the results of Priven et al. (2015) show, the sole introduction of the claim affects positively the evaluations of a product regardless of the information contained in it – even when this information clearly states the presence of a risky component.
Based on the principles of pragmatic persuasion (Wänke & Reutner, 2010), the variation of the color of the claim was also introduced with the intent of manipulating the perception of the subject regarding the intent of the claim. The color green was expected to draw better evaluation towards the product (Kaya & Epps, 2004; Pravossoudovitch et al., 2014), while the contrary effect was expected for the color red (Griffith & Leonard, 1997; Pravossoudovitch et al., 2014).
With this being stated, the present study focuses on examining the effects of a “gluten-free” and “with-gluten” claims with different colors – either red or green – on the evaluation of food products on three main dimensions: healthiness, taste and caloric content. As our first hypothesis, we expect to observe a main effect of type of claim on these evaluations.
However, two patterns of results are possible. First, products with any of the claims (i.e., with-gluten and gluten-free) will be evaluated more positively than the products without claims (i.e., control condition). This would mean that the claim has a value on its own and does not depend on the type of information being conveyed. In contrast, a second possibility is that the evaluation of products would show a linear trend with more positive evaluations observed for the gluten-free claim, followed by the control condition and then the with-gluten claim. This pattern would suggest that the presence of gluten is of more importance for the consumer (than the mere presence of the claim), because it is perceived as a risky component.
Moreover, we also expect to observe a main effect of the color of the label such that products with green labels would be evaluated more positively regarding healthiness, caloric content and taste than those with red labels.
Finally, we also explore if the color moderates the impact of the claim. For example, it is possible that the positive impact of the claims on the evaluation of products would be more noticeable when presented along with a green label.
CHAPTER II – METHODOLOGY
2.1 Participants and Design
The present study had the voluntary collaboration of 370 Portuguese participants1
(77.6% women), between 18 and 76 years old (M = 28.57; SD = 10.61), and most of them had completed high-school education (33.0%) or a bachelor’s degree (39.7%). Regarding their occupation, more than half of the sample were students (51.9%) or workers (45.1%). Considering their diet, the greatest majority of the sample reported not following a specific type of diet (73.0%) with the second most chosen option being weigh loss diet (15.7%). No participants reported any form of color blindness. More detailed information regarding this data can be found in the Table 1. The participants were also asked their height and weight (optional) – from which was latter calculated the Body Mass Index (BMI) – in order to better characterize the sample. According to the criteria from World Health Organization (2018), the majority of the participants sat in the normal BMI category (60.8%) and the second most prevalent category was that of overweight (19.2%).
Participants were randomly assigned to one of the six conditions resulting of the design: 3 (claim: gluten-free; with-gluten; control) x 2 (color: red; green). Both factors were manipulated between-participants.
Table 1
Characterization of the Sample
Variable Absolut Frequency (n) Relative Frequency (%)
Ocupation Student Independent Worker Dependent Worker Retired Unemployed 192 24 143 4 7 51.9 6.5 38.6 1.1 1.9 Level of Study Basic Education High School 6 122 1.6 33.0
1 The total number of participants to answer the questionnaire was 396. Nonetheless, two subjects were excluded
for being under the pre-established age of 18, 14 for stating they followed a GFD, as well as 10 for not having answered this question.
Bachelor Post-Graduation Master Doctorate 147 27 56 12 39.7 7.3 15.1 3.2 Special Diet None Weight Loss Vegetarian Vegan Other 270 58 12 2 28 73.0 15.7 3.2 0.5 7.6 BMI* Underweight (< 18.5) 18 4.9 Normal Range (18.5 – 24.99) 225 60.8 Overweight (25 – 29.99) 71 19.2 Obese ( 30) 17 4.6 Missing 39 10.5
Note. *Intervals calculated according to World Health Organization (2018).
2.2 Instruments
This research was conducted in the Portuguese context with only Portuguese speaking respondents. Being so, the following described instruments were applied in Portuguese in the questionnaire, only being translated for the purpose of the present paper. The full
questionnaire with the original measures can be found in the Appendix A (example for the category “gluten-free” x “green”).
1. Perception towards Foods
In order to evaluate the perception towards different food products, the participants used three of the ten dimensions comprised in the work of Prada, Rodrigues, Garrido, and Lopes (2017). Specifically, in the current work participants were asked to respond to the following dimensions: healthiness, caloric content and tastiness, using 9 point scales (1 = Not healthy at all/ Not caloric at all/Not tasty at all; 9 = Very healthy/Very caloric/Very tasty).
2. Diet Characterization
Because the dietary habits followed by the participants may be relevant to better understanding how they evaluate food products, two questions (adapted from Quinteros-Fernandez, 2015) regarding their diet were also included in the questionnaire for control. The
first question asked the participant if they followed any kind of special diet; some options were shown to choose from – “No”, “Fat Loss Diet”, “Vegetarian”, “Gluten-free”, “Vegan” and “Other”; in this last option an open field was provided for the participant to specify.
The second was directed towards the GDF. This question asked about the frequency of consumption of GF products, providing the respondent with a scale of nine points (where 1 = Never; and 9 = Always).
3. Attitudes towards a gluten-free diet
Five items – to be answered according to a nine point scale – were included in order to better understand the subject’s attitudes towards a GFD. This instrument was adapted from Prada, et al. (2017) and the participant was asked: “In your opinion, comparing to a
conventional diet, the gluten-free diet is…” (1 = Less caloric/Unhealthier/More adequate for weigh loss/Less transformed/Less natural; 9= More caloric/Healthier/Less adequate for weight loss/More transformed/More natural).
4. Subjective knowledge over gluten
The participant was asked to evaluate subjectively how knowledgeable they were of gluten-free products using a nine-point scale (i.e., How would you evaluate your knowledge of gluten-free products”; 1 = Little knowledge; 9 = Very knowledgeable).
5. Objective knowledge about gluten
Objective knowledge about gluten was assessed by asking participants to indicate the gluten content of a set of 16 food products. We selected these products from the foodstuff used in the “Gluten-free diet knowledge scale” developed by Silvester, Weiten, Graff, Walker and Duerksen (2016) and the check list present in Quinteros-Fernandez's (2015) research. To this list we added the type of items used in the questionnaire’s food pics (this allowed us for the assessment of knowledge directly towards the products evaluated for the present
research). Regarding these last items, because they would stand out from the others if inserted one by one by their specific name, it was opted for a more general approach; i.e., instead of using options like “chocolate chip digestive cookies” and “malted milk biscuits”, the term “wheat flour based cookies” was used to designate this specific category. The final list included nine gluten-free products (i.e., milk, balsamic vinegar, rice, cocoa, oats, rice cakes, yogurt, beans and corn) and seven gluten-containing products (i.e., wheat flour, sausages, wheat based bread, crab sticks, toasts, biscuits and bread-like products).
In this specific question, the participant was asked to state the degree as to which they were certain that the product contained gluten (1 = Certainly does not contain gluten; 9 = Certainly contains gluten). This allows us to have a continuous scale and a deeper
understanding of the certainty the participant has regarding their answers.
6. Control questions and manipulation checks
Because this research is based on an experimental design, a question was added to the questionnaire in order to assess if the manipulation between conditions had been successful (i.e., in this case, if the participant had noticed the claim in the packaging). For this, we introduced the following question “The food products you evaluated in this questionnaire…” and gave the participant four possible answers: “Contained gluten (i.e., With-Gluten)”; “Did not contain gluten (i.e., Gluten-free)”; “No information regarding gluten was shown”; and “There was information regarding gluten, but I cannot recall it”.
To better comprehend our results, some control questions were also placed in order for the participants to evaluate the food categories in which the products used in the questionnaire fit (i.e., biscuits and bakery goods). These categories were evaluated regarding seven
dimensions: arousal, valence (positive or negative), preference, familiarity, consumption frequency, desire to eat and perceived level of transformation. As an example, in the case of biscuits the question was: “Think about the category of biscuits (e.g., bread, wraps,
hamburguer buns) and indicate…”. Afterwards, a nine-point scale was provided for every dimension (1 = Not arousing at all/Very negative/I don’t like at all/I can never find it/I never eat it/I never feel desire for eating it/Not transformed at all; 9 = Very arousing/Very positive/I really like it/I find it frequently/I frequently eat it/I frequently feel desire for eating it/Very transformed).
2.3 Material
With the assistance of a professional graphic designer, we developed a set of labels related to gluten content that could either present verbal information (i.e., gluten-free and with-gluten) or not (control condition) in a green or red background (see Table 2).
Table 2
Set of labels used in all six conditions.
We selected a set of 12 images from an international retailers’ website. These images depicted bakery goods (e.g., bread roll) and biscuits (e.g., malted biscuits). We chose these products because, although they typically contain gluten, gluten-free counterparts are also likely to be available. All products belonged to the retailer’s private label, allowing for a uniform packaging style.
All images were treated in order not to show any sources of nutritional information, sign of the brand they belonged to, or other claims. This process helps insuring the least possible contaminating variables when the participant evaluates the products. Regarding the size of the images, all of them were standardized and presented with a resolution of 500 x 500 pixels in the online questionnaire.
Concerning the positioning of the claims for the manipulation, it was made sure that all claims were presented with the same size at the top right corner of all packages and,
specifically for the same image (in all six manipulation conditions), all of them were placed in the exact same spot. An example of one of these products can be found in the Table 3,
representing all six conditions.
Verbal Information
Gluten-free claim With-Gluten claim Control condition
B aac k gr ou n d C ol or Green Trigo
Table 3
Example image with claims from all six conditions.
2.4 Procedure
All procedures were conducted in agreement with the ethical guidelines issued by ISCTE-IUL. The questionnaire used in the current study was developed in the online survey platform Qualtrics. Individuals were invited (e.g., institutional email, social network
websites) to collaborate in a consumer behavior web survey about the perception and evaluation of food images.
In line with the between-subjects design of this study, each participant was only presented to one of the conditions – which were assigned automatically by the software according to the answers quotas (which were split evenly). The only part in which the
questionnaire differed between conditions was the set of 12 images presented with the rest of it being constant for all subjects.
In the first part of the survey, the participant was given a brief description of the research purpose and informed of the expected time duration for the questionnaire (i.e., 10 minutes). Informed consent information regarding the anonymity, confidentiality and the voluntary nature participation was also presented at this point. Participants were also told that they could terminate the study at any time by closing the web browser. After consenting to participate, participants were asked to provide demographical indicators (e.g., age; gender; occupation; and literary habilitations).
Claim
Gluten-free claim With-gluten claim Control condition
C
ol
or
Green
Before evaluating the products, the instructions emphasized that we were interested in participants’ opinions about the products and, therefore, there were no right or wrong
answers, and provided a brief explanation of the evaluative dimensions (healthiness, tastiness and caloric content).
Additional seven control questions were presented regarding the dimensions of
arousal, valence (positive or negative), preference, familiarity, consumption frequency, desire to eat and perceived level of transformation. The participant would be asked to evaluate these dimensions regarding the general food group of bakery goods and biscuits (separately).
Afterwards, the manipulation check for the claim, as well as the diet characterization question and the scale for measuring attitudes towards a GFD were shown. Then, followed the scales for evaluation of subjective and objective knowledge of gluten.
In the last part of the questionnaire, because it consisted mainly on the analysis of images and colors, a control question regarding vision impairments was introduced. The participant was also asked to provide their height, weight as well as information regarding what device was used to answer (i.e., computer). After completion, participants were thanked and debriefed, including contact information of the research team.
CHAPTER III – RESULTS
We included data from participants who completed the evaluation of the 12 food exemplars and that responded to the question about the type of diet. Control dimensions may present missing data (up to 9.2% missing data). Next, we present the following analyses:
(a) Manipulation checks regarding claim: In order to assess how successful the manipulation was, this section is composed by a frequency analysis of the answers to the manipulation check question according to the participant’s condition.
(b) Claim and label color influence on food perception: To examine the role played by claim and color on the evaluation of healthiness, caloric content and taste of the food
products, we conducted a 2 x 3 univariate ANOVA per dimension.
(c) General evaluations of food category: To determine if there were any differences regarding the evaluative dimensions (i.e., frequency of consumption, liking, valence,
perceived transformation and desire to eat) between the food categories of biscuits and bakery goods, a paired sample t-test was conducted.
(d) Effect of food category in the manipulations of claim and color: A 2 (product category) x 2 (color) x 3 (claim) repeated measures mixed ANOVA was conducted to understand how the different food categories could influence the manipulations of claim and color on the results for the evaluative dimensions of healthiness, caloric content and taste.
(e) Subjective and objective knowledge of gluten: Participants’ subjective knowledge was analyzed recurring to a t-test against the midpoint of the scale. Regarding objective knowledge, in order to understand if the answers were significantly different from the value representing uncertainty, the mean answer per each item in the questionnaire was subject to a one sample t-test against the midpoint of five. In order to understand if the objective
knowledge was above or below average, a score percentage of correct answers was also calculated for every item and the overall percentage was compared to 50% using a one sample t-test.
(f) Attitudes towards GFDs: With the purpose of analyzing how attitudes towards a GFD compare to those towards conventional diets, a t-test against the midpoint was
conducted for each dimension (i.e., caloric, healthy, adequate do weight loss, transformation and naturality). Posteriorly, a composite score of all dimensions was computed to simplify subsequent analysis.
(g) Correlation between individual variables and attitudes towards GFDs: Pearson correlations were calculated in order to understand the pattern of correlations between individual variables (i.e., age, body mass index, GF consumption frequency, subjective knowledge and objective knowledge) and attitudes towards a GFD.
3.1 Manipulation Check regarding Claim
Because the present research was conducted with an experimental design, a
manipulation check regarding the claim was placed in the questionnaire. In this question we asked the participant to recall what information was stated by the label on the packaging of the food products shown. Table 4 summarizes the percentual answers to this question according to the condition the participant was assigned to.
Table 4
Answers to manipulation check by claim condition.
“Contained Gluten”
“Did not contain Gluten”
“No information regarding gluten
was shown”
“There was information about gluten but I
cannot recall”
Gluten-Free 7.8% 75% 6.9% 10.3%
Control 26.7% 2.3% 55.7% 15.3%
With-Gluten 69.9% 8.9% 8.9% 12.2%
In general, we can state the majority of the participants noticed and could recall the correct information of the claim for their condition. It was in the case of the gluten-free condition that most participants correctly recalled the information in the packaging (75%); followed by the with-gluten condition (69.9%); and, lastly, the control condition (55.7%).
In all conditions more than 10% of the participants stated that they could not recall the information about gluten. This was more noticeable for the control condition (15.3%) than for the with-gluten (12.2%) or the gluten-free (10.3%) condition.
3.2 Impact of the Credence (color and claim) on the Evaluations of Healthiness, Caloric Content and Taste
In order to collect the evaluations for healthiness, caloric content and taste, the participants were asked to rate every food image presented with the claim of the condition they were attributed to. Being so, 2 (color red vs. color green) x 3 (control, gluten-free and with-gluten claim) univariate ANOVAs were conducted per evaluative dimension in order to compare the means of each condition – the results are summarized in Table 5.
Table 5
Means and standard deviations for each evaluative dimension according to claim and color.
Green Red Total
M SD M SD M SD Healthfulness Control 3.92 (1.11) 3.82 (1.16) 3.87ª (1.13) Gluten-free 4.27 (1.15) 4.18 (1.39) 4.22b (1.28) With Gluten 4.13 (1.11) 4.16 (1.28) 4.15ab (1.19) Total 4.101 (1.12) 4.051 (1.28) Calories Control 6.37 (1.14) 6.32 (1.12) 6.35ª (1.13) Gluten-free 5.98 (1.07) 5.87 (1.17) 5.92b (1.12) With Gluten 6.18 (1.06) 6.03 (1.22) 6.11ab (1.14) Total 6.191 (1.10) 6.081 (1.18) Taste Control 5.66 (1.31) 5.65 (1.16) 5.65ª (1.23) Gluten-free 5.65 (1.17) 5.68 (1.30) 5.67ª (1.23) With Gluten 5.77 (1.09) 5.57 (.97) 5.67ª (1.04) Total 5.701 (1.19) 5.631 (1.15)
Note. Means in the same line – 1,2 (means associated with the main effect of color) – and means in the same
column – a,b,c (means associated with the main effect of claim, Bonferroni adjustment for multiple comparisons
– with identical superscripts did not differ significantly.
3.2.1 Healthiness
As expected, the type of claim influenced the evaluation of healthiness, F(2,364) = 3.02, MSE = 4.37, p = .050, ηp2 = .016, such that there was tendency for gluten-free products (M = 4.22, SD = 1.28) to be rated as healthier than products in the control condition (M = 3.87, SD = 1.13), p = .064 (see Figure 1). Noteworthy, gluten-free products did not differ
from with-gluten products (M = 4.15, SD = 1.19), p = 1.000. The healthiness evaluations of with gluten products also did not differ from those in the control condition, p = .202 (Pairwise comparisons with Bonferroni correction). We did not observe a main effect of color in
healthiness ratings, F < 1, nor an interaction between claim and color, F < 1.
3.2.2 Caloric Content
Similarly to the pattern observed for the healthfulness dimension, the type of claim influenced the evaluations of caloric content, F (2,364) = 4.34, MSE = 5.58, p = .014, ηp2 = .023. The results show gluten-free products (M = 5.92, SD = 1.12) were evaluated as less caloric than the products in the control condition (M = 6.35, SD = 1.13), p = .011. No other differences were found: gluten-free products did not differ from with-gluten products (M = 6.11, SD = 1.14), p = .652, nor did the with gluten products differ from the control condition, p = .271 (Pairwise comparisons with Bonferroni correction). Again, the results do not support a main effect of color, F < 1, or of interaction between claim and color, F < 1, in the
evaluations of caloric content.
3.3.3 Taste
Unlike expected, neither the variable claim, color, or the interaction between claim and color presented an impact on the product evaluations of taste, F < 1. The products in the gluten-free (M = 5.67, SD = 1.23.), the control (M = 5.65, SD = 1.23) and the with gluten condition (M = 5.67, SD = 1.04) were evaluated as equally tasty.
Figure 1. Comparison of mean evaluations for healthiness, caloric content and taste between categories of claim
presented in the package (i.e., gluten-free, with-gluten and control). *p = .064; **p = .014
3.3 General Evaluations of Food Categories
In the current study we included exemplars of two food categories: biscuits and bakery goods. We asked participants to rate the general frequency of consumption, liking, valence, perceived transformation and desire to eat for each category. Table 6 summarizes these results.
Table 6
Means and standard deviations for each evaluative dimension according to food category.
Bakery Goods Biscuits Difference Testª
M SD M SD t(369) p Dimension Frequency 4.88 2.49 5.07 2.35 -1.31 .193 Liking 5.93* 2.21 6.62* 2.03 -5.54 < .001 Valence 4.21* 2.02 4.17* 2.02 < 1 ns Perceived Transformation 6.75* 1.99 6.92* 1.86 -1.64 .103 Desire to Eat 5.05 2.42 5.80* 2.34 -4.95 < .001
Note. * Mean differs from the scale midpoint (one sample t-tests against 5). ª Difference tests refer to the
Overall, as shown in Table 6, participants reported consuming both biscuits and bakery goods moderately. The reported desire to eat was also moderate for the category of bakery goods, but above average for biscuits. It is also noteworthy that participants rated the products negatively, despite liking them. Finally, both product categories were also rated as highly transformed.
Regarding the comparison of ratings according to the product categories, we only found differences for the liking and desire to eat dimensions, such that participants gave higher ratings to biscuits (vs. bakery goods) in both dimensions.
3.4 Effect of Food Category on Evaluations of Healthiness, Caloric Content and Taste Given that we observed differences in overall evaluations between food categories, we proposed to explore if the categories of food products (i.e., biscuits and bakery goods)
influenced how the claim and color manipulations impacted the evaluations of healthiness, caloric content and taste of the products. We conducted a 2 (product category) x 2 (color) x 3 (claim) repeated measures mixed ANOVA. The first factor was within-participants and the latter two between-participants.
3.3.1 Healthiness
We did not observe a main effect of product category on the evaluations of
healthiness, F < 1. Moreover, this factor did not interact with the variable claim, F < 1, nor with color, F < 1. The third order interaction was also non-significant, F (2,364) = 1.37, MSE = 0.95, p = .255, ηp2 = .007.
3.3.2 Caloric Content
We observed a main effect of product category on caloric content evaluations, such that biscuits (M = 6.33, SD = 1.31) were rated as higher in calories than bakery goods (M = 5.92, SD = 1.24), F(1,364) = 52.40, MSE = 32.16, p < .001, ηp2 = .126. However, product category did not interact with claim, F(1,364) = 1.39, MSE = 0.86, p = .250, ηp2 = .008, nor with color, F < 1. The third order interaction was also non-significant, F < 1.
3.3.3 Taste
Regarding the evaluations of taste, a main effect of product category was observed with biscuits (M = 6.17, SD = 1.34) obtaining higher taste ratings than bakery goods (M = 5.13, SD = 1.37), F(1,364) = 209.16, MSE = 200.46, p < .001, ηp2 = .365. Again, product
category did not interact significantly with claim, F < 1, nor with color, F < 1 and the third order interaction was also non-significant, F < 1. The discriminated values for the mixed ANOVA of all three evaluations can be found in the Table 7.
Table 7
Differences in evaluations regarding food product category.
df F (364) p Healthiness Product Category 1 0.267 0.606 Color*Product Category 1 0.01 0.978 Claim*Product Category 2 0.14 0.870 Calories Product Category 1 52.40 < .001* Color*Product Category 1 0.99 0.320 Claim*Product Category 2 1.393 0.250 Taste Product Category 1 209.16 < .001* Color*Product Category 1 0.04 0.846 Claim*Product Category 2 0.22 0.805
Note. *Significant at the p<0.01 level
Overall, as shown in Table 7, participants judged the two product categories to be different regarding their caloric content and taste. On both cases biscuits got higher ratings than bakery. No significant impact of the product category was seen on the evaluations of healthiness. Product category did not interact significantly with the variable claim nor color on the evaluations of any of the three dimensions.
3.5 Subjective and Objective Knowledge about Gluten
Overall, participants reported a low level of subjective knowledge about gluten-free products (M = 3.56, SD = 2.22), t(365) = -12.42, p < .001 (one sample t-test against the scale midpoint, 5). Importantly, we did not observe differences between conditions for this
variable, suggesting equivalent a priori knowledge, F < 1.
To assess participants’ knowledge about gluten content more objectively, we asked them to indicate how certain they were about the presence of gluten for a set of 16 products. Means higher than the scale midpoint (i.e., 5) indicate that participants were certain about the product containing gluten, whereas means lower than the scale midpoint indicate that
participants were certain that it did not contain gluten. Means that do not differ from the scale midpoint reflect uncertainty about gluten content. Results for all food products are
summarized in Table 8.
Table 8
Mean answers and percentage of correct answers per food product on the assessment of objective knowledge of gluten.
M SD Correct answers (%)ª Milk 4.34* 3.13 49.5 Balsamic Vinegar 2.65* 2.11 68.4 Wheat Flour (G) 7.92* 1.83 78.3 Rice 4.66 3.00 43.4 Cocoa 3.86* 2.57 52.5 Sausages (G) 4.47* 2.81 33.8 Oats 5.57* 2.93 30.6 Rice Wafer 4.99 2.87 39.6 Flavored Yogurt 4.64 2.87 40.7 Beans 3.50* 2.57 57.8 Wheat Bread (G) 8.11* 1.59 81.1 Crab Sticks (G) 3.68* 2.55 21.0 Toasts (G) 7.66* 1.84 76.5 Corn 4.77 2.92 42.9 Biscuits (G) 7.77* 1.64 78.8 Bread-like products (G) 7.97* 1.65 80.1
Note. (G) Products that typically contain gluten. ªTo calculate the percentage of correct answers for typically
gluten-free products we counted answers below 5. In contrast, for products that typically contain gluten, we counted answer above 5. Because the mid-point of the scale (5) represented uncertainty, this value was excluded from the percentage analysis. *Mean differs from the scale midpoint (one sample t-tests against 5), p < 0.05.
A one sample t-test against the midpoint of the scale was conducted for every product. Considering foodstuffs that typically contain gluten, the mean answers for wheat flour, wheat bread, toasts, biscuits and bread-like products are higher than and significantly different from
five (5), indicating that participants did consider the product to contain gluten. On the other hand, sausages and crab sticks scored mean answers significantly lower than five – even though they typically contain gluten – leading to the conclusion that participants believed these products to be gluten-free.
As for the gluten-free items on the list such as milk, balsamic vinegar, cocoa and beans, these scored means significantly lower than the midpoint of five (5), indicating that participants understand these items as being free from gluten. With means also significantly different from five (5), but higher than this value, oats were thought by the participants as a product that typically contains gluten.
Only gluten-free products such as rice, rice wafer, flavored yogurt and corn leaded to mean scores statistically not different from the mid-point (which represents uncertainty). This allows the conclusion that participants did not know if these products contained gluten in their composition.
Moreover, when examining Table 8, one can understand that, some of the most straight forward gluten-containing products – like wheat flour or wheat bread – got a higher percentage of correct answers – 78.3% and 81.1%, respectively – with a relatively high mean degree of certainty – 7.92 and 8.11, respectively. On the other hand, when analyzing more ambiguous products – like sausages or crab sticks – the percentage of correct answers dropped considerably – 33.8% and 21.0%, respectively.
We also analyzed the overall percentage of correct answers regarding the gluten content of products, showing that participants actually have a higher than average level of objective knowledge (M = 62.23%, SD = 16.19%), t(374) = 14.09, p < .001 (one sample t-test against scale midpoint, 50%).
3.6 Attitudes towards a Gluten-free Diet
We asked participants to report attitudes towards a GFD, by comparing it to a conventional diet regarding several aspects (healthiness, caloric content, adequate to weight loss, level of processing and naturalness).
Higher means indicate that participants reported the gluten free diet to be superior than the conventional diet in a given dimension (for this purpose, items for calories, weight loss and transformation were reverse-coded).
Table 9
Attitudes towards a gluten-free diet comparing to a conventional diet.
Dimension M SD t(365) p
Caloric (i) 5.96 1.63 11.22 < .001
Healthy 6.00 1.83 10.41 < .001
Adequate to weight loss (i) 5.61 1.80 6.47 < .001
Transformed (i) 5.55 2.05 5.13 < .001
Natural 5.36 2.02 3.36 .001
Note. (i) inverted items.
A one-sample t-test was performed against the midpoint of the scale – five (5). As shown in Table 9, overall, the GFD was perceived as superior than a conventional diet for all dimensions. Specifically, participants rated the gluten free (vs. conventional) diet as less caloric, healthier and more adequate to weigh loss purposes. Moreover, participants also reported it to be less transformed and more natural.
In order to simplify the subsequent analysis of results, a total score was computed using the five items. A reliability analysis was conducted and this scale – attitudes towards GFDs - was found to be highly reliable (5 items, = .73). Similarly, a t-test against the midpoint of five was conducted for this score. In its whole, a GFD is considered to be superior to a conventional diet (M = 5.69, SD = 1.30), t(365) = 10.20, p < .001.
3.7 Correlation between Individual Characteristics and Attitudes towards a Gluten-free Diet
We examined the association between individual characteristics (i.e., age, body mass index) and variables related to habits, knowledge and attitudes towards gluten (i.e., frequency of gluten-free products’ consumption, subjective and objective knowledge about gluten, and attitudes towards a GFD). Results are summarized in Table 10.
Results show a weak positive association between age and BMI, r = .29, p < .001, meaning that older participants are also likely to have a higher BMI.
More importantly, the reported frequency of GF consumption correlates with both subjective and objective knowledge about gluten. This association was moderate with the subjective knowledge, r = .32, p < .001, and weak with objective knowledge, r = .17, p = .002. This means that the more frequent is the consumption of gluten-free products, the more knowledgeable an individual is about the gluten content of food products.