Application of Artificial Neural Networks (ANNs)
in the Gap Filling of Meteorological Time Series
Eluã Ramos Coutinho
1, Robson Mariano da Silva
2, Jonni Guiller Ferreira Madeira
3,
Pollyanna Rodrigues de Oliveira dos Santos Coutinho
4, Ronney Arismel Mancebo Boloy
5,
Angel Ramon Sanchez Delgado
21Programa de Pós-Graduação em Ciência, Tecnologia e Inovação em Agropecuária,
Universidade Federal Rural do Rio de Janeiro, Seropédica, RJ, Brazil.
2
Departamento de Matemática, Universidade Federal Rural do Rio de Janeiro,
Seropédica, RJ, Brazil.
3
Centro Federal de Educação Tecnológica Celso Suckow da Fonseca,
Angra dos Reis, RJ, Brazil.
4
Programa de Pós-Graduação em Ciências Ambientais e Florestais,
Universidade Federal Rural do Rio de Janeiro, Seropédica, RJ, Brazil.
5
Centro Federal de Educação Tecnológica Celso Suckow da Fonseca,
Rio de Janeiro, RJ, Brazil.
Received: October 01, 2016 – Accepted: February 17, 2018
Abstract
This study estimates and fills real flaws in a series of meteorological data belonging to four regions of the state of Rio de Janeiro. For this, an Artificial Neural Network (ANN) of Multilayer Perceptron (MLP) was applied. In order to evaluate its adequacy, the monthly variables of maximum air temperature and relative humidity of the period between 05/31/2002 and 12/31/2014 were estimated and compared with the results obtained by Multiple Linear Regression (MLR) and Re-gions Average (RA), and still faced with the recorded data. To analyze the estimated values and define the best model for filling, statistical techniques were applied such as correlation coefficient (r), Mean Percentage Error (MPE) and others.
The results showed a high relation with the recorded data, presenting indexes between 0.94 to 0.98 of (r) for maximum
air temperature and between 2.32% to 1.05% of (MPE), maintaining the precision between 97% A 99%. For the relative air humidity, the index (r) with MLP remained between 0.77 and 0.94 and (MPE) between 2.41% and 1.85%, maintain-ing estimates between 97% and 98%. These results highlight MLP as bemaintain-ing effective in estimatmaintain-ing and fillmaintain-ing missmaintain-ing values.
Keywords:fault filling, meteorological data, Artificial Neural Network (ANN), Multilayer Perceptron (MLP), Multiple
Linear Regression (MLR).
Aplicação de Redes Neurais Artificiais (RNAs) no Preenchimento de
Falhas de Séries Temporais Meteorológicas
Resumo
O Referido estudo estima e preenche falhas reais em uma série de dados meteorológicos pertencentes a quatro regiões do estado do Rio de Janeiro. Para isso, foi aplicada uma Rede Neural Artificial (RNA) dePerceptronsde múltiplas camadas
(MLP). A fim de avaliar sua aptidão, foram estimadas as variáveis mensais de temperatura máxima do ar e umidade relativa do ar do período de 31/05/2002 a 31/12/2014, e comparadas com os resultados obtidos por modelos de Regressão Linear Múltipla (RLM) e Média das regiões (MD), e ainda confrontados com os dados registrados. Para analisar os valores estimados e definir o melhor modelo para preenchimento foram aplicadas técnicas estatísticas como o coeficiente de correlação (r), erro médio percentual (EMP), entre outros. Os resultados demonstraram uma alta relação
Artigo
com os dados registrados, apresentando índices entre 0,94 a 0,98 de (r) para temperatura máxima do ar e entre 2,32% a 1,05% de (EMP), mantendo a precisão entre 97% a 99%. Já para umidade relativa do ar o índice (r) com MLP se manteve entre 0,77 a 0,94, e o (EMP), entre 2,41% a 1,85%, mantendo as estimativas entre 97% a 98%. Esses resultados destacam a MLP como sendo eficaz na estimativa e preenchimento de valores faltantes.
Palavras-chave: preenchimento de falhas, dados meteorológicos, Rede Neural Artificial (RNA), Perceptron de
Múltiplas Camadas (MLP), Regressão Linear Múltipla (RLM).
1. Introduction
Studying climatic processes and atmospheric phe-nomena may require a large number of data, which are ob-tained through a set of devices, such as satellites, balloons, radars, sensors and meteorological stations. These devices operate in a constant-collection regime, obtaining data in various time periods such as minutes, hours, days or months, and thus generate a large volume.
These data have great value, both historical and for governmental organizations, private companies and aca-demic institutions. Such importance is due to the wide field of application of these data, which can be employed in areas such as civil security, agriculture, energetics, transports, ecology, health, among others.
However, the occurrence of problems in the devices leads to various measurement errors and generate inconsis-tent data or even the occurrence of gaps. According to Wanderleyet al.(2014), the lack of a continuous series of climatological data may limit the understanding of the spa-tial and temporal variability of various meteorological and hydrological processes, and also damages the characteriza-tion of the climate of a region.
Although these gaps are usual, they require great at-tention in the application of these data in studies that de-mand continuous time series. The availability of a reliable series, without gaps, is fundamental for the application of these data in different areas.
Various methodologies have been commonly em-ployed in the reconstruction of these time series. This fill-ing is performed through the substitution of missfill-ing data by values estimated through statistical and mathematical methods, such as means, spatial and/or temporal interpola-tions, linear regressions and others (Wanderley et al., 2012).
Fernandez (2007) compared the techniques of simple mean, Steurer, normal proportion and multiple linear re-gression in the prediction of missing means of air tempera-ture, relative air humidity and rainfall of thirteen stations of Rio Grande do Sul, Brazil. In 2012, the interpolation by kriging was applied in the gap filling of pluviometric data of the state of Alagoas, Brazil (Wanderleyet al., 2012).
Oliveiraet al.(2010) applied the methods of regional means, linear regression, potential regression and multiple regression in the gap filling of historical series of annual rainfall of six pluviometric stations of the state of Goiás, Brazil.
However, although these methodologies are regularly applied, some of them may require a large set of historical data and ignore the local spatial variation of the studied variables, which may ultimately generate a large amount of errors (Huth and Nemesová, 1995). In contrast, the recon-struction of incomplete time series continues to be the study object of innumerous scientific studies, which has stimu-lated the search for methodologies that are able to improve this process, such as the techniques of computational intel-ligence known as artificial neural networks (ANNs) (Wan-derleyet al., 2012).
ANNs are inspired in the neural structure of intelli-gent organisms, characterized by the recognition of pat-terns and generalization of information, besides the capacity to learn and acquire knowledge through experi-ence (Haykin, 2001). These characteristics have led ANNs to be widely used to model a series of meteorological pro-cesses, Like filling in and estimating failed data, prediction of floods, prediction of reservoir levels, climatic classifica-tions, among others. In regard to the filling and prediction of meteorological data, the application of models based on ANNs has aroused the interest of various researchers.
Therefore, the present study aimed to apply and com-pare the ANN models of Multilayer Perceptron (MLP) and Multiple Linear Regression (MLR) in the reconstruction of temporal series of meteorological data from the state of Rio de Janeiro, in Brazil.
2. Material and Methods
2.1. Studied localities
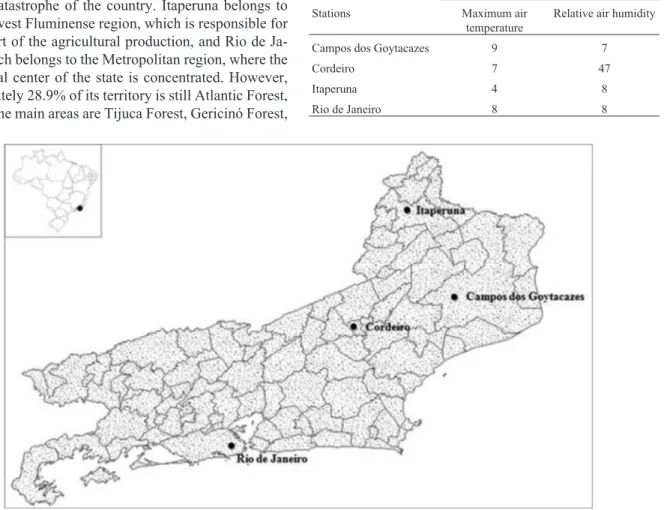
The present study used a series of meteorological data from four stations of the municipalities of Campos dos Goytacazes (CAM) (21.74° S; 41.33° W and 11.20 m), Cordeiro (COR) (22.02° S; 42.36° W and 505.92 m), Ita-peruna (ITA) (21.20° S; 41.90° W and 123.59 m), and Rio de Janeiro (RIO) (22.89° S; 43.18° W and 11.10 m), located in the state of Rio de Janeiro, Brazil (Fig. 1).
The municipality of Campos dos Goytacazes is lo-cated in the North Fluminense region of the state, and the basin where the municipality is inserted is responsible for more than 80% of the petroleum production of the country, and also stands out as a center of the sugarcane crop (Mi-randaet al., 2010; Reis Junior and Monnerat, 2002). Cor-deiro belongs to the Serrana region, which is responsible for a large part of the production of vegetables in the state. In addition, in 2011, this region suffered with the largest climatic catastrophe of the country. Itaperuna belongs to the Northwest Fluminense region, which is responsible for a great part of the agricultural production, and Rio de Ja-neiro, which belongs to the Metropolitan region, where the commercial center of the state is concentrated. However, approximately 28.9% of its territory is still Atlantic Forest, of which the main areas are Tijuca Forest, Gericinó Forest,
Pedra Branca Forest, Restinga da Marambaia, Grumari Municipal Natural Park, among others (SMAC, 2016).
2.2. Utilized data
The data set used in this study was provided by the National Institute of Meteorology (INMET). The following variables were used: monthly means of maximum air tem-perature and relative air humidity. The data were recorded in the period from May 31, 2002, to December 31, 2014, to-taling 152 records for each variable of each station. These variables were selected based on the survey of gaps that oc-curred in their historical series.
2.3. Proposed model for filling the gaps
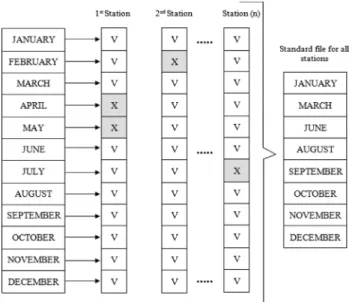
Firstly, the data collected by the stations were in-serted in an electronic worksheet program and then the gaps and inconsistencies were identified (Table 1).
After this step, the missing data were removed from all stations, ie, if a stationxof the set of stations did not have the record of the monthly mean of maximum air tem-perature or relative air humidity for the period of April 30,
Table 1- Number of gaps in the period from May 31, 2002, to December 31, 2014.
Number of months with gaps Stations Maximum air
temperature
Relative air humidity
Campos dos Goytacazes 9 7
Cordeiro 7 47
Itaperuna 4 8
Rio de Janeiro 8 8
2008, the record was removed from all other stations. This procedure guaranteed the creation of a homogeneous se-ries, causing all stations to have the same number of data and the same recorded months. Figure 2 demonstrates the applied sorting process.
After the missing data were removed, the data set was normalized, by altering the actual scale of the values to an interval between zero and one (Coutinho et al., 2016). Then, a correlation matrix between the stations was calcu-lated to confirm the degree of correlation of the utilized data sets (Table 2 and Table 3).
To compare observed values with those estimated by the techniques, the data set of each variable was divided and subjected to the models of Mean of the Regions, Multiple Linear Regression (MLR) and Multilayer Perceptron (MLP) in two parts, 70% for training/adjusting and 30% for validation. After this process, the information set of each variable was changed, becoming the standard for training the variable maximum air temperature of any of the stations had 88 data, and 38 data for validation. Relative air humid-ity, however, had a total of 62 training data and 27 valida-tion data as the standard for the stavalida-tions.
The validation step consisted in subjecting the set of estimating data to the models in order to estimate each one of the data of the variables maximum air temperature or rel-ative air humidity, and its efficiency was evaluated through statistical techniques applied to the results obtained. After confirming the capacity of the model to predict the sub-jected variable, the actual gaps were filled using data from the stations determined as estimators removed in the sort-ing process. In other words, if the station of Rio de Janeiro does not have the measurement of maximum air tempera-ture for the period of April 30, 2006, But the remaining sta-tions have it, so data from Campos dos Goytacazes, Cor-deiro and Itaperuna would be used, and in case of failure in
Campos dos Goytacazes, data from Rio de Janeiro, Cordeiro and Itaperuna would be used, and so on.
2.4. Filling methods
2.4.1. Multiple Linear Regression (MLR)
The multiple linear regression is a technique that aims to analyze or relate one dependent variables to various in-dependent variables (Fonsecaet al., 2012). The relation-ship between the dependent variable Y and other independent variables (X1,X2,X3) is formulated by the
fol-lowing linear model, Eq. (1) (Sousaet al., 2007):
Yi = +a b1X1i+b2X2i +b3X3i +ei (1)
In the present study,Yiis the variable to be estimated,
which can be maximum air temperature or relative air hu-midity,X1i,X2i,X3iare the values of maximum air
tempera-ture or relative air humidity observed by the stations used for estimation,a,b1,b2,b3are the regression coefficients
andeirepresents the independent random disturbances or
random errors (Lyraet al., 2011).
The resolution of this problem is related to the estima-tion of the values of the parametersa,b1,b2,bk, which can
be performed by the minimum squares method, which aims to determine the values ofaandbminimizing the sum of the squared errors (Sousaet al., 2007; Lyraet al., 2011).
These values can be found considering the matrix no-tation of the data, described in Eqs. (2) and (3).
Y =Xb e+ (2)
Table 2- Correlation matrix between the data of maximum air tempera-ture of the utilized regions.
Maximum air temperature Campos dos
Goytacazes
Rio de Janeiro Itaperuna Cordeiro
Campos dos Goytacazes
1.00
Rio de Janeiro 0.95 1.00
Itaperuna 0.93 0.90 1.00
Cordeiro 0.95 0.92 0.98 1.00
Table 3- Correlation matrix between the data of relative air humidity of the utilized regions.
Relative air humidity Campos dos
Goytacazes
Cordeiro Itaperuna Rio de Janeiro
Campos dos Goytacazes
1.00
Cordeiro 0.74 1.00
Itaperuna 0.80 0.90 1.00
Rio de Janeiro 0.62 0.66 0.68 1.00
Y Y Y
Y
x x x
x x x
x
n 1
2
3
11 21 31
12 22 32
13 1 1 1 K é ë ê ê ê ê ê ê ù û ú ú ú ú ú ú
= x x
x x x
a
n n n
23 33
1 2 3
1
2
3
1
M M M M é ë ê ê ê ê ê ê ù û ú ú ú ú ú ú ´ é ë ê ê ê ê b b b ù û ú ú ú ú + é ë ê ê ê ê ê ê ù û ú ú ú ú ú ú e e e e 1 2 3 K n (3)
2.4.2. Multilayer Perceptron (MLP) networks
Artificial Neural Networks (ANNs) try to emulate the biological neurons of the human brain, through a massively parallel and distributed processing, capable of learning through examples and generalizing the acquired informa-tion. ANNs calculate mathematical functions and have a natural propensity to store the knowledge from the experi-ence and make it useful. Thus, they are similar to the human brain (Härter and Velho, 2005; Robleset al., 2008; Haykin, 2001). There are various different architectures of ANNs, but the present study used the Multilayer Perceptron (MLP) network.
The MLP-type ANN is a universal approximator of functions that belongs to the feedforward class. It has been applied in different problems, such as the processing of in-formation, recognition of patterns, weather forecast, prob-lems of classification, reconstruction of missing information, processing of images and others (Shah and Ghazali, 2011).
The structure of the model is constituted by one input layer, one or more hidden layers, and one output layer. Each one of the neurons of the input layer is connected to all neu-rons in the hidden layer. Likewise, each neuron of the hid-den layer is connected to all neurons of the output layer (Wanderleyet al., 2014).
The present study adopted an architecture with four layers; one input layer, two hidden layers and one output layer. Figure 3 shows the applied model.
In the model,x1,x2andx3are the values of maximum
air temperature or relative air humidity recorded by the sta-tions used for estimation,wiare the weights associated with
the layers, andy1is the variable to be estimated, which can
be maximum air temperature or relative air humidity.
Many tests and simulations were conducted to define, through the presented results, that the first hidden layer would be established with 30 neurons and with a Hyper-bolic Tangent function, Eq. (4), while the second layer was established with 15 neurons and with a Logistic function, Eq. (5).
4) Hyperbolic Tangent Function:
( )
( )
( )
f u tgh u ui
ui
i
i
= æ è
çç 2öø÷÷ =11-+expexp-- (4)
5) Logistic Function:
( )
( )(
)
f ui = ui
+
-1
1 exp (5)
Simulations were also performed with different train-ing algorithms and the backpropagation Quasi-Newton al-gorithm was selected. This alal-gorithm is a variation of the classic backpropagation algorithm described by Haykin (2001). This method is based on the Newton’s method, but does not require the calculation of the second derivative, because it updates the approximate Hessian matrix in each iteration of the algorithm. The update is calculated as a function of the gradient. This algorithm requires more com-putation in each iteration and more storage space compared with the backpropagation method, but converges to a solu-tion in less iterasolu-tions (Gillet al., 1982).
As for the training period of the MLP model, it was defined as 4000 epochs and took an average of 10 to 20 min to converge.
2.5. Performance evaluation
To evaluate the capacity of the models to estimate the variables of maximum air temperature and relative humid-ity, statistical measures were used, such as Pearson’s corre-lation coefficient (r) Eq. (6) applied to evaluate the degree of association between estimated and observed data, the mean absolute error (MAE) Eq. (7), root-mean-square error (RMSE) Eq. (8), mean percentage error (MPE) Eq. (9), in-dex of agreement (D) and inin-dex of confidence (C) (Fonseca et al., 2012; Deshmukh and Ghatol, 2010; Pezzopaneet al., 2012).
(
)(
)
(
)
(
)
r
x x O O
N x x N O O N j j j N j j N j j N = - -´ -= = =
å
å
å
1 2 1 2 1 (6) MAE O x n j j j n=
å
=1-(7)
(
)
RMSE O x
n
j j
j n
=
å
=1 -2(8)
MPE
O x
O
n
j j
j j m
=
-´
=
å
1100 (9)
The index of confidence (C) Eq. (11) allows to ana-lyze simultaneously precision and accuracy of the obtained results. It is calculated through the product of the coeffi-cient of correlation (r) by the index of agreement (D), Eq. (10). Its values vary from zero (0), for no agreement, to one (1), for perfect agreement (Pezzopaneet al., 2012). Table 4 demonstrates the criteria for performance evaluation.
(
)
(
)
D O x
x O O O
j j
j n
j j
j n
= -
-- +
-=
=
å
å
1 1
2
1
2 (10)
(
)
C= ´r D (11)
wherenorNrepresents the number of utilized data,Ojthe
observed value, xj the value estimated by the employed
techniques,Othe mean of the observed data andxthe mean of the estimated data.
In addition to the methods used to determine the re-sults, the average (M), maximum (MAX), minimum (MIN) and standard deviation (SD) measurements of actual data and those estimated by the models.
3. Results and Discussion
3.1. Results of maximum air temperature estimates
Table 5 shows the values of M, MAX, MIN and SD of the actual data and the errors obtained by each model in the
Table 4- Criteria for evaluation and analysis of the performance of mod-els based on the index of confidence (IC).
IC value Performance > 0.85 Optimal 0.76 to 0.85 Very good 0.66 to 0.75 Good 0.61 to 0.65 Intermediate 0.51 to 0.60 Tolerable 0.41 to 0.50 Bad
£0.40 Terrible
Table 5- : Observed data and results of the estimates of maximum air temperature. Indices: mean (M), maximum (MAX), minimum (MIN), standard de-viation (SD), coefficient of correlation (r), root-mean-square error (RMSE), mean absolute error (MAE), mean percentage error (MPE), index of agree-ment (D), index of confidence (C). Models: mean of the regions (MD), multiple linear regression (MLR) and multilayer perceptron (MLP).
Actual data M MAX MIN SD
Maximum Air Temperature (CAM) 30.08 34.32 26.15 2.29 Maximum Air Temperature (RIO) 30.28 35.31 25.97 2.57 Maximum Air Temperature (COR) 27.43 32.08 23.21 2.42 Maximum Air Temperature (ITA) 30.43 35.21 26.45 2.38
Estimated Data (CAM) Models M MAX MIN SD (r) RMSE MAE MPE (%) (D) (C)
Maximum Air Temperature MD 29.73 33.74 26.39 2.07 0.96 0.67 0.54 1.86 0.97 0.94 MLR 29.82 34.12 26.16 2.25 0.97 0.55 0.44 1.48 0.98 0.96 MLP 29.87 34.00 26.20 2.29 0.97 0.49 0.40 1.34 0.98 0.96
Estimated Data (RIO) Models M MAX MIN SD (r) RMSE MAE MPE (%) (D) (C) Maximum Air Temperature MD 31.31 36.34 26.99 2.68 0.92 1.42 1.17 3.93 0.92 0.85
MLR 30.69 35.39 26.40 2.60 0.94 0.94 0.80 2.66 0.96 0.91 MLP 30.58 34.67 26.76 2.58 0.94 0.91 0.69 2.32 0.96 0.91
Estimated Data (COR) Models M MAX MIN SD (r) RMSE MAE MPE (%) (D) (C) Maximum Air Temperature MD 26.88 31.24 23.22 2.20 0.96 0.85 0.65 2.32 0.96 0.93
MLR 27.46 31.96 23.90 2.24 0.98 0.47 0.40 1.48 0.98 0.97 MLP 27.47 31.88 23.54 2.29 0.98 0.41 0.34 1.25 0.99 0.97
Estimated Data (ITA) Models M MAX MIN SD (r) RMSE MAE MPE (%) (D) (C) Maximum Air Temperature MD 30.47 35.29 26.21 2.57 0.96 0.70 0.56 1.85 0.97 0.94
validation set of the variable maximum air temperature of the regions of Campos dos Goytacazes, Rio de Janeiro, Cordeiro and Itaperuna.
It is possible to observe that although the difference presented by the statistical measures used seem to be small, it is possible to note from the results highlighted by, the er-ror measures RMSE and MAE, that the MLP obtained the smallest errors to estimate the maximum air temperature. It is also possible to verify by means of a comparison of the mean percentage error (MPE) that the MLP obtained in its estimates, data between 23% and 45% more accurate than the MD model and between 12% and 15% more accurate than the MLR.
Analyzing all the results it is observed that for the re-gion of Campos dos Goytacazes, the correlation coefficient (r) between the actual data and those estimated by the MLR and MLP models remained at 0.97, demonstrating a high correlation with the observed data. In addition, the RMSE
remained between 0.49 and 0.67 according to the MLP and MD. Another relevant factor are the values of MAE, MPE, (D) and (C), respectively equal to 0.40 °C, 1.34%, 0.98 and 0.96 for the MLP model, which characterized the precision of the previously presented results above 98% and an opti-mal index of confidence of the results of the MLP model for this region (Fig. 4).
In the estimates of maximum air temperature for the region of Rio de Janeiro, the models MLP and MLR showed (r) of 0.94, which demonstrates a high correlation with the observed data. Additionally, the models MLP and MLR exhibited MAE between 0.69 °C and 0.80 °C, and MPE between 2.32% and 2.66%, guaranteeing a precision in the estimates above 97%. Besides these parameters, the index of confidence of the results for the MLP model re-mained optimal (Fig. 4).
The estimates of maximum air temperature for the re-gion of Cordeiro also showed high correlation between
tual data and those estimated by the MLP model, exhibiting a coefficient of correlation (r) of 0.98. The results of RMSE, MAE, MPE and (C) remained respectively be-tween 0.41 and 0.85 for MLP and MD, 0.34 °C and 0.40 °C for MLP and MLR, 1.25% and 1.48% for MLP and MLR and 0.97 for MLP, which guarantees an optimal index of confidence for the estimated values. Another important as-pect observed through Table 5 is the proximity between the actual values and those estimated by the MLP model, which showed mean (M), maximum (MAX) and minimum (MIN) of 27.43 °C, 32.08 °C and 23.21 °C for the actual data, and of 27.47 °C, 31.88 °C and 23.54 °C for those estimated by the MLP model. This proximity can be observed in Fig. 4. On the other hand, for the estimates of maximum air temperature of the region of Itaperuna, the lowest values of RMSE and MAE were 0.42 and 0.32 °C, obtained with the MLP model. However, the results generated by the MLR model were almost equivalent to those of the MLP.
Never-theless, comparing M, MAX and MIN, the data estimated by the MLP model are more precise and reached values considerably close to the actual data. In addition, according to the MPE of 1.05%, the quality of the values estimated by the MLP model shows a precision of almost 99% (Fig. 4).
After analyzing the results and observing the capacity of the MLP model, the data removed in the sorting stage from the stations used in the estimates of each region were applied in the MLP model to fill the actual gaps of the esti-mated stations; as an example, the region of Campos dos Goytacazes, which used data removed in the sorting stage from its estimators, Rio de Janeiro, Cordeiro and Itaperuna, to fill its gaps.
For the region of Campos dos Goytacazes, it was pos-sible to fill eight out of the nine gaps, while for Rio de Ja-neiro it was possible to fill seven out of eight gaps. For Cordeiro, six out of the seven and, for Itaperuna, three of the four gaps (Fig. 5).
3.2. Results of relative air humidity estimates
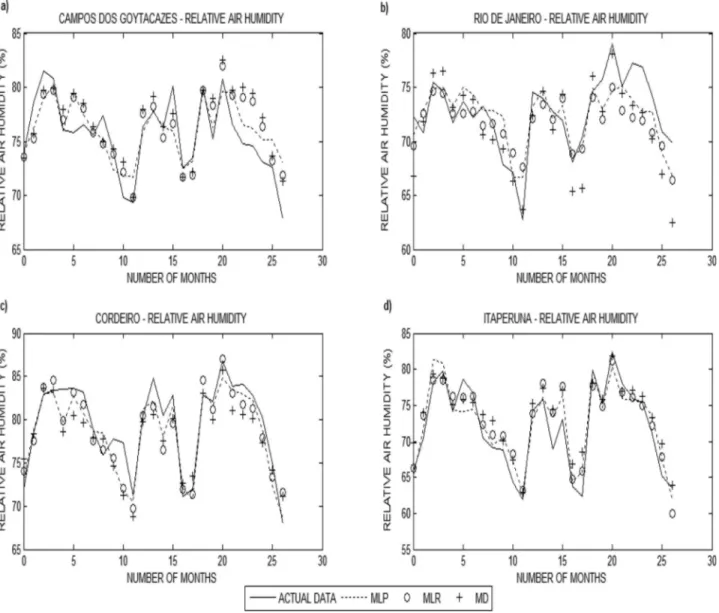
Table 6 presents the results of the estimation of the variable relative humidity of the air applying the same methodology used in the data of maximum air temperature. Analyzing the results presented by measures (r), RMSE, MAE, (D) and (C) in Table 6, it can be seen that the MLP model was superior in all the estimates in comparison to the other models. This fact can also be verified by comparing the results of the measurement of error (MPE) obtained by MLP in its estimates, where it remained between 23% and 35% more accurate than MD and between 12% and 18% more accurate Than MLR. Comparing all the model results for the estimates of relative air humidity, it is possible to verify that for the region of Campos dos Goytacazes, they showed a high relation with the data observed. However, it is still possible to observe a greater precision in the esti-mates generated with the MLP model (Table 6).Comparing the values of (r) between the MLR and MLP models, the value generated by the MLR was lower than that of MLP, 0.77 and 0.80, respectively. This demonstrates that the val-ues estimated with the MLP model remained closer to the observed data.
Another important factor demonstrated by the MLP in the estimate of relative air humidity data are the values of RMSE, MAE and MPE, which were 2.08, 1.57 and 2.11, thus confirming that MLP reached lower errors in compari-son to the other applied models, and that the values gener-ated by the MLP remained closer to 98% of precision. Figure 6 shows the data estimated by the MLP model.
For Rio de Janeiro, it was also possible to prove that the data estimated by the MLP model showed errors of RMSE, MAE and MPE lower than those of the MLR and MD models, respectively equal to 2.18, 1.74 and 2.41%, thus guaranteeing greater success in the estimates of the MLP model.
In the estimation of relative air humidity data of the region of Cordeiro, it was also possible to observe that the MLP model demonstrated superior performance, with the lowest errors and highest index of correlation (r) (Table 6). According to the results, it is also observed that the mean (M) and minimum (MIN) of the values estimated by the MLP model remained relatively close to the actual values (Fig. 6).
In regard to the estimates of relative air humidity for the region of Itaperuna, according to the parameters M,
Table 6- Observed data and results of the estimates of relative air humidity. Indices: mean (M), maximum (MAX), minimum (MIN), standard deviation (SD), coefficient of correlation (r), root-mean-square error (RMSE), mean absolute error (MAE), mean percentage error (MPE), index of agreement (D), index of confidence (C). Models: mean of the regions (MD), multiple linear regression (MLR) and multilayer perceptron (MLP).
Actual Data M MAX MIN SD
Relative Air Humidity (CAM) 75.61 81.53 67.80 3.49 Relative Air Humidity (RIO) 72.54 78.98 62.75 3.47 Relative Air Humidity (COR) 79.45 86.73 67.98 5.03 Relative Air Humidity (ITA) 71.95 82.40 61.88 6.03
Estimated Data (CAM) Models M MAX MIN SD (r) RMSE MAE MPE (%) (D) (C) Relative Air Humidity MD 76.69 82.49 69.80 3.28 0.76 2.52 2.08 2.77 0.84 0.64
MLR 76.22 81.92 69.77 3.13 0.77 2.30 1.87 2.49 0.86 0.66 MLP 76.00 80.14 71.70 2.55 0.80 2.08 1.57 2.11 0.86 0.69 Estimated Data (RIO) Models M MAX MIN SD (r) RMSE MAE MPE (%) (D) (C) Relative Air Humidity MD 71.22 78.12 62.48 4.17 0.77 2.90 2.37 3.28 0.83 0.64
MLR 71.61 75.03 66.44 2.17 0.72 2.54 2.06 2.84 0.76 0.55 MLP 72.25 75.05 66.68 2.68 0.77 2.18 1.74 2.41 0.85 0.65 Estimated Data (COR) Models M MAX MIN SD (r) RMSE MAE MPE (%) (D) (C) Relative Air Humidity MD 78.04 85.70 68.74 4.17 0.87 2.75 2.32 2.94 0.90 0.79
MLR 78.49 86.99 69.69 4.78 0.91 2.21 1.79 2.28 0.94 0.86 MLP 78.50 84.78 68.67 4.85 0.93 1.95 1.47 1.85 0.95 0.89 Estimated Data (ITA) Models M MAX MIN SD (r) RMSE MAE MPE (%) (D) (C)
MAX and MIN, the values estimated by the MLP model show certain similarity with the actual data. In addition, the value of (r) obtained by the MLP model was equal to 0.94, which demonstrates a high correlation. Furthermore, ac-cording to Table 6, the error parameters RMSE, MAE and MPE of the estimates generated by the MLP model were lower than those of the MD and MLR, respectively 2.10, 1.67 and 2.35%. This guarantees that the MLP model showed a higher hit rate in its estimates (Fig. 6).
After analyzing the results of the estimates of relative air humidity and observing the capacity of the MLP model, the data removed in the sorting stage from the stations used in the estimate of each region were applied to fill the actual gaps of the estimated stations, adopting the same methodol-ogy employed in the filling of maximum air temperature data.
Thus, for Campos do Goytacazes, it was possible to fill three out of the seven gaps; for Rio de Janeiro, six out of
eight; for Cordeiro, forty-two out of forty-seven; and, for Itaperuna, six out of eight (Fig. 7).
4. Conclusions
From the analysis of the results achieved by the MLP model, it can be concluded that it presented considerably convincing results, being superior to the MD and MLR models. However, it was possible to verify that the MD and MLR models also presented satisfactory results, showing high correlation indices (r) and low mean errors (EMP) with real data. This fact may have been influenced by the treatment method applied in the variables that standardize the historical series making it homogeneous.
However, it can be observed from the comparison with the real data that most of the values estimated by the MLP model were closer to reality when compared to the measures of (M), (MIN), (MAX) and (DS) Presented by the other models.
Figura 6- Actual data and results of the estimation of relative air humidity by the models MLP, MLR and MD. A) Results for the region of Campos dos
Thus, it can be stated that the MLP, RNA type, stands out as an effective tool to reliably estimate and fill the mete-orological variables of maximum air temperature and rela-tive humidity.
Acknowledgments
This work was supported by the project of emer-gencial support to the postgraduation from FAPERJ (State of Rio de Janeiro Research Foundation). We thank the
Co-ordination for the Improvement of Higher Education Per-sonnel (CAPES), for providing the research grant; the Na-tional Institute of Meteorology (INMET), for providing the utilized meteorological; The financial support provided by the PPGCTIA (Doctoral Program in Science, Technology and Innovation in Farming), Postgraduate Program of Fed-eral Rural University of Rio de Janeiro; the FedFed-eral Center of Technological Education of Rio de Janeiro- CEFET / RJ to the support and expertise.
References
BUSTAMI, R.; BESSAIH, N.; BONG, C.; SUHAILI, S. Artifi-cial Neural Network for Precipitation and Water Level Pre-dictions of Bedup River.International Journal of Com-puter Science, v. 34, n. 2, p. 228-233, 2007.
CORREIA, T.P.; DOHLER, R.E.; DAMBROZ, C.S.; BINOTI, D.H.B. Aplicação de Redes Neurais Artificiais no Preenchi-mento de Falhas de Precipitação Mensal na Região Serrana do Espírito Santo. Geociências, v. 35, n. 4, p. 560-567, 2007.
COUTINHO, E.R.; SILVA,R.M.; DELGADO, A.R.S. Utilização de Técnicas de Inteligência Computacional na Predição de
Dados Meteorológicos. Revista Brasileira de
Meteoro-logia, v. 31, n. 1, p. 24-36, 2016.
DEPINÉ, H.; CASTRO, N.M.R.; PINHEIRO, A.; PEDROLLO, O. Preenchimento de Falhas de Dados Horários de Pre-cipitação Utilizando Redes Neurais Artificiais. Revista Brasileira de Recursos Hídricos, v. 19, n. 1. p. 51-63, 2013.
International Journal of Computer Applications, v. 5,
n. 12. p. 24-28, 2010.
FERNANDEZ, M.N.Preenchimento de Falhas em Séries
Tem-porais. 106 p. Dissertação (Programa de Pós-graduação em
Engenharia Oceânica - Mestre em Engenharia Oceânica) Universidade Federal do Rio Grande, 2007. Rio Grande.
FONSECA, J.S.; MARTINS, G.A.; TOLEDO, G.L.Estatística
Aplicada. 2.ed. São Paulo: Atlas, p. 267, 2012.
GILL, P.; MURRAY, W.; WRIGHT, M.H.Practical
Optimiza-tion. California: Academic Press, p. 418, 1982.
GOMES, L.F.C.; MONTENEGRO, S.M.G.L.; VALENÇA, M.J.S. Modelo Baseado na Técnica de Redes Neurais para Previsão de Vazões na Bacia do Rio São Francisco.Revista Brasileira de Recursos Hídricos, v. 15, n. 1, p. 5-15, 2010. HÄRTER, F.P.; VELHO, H.F.C. Recurrent And Feedforward
Neural Networks Trained With Cross Validation Scheme Applied To The Data Assimilation In Chaotic Dynamics. Revista Brasileira de Meteorologia, v. 20, n. 3, p. 411-420, 2005.
HAYKIN, S.Redes Neurais Princípios e Pratica. 2.ed. Porto
Alegre: Artmed, p. 902, 2001.
HUTH, R.; NEMESOVÁ, I.; Estimation of Missing Daily Tem-peratures: Can a Weather Categorization Improve its Accu-raty?Journal of Climate, v. 8, p. 1901-1916, 1995. LYRA, G.B.; SOUZA, M.O.; VIOLA, D.N. Modelos Lineares
Aplicados à Estimativa da Concentração do Material Parti-culado (PM10) na Cidade do RIO DE JANEIRO, RJ.Revista
Brasileira de Meteorologia, v. 26, n. 3, p. 392-400, 2011. MAQSOOD, I.; KHAN, M.R.; ABRAHAM, A. An ensemble of
neural networks for weather forecasting.Journal Neural Computing and Applications, v. 13, n. 2, p. 112-122, 2004. MIRANDA, D.S.; SILVA, R.G.; ALMEIDA , L.B. Impactos Ambientais da Exploração e Produção de Petróleo na Bacia de Campos-RJ.Bolsista de Valor: Revista de divulgação do Projeto Universidade Petrobras e IF Fluminense, v. 1, p. 133-138, 2010.
OLCESE, L.E.; PALANCAR, G.G.; TOSELLI, B.M. A method to estimate missing AERONET AOD values based on artifi-cial neural networks.Atmospheric Environment, v. 113, p. 140-150, 2015.
OLIVEIRA, L.F.C. ; FIOREZE, A.P.; MEDEIROS, A.M.M.; SILVA, M.A.S. Comparação de metodologias de preenchi-mento de falhas de séries históricas de precipitação pluvial anual.Revista Brasileira de Engenharia Agrícola e Am-biental, v. 14, n. 11, p. 1186-1192, 2010.
PEZZOPANE, J.E.M.; CASTRO, F.S.; PEZZOPANE, J.R.M.;
CECÍLIO, R.A.Agrometeorologia Aplicações para o
Es-pírito Santo. Alegre: CAUFES, p. 163, 2012.
REIS JUNIOR, R.A.; MONNERAT, P.H. Diagnose Nutricional
da Cana-de-Açúcar em Campos dos Goytacazes (RJ).
Re-vista Brasileira Ciência do Solo, v. 26, p. 367-372, 2002.
ROBLES, L. A. D.; ORTEGA, J.C.; FU, J. S.; REED, G.D.; CHOW, J.C.; WATSON, J.G.; HERRERA, J. A. M. A hy-brid ARIMA And Artificial Neural Networks Model to Forecast Particulate Matter in Urban Areas: The Case of
Temuco, Chile. Atmospheric Environment, v. 42,
p. 8331-8340, 2008.
SHAH, H.; GHAZALI, R. Prediction of Earthquake Magnitude
by an improved ABC-MLP. Developments in E-systems
Engineering. 2011. p. 6.
SMAC - Secretaria Municipal de Meio Ambiente.Mapeamento
da Cobertura Vegetal e do Uso das Terras do Município do Rio de Janeiro. Disponível em: http://www.rio.rj.gov.br/web/smac/sig-floresta. Acesso em Junho de 2016.
SOBRINHO, T.A.; RODRIGUES, D.B.B.; OLIVEIRA, P.T.S.; REBUCCI, L.C.S.; PERTUSSATTI, C.A. Estimativa Da Evapotranspiração De Referência Através De Redes Neu-rais Artificiais.Revista Brasileira de Meteorologia, v. 26, n. 2, p. 197-203, 2011.
SOUSA, N.M.N.; DANTAS, R.T.; LIMEIRA, R.C. Influência de Variáveis Meteorológicas Sobre a Incidência do Dengue,
Meningite e Pneumonia em João Pessoa - PB. Revista
Brasileira de Meteorologia, v. 22, n. 2, p. 183-192, 2007. VENTURA, T.M.; OLIVEIRA, A.G.; MARQUES, H.O.;
OLI-VEIRA, R.S.; MARTINS, C.A. Uma abordagem compu-tacional para preenchimento de falhas em dados micro me-teorológicos.Revista Brasileira de Ciências Ambientais, n. 27, p. 61-70, 2013.
WANDERLEY, H.S.; AMORIM, R.F.C.; CARVALHO, F.O. Variabilidade Espacial E Preenchimento De Falhas De
Da-dos Pluviométricos Para O Estado De Alagoas. Revista
Brasileira de Meteorologia, v. 27, n. 3, p. 347-354, 2012. WANDERLEY, H.S.; AMORIM, R.F.C.; CARVALHO, F.O.
Interpolação Espacial De Dados Médios Mensais Pluvio-métricos Com Redes Neurais Artificiais.Revista Brasileira de Meteorologia, v. 29, n. 3, p. 389-396, 2014.