U
NIVERSIDADE DE
L
ISBOA
Faculdade de Ciˆencias
Departamento de Biologia Animal
MACHINE LEARNING ALGORITHMS TO PREDICT
BLOOD-BRAIN BARRIER PERMEABILITY OF
DRUG MOLECULES
Inˆes Filipa dos Santos Martins
MESTRADO EM BIOINFORM ´
ATICA E BIOLOGIA
COMPUTACIONAL
Especializac¸˜ao em Bioinform´atica
U
NIVERSIDADE DE
L
ISBOA
Faculdade de Ciˆencias
Departamento de Biologia Animal
MACHINE LEARNING ALGORITHMS TO PREDICT
BLOOD-BRAIN BARRIER PERMEABILITY OF
DRUG MOLECULES
Inˆes Filipa dos Santos Martins
DISSERTAC
¸ ˜
AO
Dissertac¸˜ao orientada pelo Prof. Doutor Andr´e Os´orio e Cruz de Azerˆedo Falc˜ao
MESTRADO EM BIOINFORM ´
ATICA E BIOLOGIA
COMPUTACIONAL
Especializac¸˜ao em Bioinform´atica
Acknowledgments
First of all, I would like to thank my supervisor Prof. Doutor Andr´e Falc˜ao that aroused my interest to bioinformatics with his course in computational biochemistry still during my degree in biochemistry, and that led to my entry into the Master of bioinfor-matics and computational biology. Who knew that after a while I would contact you again to search for proposals for Master’s theses. Once again, my interest was piqued with the presentation of the theme of this thesis, which above any obligation to complete the Mas-ter, I really like to develop. So, thanks for the dedication, the hours of weekly meetings, the fresh ideas when everything did not seem to work, and the support throughout the project.
I am also thankful to Ana Teixeira, colleague at bio-XLDB for their time and precious help in the constitution of the final dataset and their contribution for the write of this thesis.
A ”thank you” to David Raposo that indirectly open my eyes to a all new world of informatics that I did not know, and that I enjoy to know, and to guide me in a critical phase of my life course, with a shift to computer science.
I would also like to thank Marta Ribeiro and Inˆes Torcato from Instituto de Medicina Molecular for their contributions with important references.
To Angelo, Daniela, David, Luis, Patr´ıcia and Pedro for the friendship and share of moments that were important to my academic and personal life. And, for all the others that I did not mention here, but that were part of my track over the five years that I spent in the Faculty of Sciences of the University of Lisbon, my appreciation.
And last, but not least, my grateful to Ant´onio Broega by the wonderful person you are, by friendship, and by love. For all the support to this thesis and all steps of my life, and clear thought in moments of doubt. Thanks for being you.
To my father for all the support and dedication to my education and to No´emia, the woman that not being my mother, is a mother to me.
Resumo
A incidˆencia de doenc¸as ligadas ao sistema nervoso central (SNC) aumenta exponen-cialmente depois dos 65 anos e o aumento da esperanc¸a m´edia de vida vem aumentar a populac¸˜ao mundial com mais de 65 anos. Depress˜oes, dor cr´onica, epil´epsia e enxaque-cas s˜ao algumas condic¸˜oes cl´ınienxaque-cas (dist´urbios do SNC) que apresentam tratamento no entanto, podem ser consideradas excepc¸˜oes perante a maioria dos dist´urbios do SNC, que incluem doenc¸as neurodegenerativas e que tˆem muito poucas opc¸˜oes de tratamento. Al-guns destes casos s˜ao a doenc¸a de Alzheimer, doenc¸a de Parkinson, esclerose amiotr´ofica lateral, esclerose m´ultipla, cancro do c´erebro, entre outras. O aumento do n´umero de casos com doenc¸as neurodegenerativas veio ent˜ao aumentar a necessidade de descoberta e de-senvolvimento de novos f´armacos que combatam e curem estas doenc¸as. Por exemplo, a doenc¸a de Alzheimer afecta actualmente 18 milh˜oes de pessoas a n´ıvel mundial e estima-se que em 2025 o n´umero de casos chegue aos 34 milh˜oes. Este pequeno grande exemplo demonstra a preocupac¸˜ao e a necessidade de novos f´armacos que dˆeem esperanc¸a de cura a estes e muitos outros casos de doenc¸as neurodegenerativas. No entanto, esta ´e uma ta-refa com dificuldades acrescidas face ao desenvolvimento de f´armacos com alvos noutras partes do organismo que n˜ao o c´erebro. O tempo necess´ario para que um f´armaco com alvos no SNC chegue aos mercados pode ir de 12 a 16 anos, enquanto que um f´armaco que n˜ao actue no SNC vai de 10 a 12 anos. Esta grande diferenc¸a prende-se com a com-plexidade do c´erebro, a tendˆencia desses f´armacos para causar efeitos secund´arios e a existˆencia da barreira hemato-encef´alica (BHE).
A BHE separa o flu´ıdo cerebroespinal do sangue em circulac¸˜ao, impedindo a livre passagem da grande maioria das substˆancias (mesmo as pequenas mol´eculas) da cor-rente sangu´ınea para o c´erebro. De entre estas substˆancias encontram-se os f´armacos, estimando-se que cerca de 95% destes n˜ao consigam atravessar a barreira, deixando-nos apenas uma inf´ıma parte suscept´ıvel de atravess´a-la. Isto significa que f´armacos que tˆem efeito terapˆeutico noutras partes do organismo, s˜ao in´uteis para alvos no SNC pela baixa permeabilidade da BHE, tornando muito dif´ıcil o tratamento de infecc¸˜oes bacterianas e virais no SNC atrav´es dos antibi´oticos convencionais. Muitas das doenc¸as neurodege-nerativas apresentadas acima poderiam ser tratadas com f´armacos, enzimas ou genes j´a descobertos, infelizmente estas n˜ao conseguem atravessar a BHE.
Al´em desta clara dificuldade imposta pela fisiologia existe ainda outra relacionada com a experimentac¸˜ao. A permeabilidade de um composto na BHE ´e convencional-mente medida pelo logaritmo do coeficiente de partic¸˜ao sangue-c´erebro, tratando-se de uma medida da lipofilicidade. No entanto, a sua aquisic¸˜ao por ensaios experimentais ´e muito dispendiosa e o processo moroso ainda mais quando est˜ao em an´alise milhares de compostos. Este processo integra a primeira fase de desenvolvimento de um f´armaco que pode demorar at´e dois anos e em que s˜ao analisados, em m´edia, 10000 compostos. S˜ao necess´arios at´e 16 anos para que um medicamento que actue do SNC chegue aos mercados e seja comercializado, nesse sentido, ´e objectivo deste trabalho contribuir com metodologias que visem a diminuic¸˜ao do tempo da primeira fase de desenvolvimento de um f´armaco e por conseguinte, a diminuic¸˜ao do n´umero de anos final.
Para tal entramos no dom´ınio da chamada quimio-inform´atica, uma ´area na fronteira entre a Qu´ımica e a Inform´atica, que tenta retirar informac¸˜ao ´util contida nos compos-tos qu´ımicos pela utilizac¸˜ao e desenvolvimento de sistemas automatizados de recolha e processamento de dados, algoritmos, t´ecnicas computacionais e m´etodos estat´ısticos. A utilizac¸˜ao desta informac¸˜ao permite estabelecer correlac¸˜oes que s´o s˜ao poss´ıveis com recurso aos computadores, `as metodologias computacionais e `a inteligˆencia artificial. Es-tes recursos disseminaram-se fortemente na ind´ustria qu´ımica e farmacˆeutica que fazem investigac¸˜ao de novos produtos utilizando no processo m´etodos computacionais. A pro-cura de metodologias que contribuam e favorec¸am o desenvolvimento de novos compos-tos ´e emergente havendo uma grande procura de especialistas nesta ´area.
Este trabalho, de forte componente computacional, faz uso de algoritmos de apren-dizagem autom´atica para determinar com melhor precis˜ao se um determinado f´armaco pode passar a barreira hemato-encef´alica. Outros estudos tˆem-se baseado sobretudo na utilizac¸˜ao de metodologias de aprendizagem standard usando como vari´aveis preditivas propriedades f´ısicas e qu´ımicas dos compostos em an´alise. Neste trabalho utilizam-se des-critores e impress˜oes digitais moleculares (fingerprints) para analisar a diversidade estru-tural existente num conjunto de compostos permitindo estabelecer medidas de semelhanc¸a estrutural entre mol´eculas e com isso prever o comportamento de um composto ”desco-nhecido”.
Assim, no ˆambito do projecto foram desenvolvidas trˆes metodologias baseadas no al-goritmo do vizinho mais pr´oximo, nas redes neuronais artificiais e nas Random forests (floresta aleat´oria). Foram constitu´ıdos trˆes conjuntos de dados (conjunto de dados I, con-junto de dados II e concon-junto de dados III) com 628 (374 BHE+/254 BHE-), 729 (466 BHE+/263 BHE-) e 950 (466 BHE+/484 BHE-) mol´eculas, respectivamente. Os dois primeiros algoritmos testados foram o algoritmo do vizinho mais pr´oximo e as redes neuronais, os quais seguem uma mesma l´ogica baseada no uso das impress˜oes digitais moleculares. A partir destes, s˜ao geradas matrizes de similaridade onde ´e calculada uma medidade de semelhanc¸a entre cada par de mol´eculas. Segue-se a an´alise em
das principais que reduz a matriz num vector de coordenadas com n dimens˜oes, que s˜ao os descritores moleculares destes dois m´etodos. O algoritmo do vizinho mais pr´oximo foi treinado e testado com o conjunto de dados I e 30 descritores tendo sido aplicada a validac¸˜ao cruzada com o m´etodo leave-one-out. Este algoritmo consegue prever correcta-mente a classificac¸˜ao dos compostos em 81.75%, 76.57% e 79.78% para BHE+ (compos-tos que passam a BHE), BHE- (compos(compos-tos que n˜ao passam a BHE) e globalidade das duas classes, respectivamente. A metodologia que implementa as redes neuronais tamb´em foi treinada com o conjunto de dados I, tendo sido usados 40 descritores moleculares. O mo-delo foi validado com validac¸˜ao cruzada 5-fold, obtendo-se os valores de 77.16%, 81.45% e 79.68% para BHE+, BHE- e globalidade das duas classes, respectivamente.
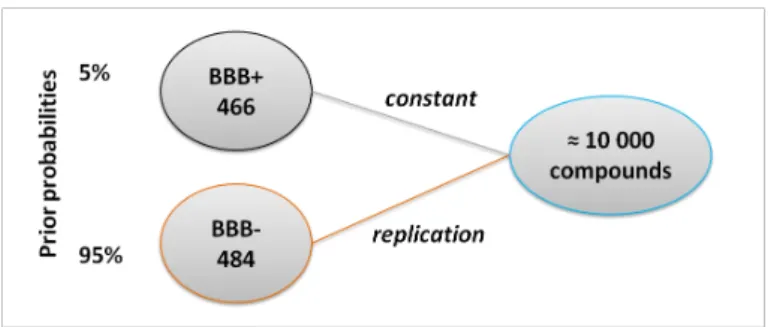
O modelo das Random Forests foi constru´ıdo com base em 1051 descritores molecu-lares, de entre as impress˜oes digitais moleculares foram tamb´em utilizados a massa mole-cular, massa molecular m´edia, n´umero de an´eis, n´umero de ligac¸˜oes em an´eis e n´umero de ligac¸˜oes poss´ıveis para cada ´atomo de um subconjunto definido (C, N, O, S, Br, I, Cl, F e Na). Al´em da utilizac¸˜ao de descritores moleculares diferentes dos que tˆem sido at´e agora utilizados na literatura, a metodologia apresentada neste trabalho ´e nova e traz inovac¸˜ao a esta ´area de desenvolvimento na medida em que faz uso da diferenc¸a percentual entre as duas classes de compostos, 5% para BHE+ e 95% BHE-. A maior parte dos estudos analisados na literatura apresentam conjuntos de dados populados maioritariamente por compostos que atravessam a BHE, no entanto esta situac¸˜ao n˜ao transparece a realidade. Nesse sentido, neste trabalho foi desenvolvido uma metodologia que efectua amostragens diferenciadas usando uma estrat´egia de oversampling (sobre-amostragem) nos compostos para melhor reflectir a realidade de modo a representar 95% de compostos BHE-e apBHE-enas 5% dBHE-e compostos BHE+. Os rBHE-esultados dBHE-emonstram-sBHE-e bastantBHE-e promissorBHE-es, conseguindo a Random Forest prever correctamente a classificac¸˜ao dos compostos em 92%, 77.2% e 82.6%, para BHE+, BHE- e globalidade das duas classes, respectivamente. Esta metodologia apresenta os melhores resultados, ficando mesmo acima da maior parte dos valores apresentados na literatura.
Com estes valores os principais objectivos desta tese s˜ao concretizados, tendo sido feito um contributo bastante positivo para a ´area, principalmente para uma previs˜ao mais correcta da passagem de um composto pela barreia hemato-encef´alica, o qual ´e um ponto chave no desenvolvimento de f´armacos para o tratamento de doenc¸as ao n´ıvel do SNC, que precisam obrigatoriamente de passar a BHE. Neste trabalho apenas foram apresenta-das as trˆes metodologias que se revelaram mais promissoras e com os melhores resultados embora ao longo do projecto tenham sido desenvolvidas e testada outras metodologias.
Face aos resultados obtidos ´e proposta de trabalho futuro a concretizac¸˜ao de uma aplicac¸˜ao que implemente a metodologia da Random Forest com vista a que seja um con-tributo `a Ciˆencia e principalmente `a ´area de desenvolvimento de novos f´armacos, contri-buindo para uma an´alise r´apida de grandes bibliotecas de compostos, restringido o leque
de compostos com necess´aria intervenc¸˜ao de ensaios experimentais, diminuindo tamb´em o custo associado `a investigac¸˜ao de compostos na primeira fase de desenvolvimento de um f´armaco.
Palavras-chave: Aprendizagem autom´atica, Algoritmo do vizinho mais pr´oximo, Barreira hemato-encef´alica, Floresta aleat´oria, Pr´e-triagem de f´armacos in silico, Quimio-inform´atica, Redes neuronais
Abstract
The increasing number of cases with neurodegenerative diseases has increased the need to discover and develop new drugs to combat and cure these diseases. However, this is a difficult task due to the existence of the blood-brain barrier (BBB), which prevents the free passage of most substances from the bloodstream to the brain. Drugs are among these substances and it is estimated that about 95% of these fail to cross the barrier, leaving us only a small fraction likely to cross it.
Besides this clear difficulty imposed by physiology, logBB (blood-brain permeation coefficient), a coefficient used to measure the ability of a compound to cross the BBB, is difficult to acquire by experimental process, being very expensive and time consuming even more when there are thousands of compounds under analysis. This process includes the first phase of developing a drug that can take up to two years and could have in analysis an average of ten thousands compounds. Thus, one of the objectives is to contribute with methodologies to improve current methodologies for in silico compound pre-screening, so that a reasonable level of confidence in the effectiveness of an unknown molecule passing the BBB can be ascertained.
This work has a strong computational component and makes use of state-of-the-art machine learning algorithms, namely the k-nearest neighbor algorithm, neural networks and random forests to determine more accurately whether a particular drug can pass the BBB. Molecular descriptors and molecular fingerprints are used to examine the structural diversity existing in a number of compounds allowing to establish measures of structural similarity between molecules and thereby predict the behavior of an ”unknown” com-pound.
The methodology that uses random forests provides the best results, predicting cor-rectly the classification of compounds in 92%, 77.2% and 82.6%, referring these values to BBB+, BBB- and overall accuracies, respectively. Results achieved are on par and even slighlty better compared to current results described in literature.
Keywords: Blood-brain barrier, Cheminformatics, in silico drug pre-screening, k-Nearest Neighbor, Neural Networks, Random Forests
Contents
List of Figures xvii
List of Tables xix
1 Introduction 1
1.1 Drug development . . . 1
1.2 Problem . . . 2
1.3 Motivation . . . 3
1.4 Objective . . . 3
1.5 Structure of the thesis . . . 4
2 State of the Art 5 2.1 CNS barriers . . . 5
2.2 Blood-Brain Barrier . . . 6
2.3 Algorithms for in silico BBB permeability . . . 9
3 Methods 13 3.1 Tools . . . 13 3.1.1 R . . . 13 3.1.2 Python . . . 13 3.1.3 OpenBabel . . . 14 3.2 Molecular representation . . . 15
3.2.1 SMILES - Simplified Molecular Input Line Entry Specification . 15 3.2.2 Molecular descriptors . . . 17
3.2.3 Fingerprints . . . 18
3.3 Molecular similarity . . . 20
3.4 Statistical methods . . . 22
3.4.1 Principal Coordinates Analysis . . . 22
3.4.2 Statistical measures . . . 24
3.4.3 Cross-Validation . . . 26
3.5 Learning methods . . . 27
3.5.1 k-Nearest Neighbor . . . 27 xv
3.5.2 Neural Networks . . . 28
3.5.3 Random Forest . . . 31
4 Data 35 4.1 Drug molecules dataset . . . 35
4.2 Data preparation and computational approach . . . 36
4.3 Implementations . . . 37
4.3.1 Principal Coordinates Analysis . . . 37
4.3.2 k-NN . . . 37
4.3.3 Neural networks . . . 38
4.3.4 Random Forest . . . 39
5 Results and discussion 43 5.1 k-Nearest Neighbour . . . 43
5.2 Neural Networks . . . 46
5.3 Random Forests . . . 49
5.3.1 Approach A . . . 50
5.3.2 Approach B . . . 50
5.3.3 Approach A versus Approach B . . . 51
5.3.4 Variable importance analysis . . . 52
5.4 Discussion . . . 54
6 Conclusion 59 A Methodologies 61 A.1 Obtaining SMILES from compound names . . . 61
A.2 Obtaining molecular descriptors: MW and LogP . . . 62
A.3 Similarity matrices for PCoA analysis . . . 62
A.4 Principal Coordinates Analysis . . . 65
A.5 k-Nearest Neighbor . . . 66
A.6 Neural Networks . . . 68
A.7 Random Forests . . . 70 B Molecular descriptors 73
C Results 75
Glossary 78
Bibliography 83
List of Figures
1.1 Drug development process . . . 1
2.1 Barriers at central nervous system . . . 6
2.2 General and brain capillaries . . . 7
2.3 Transport via blood-brain barrier . . . 7
2.4 Estimated density of molecular weight for BBB+ and BBB- molecules . . 9
3.1 Pybel representation of FP2 fingerprint bits . . . 19
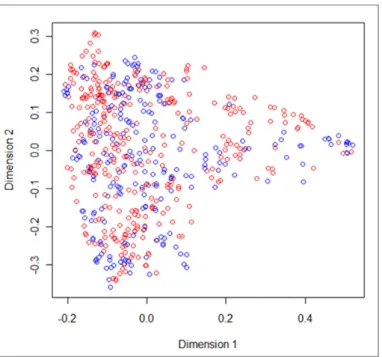
3.2 Molecules representation in a two dimensional space . . . 23
3.3 Classification with k-NN algorithm . . . 28
3.4 Feed-forward network with a single hidden layer . . . 30
4.1 Oversampling process . . . 39
5.1 Phi measures for tested Tanimoto coefficient variants with k-NN algorithm 44 5.2 Phi measures for all the evaluated coefficients with k-NN algorithm . . . 45
5.3 Phi value in order to the number of neighbors . . . 46
5.4 Phi measures for tested Tanimoto coefficient variants with NN algorithm . 47 5.5 Phi measures for all the evaluated coefficients with NN algorithm . . . 48
5.6 Phi value in order to the number of neurons . . . 49
5.7 Importance variable analysis . . . 52
5.8 Number of the bonds in rings and its distribution among BBB- and BBB+ molecules . . . 53
5.9 Distribution of oxygens with single bond among BBB- and BBB+ molecules 54 C.1 Importance variables analysis and its molecular structures . . . 75
C.2 Analysis of less important variables . . . 76
List of Tables
2.1 Prediction accuracies and phi for BBB+ and BBB- compounds from
dif-ferent studies reported in the literature . . . 10
3.1 Multiplicities as molecular descriptors . . . 18
3.2 Contingency table for similarity measures . . . 21
3.3 Confusion matrix . . . 24
4.1 Molecular descriptors for random forest model . . . 39
5.1 Phi measures for evaluated coefficients with k-NN algorithm . . . 45
5.2 k-NN classification results for several statistical measures . . . 47
5.3 Phi measures for evaluated similarity coefficients with NN algorithm . . . 48
5.4 NN classification results for several statistical measures . . . 49
5.5 Random Forest results with approach A . . . 50
5.6 Random Forest results with approach B . . . 51
5.7 Approaches A and B: results . . . 52
5.8 Molecular weight and its average (AMW): comparison and distribution in BBB+ and BBB- molecules . . . 53
5.9 Methodologies and studies comparison . . . 55
5.10 Classes of molecular descriptors used in studies reported in literature and in this work . . . 57
B.1 Classes and molecular descriptors . . . 73
Chapter 1
Introduction
1.1
Drug development
The process of drug development until it reaches the market can take at least 10 years. In the worst case, it can take up to 16 years. Many are the compounds studied in the early stages of the developing process, but very few can reach the final stages of the process.
Successful drugs have to fulfill some criteria, dependent of physicochemical proper-ties and pharmacokinetic profile, including how the compound is absorbed, distributed, metabolized, and excreted (ADME).
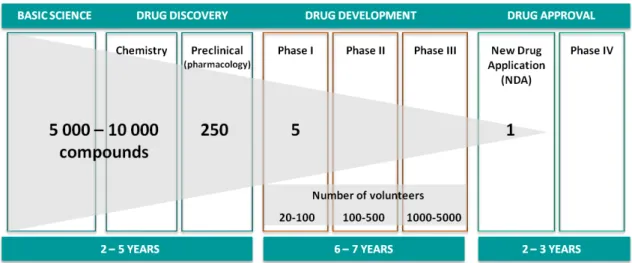
The drug development process can be divided into three major phases [Alzheimer’s Drug Discovery Foundation, 23-07-2011] (see Figure 1.1):
Figure 1.1: Stages of drug development process, including compounds, volunteers and time in each stage. Adapted from Alzheimer’s Drug Discovery Foundation [23-07-2011]. Basic science - at this level, the aim is to discover information about individual chemicals
and biological processes.
Drug discovery - develop specific chemicals and study their effects on identified disease 1
Chapter 1. Introduction 2 targets. When a potentially viable drug candidate is identified, the compound pro-ceeds to laboratory testing against specific targets to determine its effect. This phase requires a more sophisticated chemistry and it is performed tests on animal models of disease. In study can be between 5000 to 10000 compounds, and it estimated that only 250 will progress to pre-clinical development with animals.
Drug development - as outlined before, many of the chemical compounds do not reach this phase. Nevertheless, when a chemical compound has an impact on a specific target, human testing is conducted through chemical trials to show the safety and efficacy so it may be approved as a drug and marketed. The drug development phase is then divided into three phases which differs the number of volunteers take to test the compounds. In phase I is study the effects on healthy human subjects (20 to 100 people), in the next phase are made a limited study of patients (100 to 500 patients), and finally, in phase III, are made comparative studies on a large number of patients (1000 to 5000 patients). Only 5 of the 250 compounds reach the phase I. However, just one will survive over the remaining phases and become an approved drug.
The compound numbers presented above represent an average success rate among all therapeutic areas.
It can be identified a fourth phase pointed out in Figure 1.1 as drug approval, that corresponds to the authorisation process of the new drug and to the continued comparative studies (phase IV of clinical trials).
1.2
Problem
It was described the overall perspective of drug development process, including com-pound numbers and an average of the success rate for all therapeutic areas, but when refering to Central Nervous System (CNS) drugs, they have only an 8% [Alzheimer’s Drug Discovery Foundation, 23-07-2011] success rate of being approved and receive the status of drug. This percentage is clearly lower when comparing with areas like the car-diovascular, which has a 20% success rate. Among this low chance of success, the time taken to bring a new CNS drug can reach 16 years compared with non-CNS drugs (12 years). This is attributable to various features, including the complexity of the brain, the tendency to cause side effects on CNS, and the existency of the Blood-Brain Barrier (BBB) that CNS drugs have to cross [Alavijeh et al., 2005].
Most organs of the body are perfused by capillaries with endothelial cells that have small pores that allow the movement of small molecules from the circulation into the organ. Although in brain capillary the diffusion is inhibited by the presence of tight junctions between the endothelium cells, this property prevents most of the molecules of
Chapter 1. Introduction 3 crossing the barrier leaving many of the CNS disorders without a therapy [Alavijeh et al., 2005].
The features of BBB represent a problem in CNS drug development, when 95 per-cent of molecules show poor or none permeability to BBB [Pardridge, 2005, King, 2011, Tsaioun et al., 2009]. Therefore, BBB penetration is one of the keys that are taken into account in chemical toxicological studies and in drug design [Zhang et al., 2008]. BBB permeability of drug molecules is commonly measured by logBB which represent the brain-to-blood (BB) concentration ratio. It is defined as the ratio of a drug concentration in brain tissue to the drug concentration in blood. Although the measurement of logBB is the most direct approach to know whether a molecule cross the BBB, the experiments are very expensive and time consuming [Zhao et al., 2007] and constitute a hindrance when are involved more than 5000 compounds.
1.3
Motivation
The Blood-Brain Barrier (BBB) is a membrane that separates circulating blood and the brain extracellular fluid in the CNS. Some of main functions of this barrier comprises the protection of the brain from foreign substances in the blood that may injure it, protection against hormones and neurotransmitters in the rest of the body and maintenance of a constant environment for the brain. Therefore, the BBB has special features that make it almost impenetrable to most drugs. It has a selective permeability and the molecules that generally cross are: nonpolar and lipophilic, properties related with high octanol/water partition coefficient (logP) and low molecular/molar weight - smaller molecules are more likely to pass through the BBB.
Due to the low permeability of BBB the process of discovering substances that cross the membrane and are active on CNS is hard and slow, and requires, in the early stages, a large number of chemical compounds.
The prediction of drug molecules permeability would be an useful tool to assist the experimental drug discovery process [Doniger et al., 2000], decreasing the time of the earliest stages and therefore, the time required for a drug reaches the market and us would be considerably less.
Computacional approaches are needed and have been introduced as pre-screening tools for large chemical databases to reduce the cost and enhance the speed of BBB per-meability analysis [Li et al., 2005b, Zhang et al., 2008].
1.4
Objective
To address the problem of drug permeability of BBB a robust comparison of different methodologies is needed. This thesis proposes the use of chemical information present in
Chapter 1. Introduction 4 molecules in an attempt to produce a novel computacional approach with better predic-tive rates. Thus, the main assumption in this thesis, is that molecules sharing a similar structure should have a similar behavior through the barrier and so, if a molecule crosses the blood-brain barrier, a similar one must also cross the barrier.
Our aim is to test different approaches based on the structural similarity of molecules for predicting BBB permeability of drug molecules, with high and balanced accuracy rates for both BBB+ and BBB- molecules.
The final methodology intends to be a contribution for the drug development process, at the early stages of compounds discovery, reducing the time expended in screening large numbers of pre-clinical candidates compounds.
1.5
Structure of the thesis
The work is divided into six chapters. Starting with the introductory chapter (the first), it is presented the pillars on which this thesis develops, with respect to the problem of low permeability of BBB that leads to a further delay in the development of drugs that can act on CNS, passing for the contributions that work intends to give for this research field, being presented the objectives.
The second chapter is dedicated to the presentation of CNS barriers and mainly the BBB, its characteristics and the functions that make it unique in the body, ending with a background, where it is exposed some of the previous works in literature, with relevance in the area.
Chapter three delineates the methods underlining the approaches developed, the ma-chine learning algorithms, the statistical methods and also the tools used throughout the work.
Chapter four focuses on data presentation and building of computacional approaches, with emphasis for datasets constitution and algorithms implementation.
Moving on to results and discussion, they are topic for chapter five. It is presented the results for each of the developed approaches, followed by comparison of results between approaches and with the previous work presented in chapter two.
In the last chapter, beyond the conclusions of the work, some proposals are presented for future work that could be constructed upon this project.
The appendices present the relevant computer program used both for data processing, algorithm development and result analysis.
Chapter 2
State of the Art
This chapter is divided into three sections. Section 2.1 characterizes the barriers that are part of CNS. Next, Section 2.2 focuses on the blood-brain barrier, being presented its properties and funcionalities, and Section 2.3 summarises some of the previous studies.
2.1
CNS barriers
The CNS has two controlling barriers, that protects the brain interstitial fluid (ISF) from blood circulating substances. The first and the largest is the BBB, and the second is the blood-cerebrospinal fluid barrier (BCSFB). The BBB has the greatest control on the brain homeostasis, acting as the first control line. More barriers could be identified, however only this two are mentioned as they has a role in permeability of substances that circulates in bloodstream [Cipolla, 2009]. The Figure 2.1 shows the localization of both barriers.
The BBB is formed by endothelial cells, astroglia, pericytes and basal lamina con-necting the cellular systems. Endothelial cells form an almost impenetrable barrier by the presence of tight junctions, while the other components contributes for the integrity of the barrier. The next section focuses on the role and properties of this complex barrier.
The BCSFB regulates the passage of molecules from the blood to cerebrospinal fluid (CSF), since it can exchange molecules with ISF. The barrier is then located between the blood and the CSF in the epithelium of the choroid plexus. This along with arachnoid membrane form a barrier between the blood and CSF. The passage of substances from the blood through the arachnoid membrane is prevented by tight junctions. The arachnoid membrane is generally impermeable to hydrophilic substances, and its role is forming the Blood-CSF barrier is largely passive. The choroid plexus forms the CSF and actively regulates the concentration of molecules in the CSF [Misra et al., 2003]. While endothe-lium cells of choroid plexus capillaries are highly permeable to hydrophobic substances, the epithelial cells are glued with tight junctions, although they are more permeable than those find in BBB.
Chapter 2. State of the Art 6
Figure 2.1: Barriers at central nervous system: a) brain barrier, and b) bloodcerebrospinal fluid barrier. Endo endothelial cells; bm basement membrane; Peri -pericytes; As endfoot - nearby astrocytes; bv - blood vessels; Ep - epithelial cells. Adapted from Cipolla [2009].
2.2
Blood-Brain Barrier
The BBB represents 400 miles [Begley et al., 2000] of capillaries that separates the brain from the bloodstream and it is composed of a continuous layer of endothelial cells sealed by tight junctions, this characteristic distinguish BBB of blood vessels in other parts of the body that have small poors for the movement of small molecules into the organ interstitial fluid, Figure 2.2 shows the difference between a general capillary and a capillary located in the brain. It is responsible by maintain the homeostasis of CNS, preventing the entry of substances that can disturb the function of neurons. It prevents the entry of the majority of molecules, except those that are small and lipophilic or those that enters via a mediated transport, and are needed for the proper functioning of the brain. The BBB protects
Chapter 2. State of the Art 7 the brain from fluctuations in ionic composition that could disturb synaptic and axonal signalling [Abbott et al., 2006].
Figure 2.2: Differences between general and brain capillaries [Dermietzel et al., 2006]. The transport through the BBB can occur via five different ways [Abbott et al., 2006, Alavijeh et al., 2005, Cipolla, 2009] and are represented in Figure 2.3:
Figure 2.3: The five routes of transport via blood-brain barrier [Abbott et al., 2006]. Paracellular pathway - represents the diffusion of polar solutes through tight junctions. Transcellular lipophilic pathway - correspond to a passive diffusion of lipid-soluble
Chapter 2. State of the Art 8 Mediated proteins transport - influx transport systems responsible for the entry of nu-trients and endogenous compounds, such as amino acids, monocarboxylic acids, amines, hexoses, thyroid hormones, purine bases and nucleosides. Some trans-porters act as active efflux pumps, they accounts for poor BBB permeability of certain drugs, this transporters are able to expel a large number of very different compounds from brain interstitial fluid. Among them is the transporter phosphory-lated glycoprotein (P-gp), which is responsible for inhibit the entry of hydrophobic drugs into the brain.
Receptor-mediated transcytosis - some proteins (as insulin and transferrin) enter in brain by specific receptor-mediated endocytosis and transcytosis.
Adsorptive transcytosis - native plasma proteins, as albumin, are surrounded by positive charges (cationization) to increase the transport via adsorptive-mediated endocyto-sis and transcytoendocyto-sis.
In the development of CNS-drugs it is not enough to cross the BBB, the molecules have to be in brain long enough to produce the desirable effect, and that depends of its ADME properties. Considering the development of CNS-drus, they are absorved when enter the blood capillaries and reach the brain, crossing the BBB. The transport can be done through one of the five processes describe above, and in part depends of lipophilicity and solubility of the drug. It can be thought that the greater the lipophilicity, greater will be the permeability, however this is not necessarily true. High lipophilicity also shows high affinity for metabolic enzymes, leading to a quick degradation of drug molecules. After enter in bloodstream, a drug molecule distributes across the body. At the same time, the elimination process start as a consequence of the metabolism and excretion. Therefore, a drug has to be administrated in a proper dose, enough to reach its target and produce its effect.
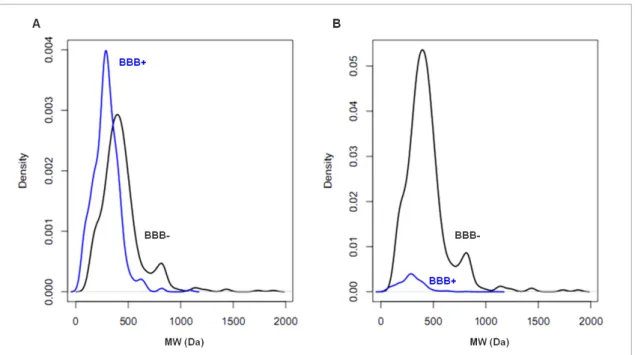
In short, the BBB is a very selective membrane that prevents the entry of most molecules, making the most of drug molecules useless for CNS disorders. In CNS drug develop-ment, the ability to permeate across the BBB is required, but nonetheless it does not mean that will have a therapeutic effect. On the other hand, it is expected that non-CNS drug molecules do not show ability to cross the BBB, preventing from potential side effects [Zhang et al., 2008]. Figure 2.4 shows the distribution of compounds in order to molecu-lar weight, in plot A is considered that 50% of the molecules cross the BBB and 50% of the molecules are not able to cross it (same ratio of compounds), on the other hand plot B considers prior probabilities of compounds classes, therefore only 5% of the compounds cross the BBB and 95% of the compounds can not cross it. Looking at first plot, it can be seen that below 500 Da most of the compounds are BBB+ compound and then the prob-ability of passing is higher, and above that threshold most of the compounds are BBB-, and then they do not cross the BBB. It is expected since the small molecules are much
Chapter 2. State of the Art 9 more capable of passing the BBB [Pardridge, 2005] than ”heavy” molecules. However this is an inaccurate perspective since only 5% of molecules can cross the barrier, that is what plot B intends to show. In fact, before the prior probabilities, it can be verified that even lower than 500 Da most of the small molecules can not cross the barrier, and those that get through are a small part.
Figure 2.4: Estimated density of molecular weight (MW) for BBB+ compounds (blue) and BBB- compounds (black): A) considering the same ratio for both classes of com-pounds, B) considering prior probabilities (95% BBB- and 5% BBB+).
2.3
Algorithms for in silico BBB permeability
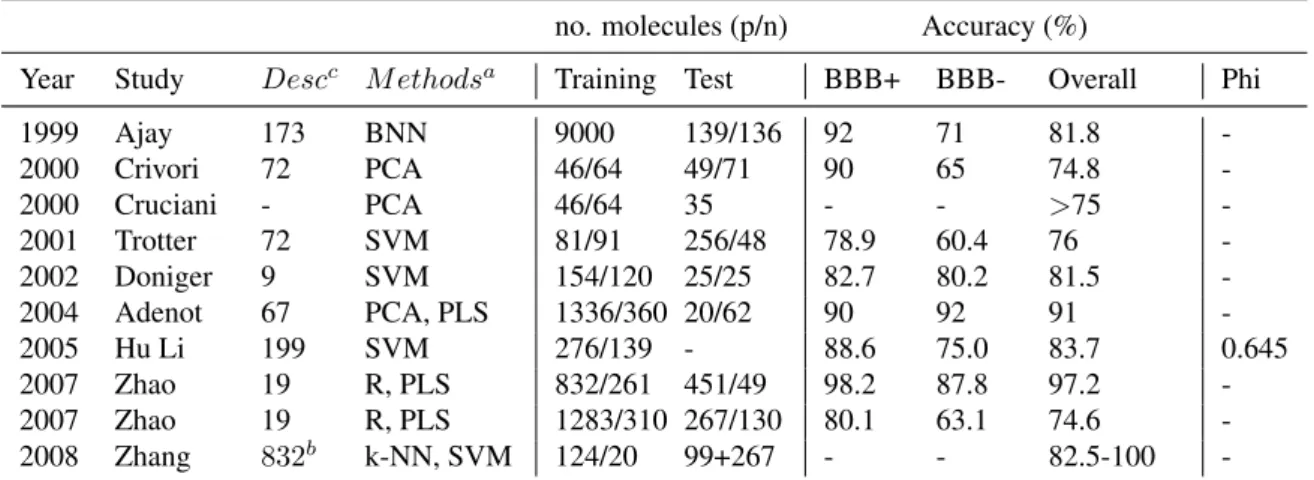
This section attempts to present some of the previous work that contributed to this re-search area: the prediction of BBB permeability of drug molecules. Several computa-cional methods have been developed for the prediction of the BBB-penetrating (BBB+) and -nonpenetrating (BBB-) agents to use as pre-screening tools to reduce the cost and enhance the speed of the analysis. Table 2.1 summarises some of the previous work, pointing out the relevant aspects for terms of comparison with our study case. For each of the works was retained, when available, the number of descriptors, methods (being pre-sented for the most of the cases the method that contribute for the best results), number of molecules for the training and test sets, as well as available classification statistics.
Chapter 2. State of the Art 10 Table 2.1: Prediction accuracies and phi for BBB+ and BBB- compounds from different studies reported in the literature.
no. molecules (p/n) Accuracy (%)
Year Study Descc M ethodsa Training Test BBB+ BBB- Overall Phi 1999 Ajay 173 BNN 9000 139/136 92 71 81.8 -2000 Crivori 72 PCA 46/64 49/71 90 65 74.8 -2000 Cruciani - PCA 46/64 35 - - >75 -2001 Trotter 72 SVM 81/91 256/48 78.9 60.4 76 -2002 Doniger 9 SVM 154/120 25/25 82.7 80.2 81.5 -2004 Adenot 67 PCA, PLS 1336/360 20/62 90 92 91 -2005 Hu Li 199 SVM 276/139 - 88.6 75.0 83.7 0.645 2007 Zhao 19 R, PLS 832/261 451/49 98.2 87.8 97.2 -2007 Zhao 19 R, PLS 1283/310 267/130 80.1 63.1 74.6 -2008 Zhang 832b k-NN, SVM 124/20 99+267 - - 82.5-100 -a BNN(Bayesian neural network), PCA (principal component analysis), SVM (support vector machine), PLS (partial least squares), k-NN (k-Nearest neighbors), R (recursive partitioning models). bDescriptors are divided into three classes and are tested separately.cNumber of descriptors
Ajay and Murcko [1999] used a Bayesian neural network (BNN) to develop a model that can distinguish between molecules that are CNS-active and CNS-inactive. The model was conducted using 173 descriptors, of them 7 are non-structural (such as MW, number of donors, number of acceptors) and 166 are structural (for example, the presence or ab-sence of certain functional groups), and it was tested with an independent validation set of 275 molecules of known CNS activity. The cross-validation results show an overall accu-racy of 81.8%, and 92% and 71% accuracies for CNS-active and CNS-inactive molecules, respectively. It should be noted that this study is based on the prediction of CNS-active and CNS-inactive, whereas in other studies, including the presented in this thesis are based on BBB-permeability and BBB-nonpermeability. The difference, although slight, exists since a molecule that is CNS-active is obliged to pass the BBB, but a CNS-inactive molecule may or may not pass the BBB.
PCA (principal component analysis) and discriminant PLS (partial least squares) were used by Crivori et al. [2000] to correlate data and build a model to access the BBB per-meability of drug molecules. 72 simpler molecular descriptors were calculated from 3D molecular interaction fields with recourse to VolSurf program, some of them refer to molecular size and shape, to size and shape of hydrophobic and hydrophilic regions, hidrogen bonding, and others. The model was trained with 110 models and tested through cross-validation with an independent set of 120 molecules, and the results show an over-all accuracy of 74.8%, and 90% and 65% accuracies for BBB+ and BBB- molecules, respectively. This work serves as base for Cruciani et al. [2000] that used the same train-ing set of the previous work ([Crivori et al., 2000]) to predict the BBB penetration, and the same program (VolSurf) to calculate the molecular descriptors. The model was built
Chapter 2. State of the Art 11 based on PCA analysis and tested through cross-validation with an independent set of 35 molecules. Results show values above 75% for the overall accuracy, the other measures are not specified.
Trotter et al. [2001] used 172 molecules, 72 molecular descriptors and SVM to build a model. It was tested with 304 molecules, and the results show an overall accuracy of 76%, and 78.9% and 60.4% accuracy for BBB+ and BBB- molecules, respectively.
Neural networks (NN) and support vector machine (SVM) were tested by Doniger et al. [2000] to distinguish molecules capable of crossing the BBB from those that can not cross it. The model was trained with 324 molecules and 9 molecular descriptors, namely logP, MW, volume, surface area, percent of hydrophilic surface area, hydrogen bond donors/acceptors, and 3D hydrogen bonding. To validate the model, 30 different validation sets of 50 molecules were constituted through a ”bootstrapping approach”. Ac-cording to this approach, molecules are selected at random from the complete dataset. The best results were obtained with SVM: 82.7%, 80.2% and 81.5% for BBB+, BBB-and overall accuracies, respectively.
PCA and PLS were also used by Adenot and Lahana [2004] to build a model. To train the model, about 1696 molecules and 67 descriptors were used. Some of the descriptors are number of atoms, number of heteroatoms, MW, molecular volume, polar surface area, and others. The model was tested through cross-validation with a validation set of 82 molecules, and the results show an overall accuracy of 91%, and 90% and 92% accuracy for BBB+ and BBB- molecules, respectively.
Li et al. [2005b] perform several models in their study: LR (logistic regression), LDA (linear discriminate analysis), C4.5 DT (C4.5 decision tree), k-NN (k-nearest neighbor), PNN (probabilistic neural network) and SVM. It was used 415 molecules and 199 de-scriptors of the next classes: simpler molecular properties, molecular connectivity and shape, electrotopological state, quantum chemical properties and geometrical properties, and it was performed a 5-fold cross validation. Also in this study, the highest values were obtained with SVM models with an overall accuracy of 83.7%, and 88.6% and 75% accuracies for BBB+ and BBB- molecules, respectively.
Zhao et al. [2007] used recursive partioning and PLS, and two different training sets to build models. These authors used 19 descriptors namely, excess molar refraction, overall hydrogen-bond acidity/basicity, MW, polar surface area, logP, number of hydrogen bond-ing donors/acceptors, and others. The first trainbond-ing set with 1093 molecules was tested through a cross-validation with independent validation set of 500 molecules, and the re-sults show an overall accuracy of 97.2%, and 87.8% and 97.2% accuracies for BBB+ and BBB- molecules, respectively. The second training set with 1593 molecules was cross-validate with an independent validation set of 397 molecules, and the results show an overall accuracy of 74.6%, and 80.1% and 63.1% accuracies for BBB+ and BBB-molecules, respectively.
Chapter 2. State of the Art 12 Finally, Zhang et al. [2008] developed two methodologies including k-NN and SVM with 144 molecules. It was also applied an applicability domain (AD) that defines the area of the descriptors space in which models can accurately predict the target properties. Considering that, some of the molecules, that are not included in the chemical space of the modeling set, could not be predicted its classification. To test the models two independent validation sets, with 99 and 267 molecules were used. Without applying the AD, the test set achieves an overall accuracy of 82.5% and 59.0%. After applying the AD, the overall accuracy increases to 100% and 83.3%, however there is a reduction of the number of molecules for which the prediction could be made, mainly for the subset of BBB- molecules.
The implementation of an SVM methodology seems to be generalized in most of the studies described and most of the times the highest values of accuracy are associated with it. Although the comparison of results could be wrong since datasets are usually different. It is noteworthy that none of the studies take into account the imbalanced ratio between both classes of molecules.
Chapter 3
Methods
In this chapter, the fundamentals of molecular representation and encoding are presented, as well as the algorithms and statistical methods used. In Section 3.2 is presented the molecular representation used to encode molecules structure and all the molecular de-scriptors used to retain properties about molecules. Section 3.3 introduces the idea of similarity between molecules, presenting some of the coefficients used to measure this similarity. Section 3.1 makes a brief introduction to the tools used in this work to code and implement approaches. Moving to methods part, in Section 3.4 are presented the statistical methods and measures used to assess performance of the approaches. Finally, Section 3.5 comprises the three machine learning algorithms used to build the three ap-proaches presented in this work: k-Nearest Neighbor (k-NN), Neural Networks (NN) and Random Forests (RF).
3.1
Tools
3.1.1
R
R is an open source programming language and software environment for statistical com-puting and graphics, and it can be run in Windows. It is widely used for data analysis, and it has the advantage of being highly extensible, easy and offers a wide variety of functions. For this work it was installed R version 2.10.1. Principal Coordinates Analysis (PCoA), k-NN, NN and RF models were coded using available implementation (packages) of R.
3.1.2
Python
Python is a high-level programming language [Python, 23-10-2010], often used as a scripting language. It is free to use, with an open source license. For this work, it was used Python version 2.7 to code and obtain SMILES representation of molecules of constituted dataset, similarity matrices and molecular descriptors.
Python is widely used for bioinformatics and cheminformatics purposes [O’Boyle 13
Chapter 3. Methods 14 et al., 2008], due to its simple syntax and code readability, that make it an easy program-ming language to learn, compared with other programmig languages.
3.1.3
OpenBabel
OpenBabel is an open-source C++ toolkit with interfaces in Python. Scripting languages like Perl, Python and Ruby are ideally to solve common cheminformatics tasks, although they can be slower than compiled languages. For this reason, cheminformatics toolkits are often implemented in compiled languages, as C++ [O’Boyle et al., 2008]. This toolkit can deal with many molecular file formats containing thousands of molecules, manipu-late molecular data, supports molecular fingerprints, calculus of molecular descriptors, as LogP, iteration over molecules and many others functions. OpenBabel has interfaces to other programming languages (Perl, Ruby and Java), however the Python interface seems to be the most used [O’Boyle et al., 2008]. It can be accessed from two Python modules: (1) the standard Python bindings and (2) the Pybel.
1. Python bindings are generated using SWIG (Simplified Wrapper and Interface Gen-erator) [Beazley, 1996]. SWIG is a software development tool that connects pro-grams written in C and C++ with a variety of high-level programming language. In this way, it allows to use scripting languages with their C/C++ programs without worrying about the underlying implementations details of each language. The file generated by SWIG is then compiled and linked with the Python development li-braries and OpenBabel, creating a Python extension module, openbabel. The bind-ings provide access to the majority of the OpenBabel interfaces, namely the base classes as OBMol, OBAtom, OBBond, and OBResidue.
2. Pybel module wraps the bindings automatically generated by SWIG to give a more Pythonic 3 way to access OpenBabel [O’Boyle et al., 2008]. This module makes
easier to access features of the OpenBabel libraries from Python and a good fea-ture is the possibility of using both modules at the same time, by converting Atom and Molecule classes of Pybel to and from the OBAtom and OBMol of openbabel module, even because Pybel does not have all of the methods present in OpenBabel library.
Each module (openbabel and pybel) can be imported into a Python script using the import openbabeland import pybel statement, respectively.
Readind and writing molecule files is one of the tasks where using Pybel is advan-tageous. Pybel makes use of iterators from Python to iterate over collections of objects,
3It refers to a neologism: use Python language conventions and idioms, everything in the smallest number of code lines.
Chapter 3. Methods 15 which simplifies a lot the processes and in a few lines of code we can read and write molecule files, iterate over each atom in a molecule and some other features.
To use OpenBabel and Pybel it is necessary to download and install the binary installer for Windows (OpenBabelGUI, version 2.3.0), which includes command-line tools and a graphical user interface (GUI). Only then it is possible to install the OpenBabel Python bindings, version 1.6, to Python 2.5, 2.6, 2.7 and 3.1. With OpenBabel library, custom scripts can be coded without using a GUI or the command-line.
Some of the scripts were tested with Python version 3.1 and it was verified that some features of OpenBabel did not work.
3.2
Molecular representation
3.2.1
SMILES - Simplified Molecular Input Line Entry Specification
Brown [2009] refers that despite their apparent simplicity, ”molecules are complicated real-world objects”. SMILES (Simplified Molecular Input Line Entry Specification) lan-guage is a specification for describing the structure of chemical molecules using short ASCII strings and it contains the same informations that can be found in other represen-tations (as in extended connection table, InChI, InChIKey) however it is more human-readable and quite compact than the others. With this representation, molecules could be encoded by more than one SMILES string, so it could not be used as a unique identifier of a molecule structure. Nevertheless, in 1960s was proposed an algorithm that overcome this feature and provides a canonical ordering of atoms in a molecule.
Canonicalization
The canonicalization generates one generic SMILES among all equally valid SMILES, known as the ”unique SMILES”. Canonical SMILES are unique for each structure but it depends of the canonicalization algorithm used to generate it. This type of SMILES are generated regardless of the order of the atoms in the structure. Generic SMILES termed refers to labeled molecular graph (atoms and bonds). SMILES that also describe isotopic and chiral information are known as ”isomeric SMILES”, and an ”absolute SMILES” represent a unique isomeric SMILES.
SMILES Specification Rules
There are rules that guide SMILES representation, corresponding to specification of atoms, bonds, rings, branches, aromaticity, and disconnected structures [OpenSMILES, 12-05-2011, Weininger, 1988, Brown, 2009].
Atoms - are represented by their atomic symbol, in square brackets. The symbol has the same representation as in Periodic Table: first character is uppercase and the
Chapter 3. Methods 16 second, if exist, is lowercase. This rule is not applied if the atom is aromatic, for this case, the first character is lowercase. Some elements, B, C, N, O, P, S, F, Cl, Br and I are grouped in an ”organic subset”, and do not require brackets. When represented without brackets, this elements have the following properties: number of attached hydrogens conforms to the lowest normal valence is consistent with explicit bonds, the atom’s charge is zero, and the atom has no isotopic and chiral specification. The atoms inside brackets must have hydrogens and charge specified. The charge is specified by a ”+n” or ”-n”, where n is a number.
Bonds - adjacent atoms are assumed to have single or aromatic bonds, other type of bond has to be specified. Single, double, triple and aromatic bonds are represented by ’-’, ’=’, ’#’ and ’:’ respectively.
Rings - the first and the last atoms of a ring are labeled with numeric suffix to indicate connectivity between non-adjacent atoms. If there is more than one ring in the molecule structure, the label will be 2, and so on.
Branches - an atom with three or more bonds is called a branched atom, and is described using parentheses.
Aromaticity - can be represented in the Kekul´e form using alternating single and double bonds with atoms in uppercase, or using the ”aromatic atoms” (in lowercase), with no need of bond symbols.
Disconnected Structures - the ’.’ (dot) symbol is used to indicate not bonded atoms, and represent disconnected and ionic compounds.
Isomeric SMILES
Describes rules to specify stereochemistry, which covers the cis/trans configuration around a double bond and the chiral configuration of specific atoms in a molecule.
• The cis/trans configuration around double bonds is specified using the symbols ”\” and ”/”; these symbols appear in pairs indicating relative directionality between the connected atoms - ”same side” (cis) or ”opposite side” (trans).
• The configuration at tetrahedral carbon is specified by ’@’ or ”@@”. Considering the chiral center, the remaining three atoms are written from left to right, that means, in anticlockwise order using the ’@’ symbol. To describe atoms in a clockwise order, then ”@@” symbols are used.
Chapter 3. Methods 17
3.2.2
Molecular descriptors
Molecular descriptors have been used as input for statistical studies as a source to make assumptions in very different studies that treat the permeability of BBB to drug molecules [Li et al., 2005a]. They aim to be descriptions of molecules that capture relevant aspects of them, mainly quantitative descriptions of structural and physicochemical properties of molecules.
In this work only structural properties of molecules (physicochemical properties) were used as molecular descriptors. This class of descriptors provides values of physical prop-erties of molecules [Brown, 2009]. Below are presented all the molecular descriptors used in the context of this work.
Molecular Weight (MW) - represent a summation according to the number and type of atoms that constitute the molecule.
Average Molecular Weight (AMW) - is a variation of MW, representing the mean of MW by the total number of atoms present in the molecule.
LogP - represent the octanol-water partition coefficient and it is widely used in quantita-tive structure-activity relationship (QSAR) methods as a descriptor of cell perme-ability, providing a measure of solubility or lipophilicity of a molecule [Wildman and Crippen, 1999], therefore it is an important parameter in the study of new drug molecules [Brown, 2009]. Nevertheless, its measurements are time-consuming, ex-pensive and difficult to get. To overcome these difficulties were developed methods to calculate logP based on molecular structure. There are many different approaches to perform this calculations but it can be highlighted two main approaches, regard-ing to fragments methods and atom-based approach. LogP obtained through these methods is often called ClogP [Wildman and Crippen, 1999, Daylight, 2-10-2011].
logP = log( [solute]octanol
[soluteun−ionizedwater ]) (3.1) Number of Rings (NRing) - represent the number of rings in a given molecule.
Number of Bonds in Rings (NBRing) - represent the number of bonds in a ring, ignor-ing the type of bond.
Multiplicity - for each of the following atoms, C, N, O, S, Br, I, Cl, F, and Na it was considered the number of possible bonds that atoms can do, ignoring possible hy-drogen bonds. Considering the carbon atom for example we could have: C-1, C-2, C-3, C-4, that means, carbon bonded to one substituent atom1and bonded to three
1For the context of multiplicity, a substituent represent an atom or group of atoms substituted in place of a hydrogen on the considered atom.
Chapter 3. Methods 18 hydrogens, carbon bonded to two substituent atoms and bonded to two hydrogens and so on. For each atom are considered all possible multiplicities, and for each of the multiplicities are counted the number of occurences in a molecule. So, we can consider each multiplicity as a molecular descriptor (table 3.1).
Fingerprints – is a vector representation of molecules, in each molecule is encoded in a binary string that each bit represents the presence or absence of a substructure. Each bit of fingerprints, in a total of 1023, will be considered a molecular descriptor in order to represent the presence of a particular piece in molecules, and it will retain the number of occurences of the substructure encoded in the bit. Due to the complexity of fingerprints, the next section is dedicated to present fingerprints and their characteristics.
Table 3.1: Multiplicities used as molecular descriptors.
Element Atomic number-number of bonds Carbon (C) 6-1, 6-2, 6-3, 6-4 Nitrogen (N) 7-1, 7-2, 7-3, 7-4 Oxygen (O) 8-0, 8-1, 8-2 Fluorine (F) 9-1 Sodium (Na) 11-0 Phosphorus (P) 15-4 Sulfur (S) 16-1, 16-2, 16-3, 16-4 Chlorine (Cl) 17-0, 17-1 Calcium (Ca) 20-0 Bromine (Br) 35-0, 35-1 Iodine (I) 53-1
3.2.3
Fingerprints
Molecular fingerprints are used to encode molecular structure in a series of binary digits (bits) that represent the presence or absence of particular substructures in the molecule. Fingerprints can be divided into two types: structure-key and hash-key fingerprints. Structure-Key Fingerprints
The structure-key fingerprint is based on a dictionary of defined substructures to generate a binary (0 or 1) string where each bit equates one substructure in the dictionary. So, in this kind of fingerprints an on-bit (1) in seventh fingerprint position (fp2) corresponds to a defined substructure in the dictionary.
2Abbreviation to refer to fingerprint position will be done in lowercase to distinguish from FP of False Positives.
Chapter 3. Methods 19 This type of fingerprints was the start point to a new generation of fingerprints, the hash-key fingerprints, since the oldest ones have several disadvantages. Some of them are:
• Lack of generality. It is necessary to choose in advance the patterns to be included in the ”dictionary” of keys, it reflects the nature of the research area in which dic-tionary will be applied. So, because of that, it can hardly be used in other types of research areas.
• Mostly zeros. As the dictionary of substructure keys are build by users, a typical molecule will contain very few of the patterns represented by the structural key’s bits.
• Patterns are not overlapped. Although a molecule shares portions with other pat-terns, this type of fingerprints does not consider this. So, more complex molecules are not accurately characterized.
Hash-Key Fingerprints
In hash-key fingerprints there are no predefined database of substructures, instead the keys are generated based simply on the molecule. In this type of fingerprints, there is no assigned meaning to each bit. This fingerprint enumerates multiple atom-bond paths from each molecule, generally with a path length of 0 to 7.
With hashing method, the same bit can map several substructures, because of that a match does not guarantee the presence of a particular substructure, on the contrary if a fingerprint indicates the missing of a substructure then it certainly is.
Pybel provides four types of fingerprints, FP2 corresponds to a hash-fingerprint defi-nition and it is the most common type [Babel, 4-11-2010].
The FP2 fingerprint type generates bits from 0 to 1024. For each molecule, pybel returns an output record (figure 3.1) [dalke scientific, 6-7-2011].
Figure 3.1: Pybel representation of bits for a FP2 fingerprint.
This output contains a fingerprint with 6 groups of 5 lines, with exception for two of the groups that have two more lines. Each group has 8 hexadecimal values and each of these are 4 bits, so in total we should have 1024 bits for each fingerprint ((5 x 6 + 2) x 8 x 4 = 1024).
Chapter 3. Methods 20 Open Babel GUI gives a list of the chemical fragments used to set bits [Babel, 21-09-2010]. Below is an example of an output showing the on-bits and respective fragments for acetylsalicylic acid (commonly named Aspirin) represented by
C1 = CC = CC(= C1C(O) = O)OC(C) = O 0 6 1 6 <670> 0 6 1 6 5 6 1 8 1 6 1 6 <463> 0 6 1 8 1 6 <105> 0 6 1 8 1 6 1 6 <655> 0 6 1 8 1 6 5 6 1 6 <104> 0 6 5 6 <81> 0 6 5 6 1 6 <473> 0 6 5 6 1 8 1 6 <568> 0 6 5 6 1 8 1 6 1 6 <1018> . . .
The first digit of each line of the output indicates whether the fragment is linear (0) or cyclic (1) and the remaining digits indicate the atomic number and bond order alterna-tively. For example, the first bit of the output (670) represent a carbon (atomic number 6) bonded to another carbon by a single bond (1). If we have digit 2 instead of 1, it means that carbons are bonded with a double bond, and so on.
3.3
Molecular similarity
Most of the times, molecular similarity is calculated with a coefficient that compares two molecular fingerprints. Once we got the fingerprints representation of a molecule it is easy to calculate a measure of similarity between two molecules. A similarity measure based on fingerprints can be seen as a mathematical approach, in which on-bits in the fingerprints are compared between two molecules. Molecules are described by the pres-ence or abspres-ence of substructures, so four terms a, b, c, and d are considered, which are represented in a two-by-two contingency table (Table 3.2).
Where:
a - count of bits on in object A but not in object B b - count of bits on in object B but not in object A c - count of bits on in both object A and object B d - count of bits off in both object A and object B n - total number of bits (a + b + c + d)
Chapter 3. Methods 21 Table 3.2: Contingency table representing the four terms that describe presence and ab-sence of features between two molecules.
Molecule B 0 1 Total Molecule A 0 d b d + b 1 a c a + c Total a + d b + c n
A number of distance metrics can be calculated for binary fingerprints. All the mea-sures applied in this work are actually similarity meamea-sures and thus represent the reverse of a distance metric and so the distance can be obtained by subtracting the value from 1.0.
Similarity measures are often classified into two categories:
measures of co-occurence - range from 0 to 1 and their numerator usually consists of a a + d.
measures of association - range from -1 to 1 and their numerator usually contain ad-bc. Similarity measures
Next we define all the measures [Daylight, 3-12-2010] used in this work:
Cosine is the ratio of the bits in common to the geometric mean of the number of on bits in the two molecules.
Cosine = q c
(a + c)(b + c) (3.2) Dice is the ratio of the bits in common to the arithmetic mean of the number of on bits in
the two molecules.
Dice = 2.c
a + b + 2.c (3.3) Euclidean is function of d, so it is dependent on the double zeros.
Euclidean = s c + d a + b + c + d (3.4) Forbes F orbes = c(a + b + c + d) (a + c)(b + c) (3.5) Hamman Hamman = (c + d) − (a + b) a + b + c + d (3.6)
Chapter 3. Methods 22 Kulczynski represent the mean of the individual substructures similarities.
Kulczynski = 0.5( c a + c + c b + c) (3.7) Manhattan M anhattan = a + b a + b + c + d (3.8) Matching M atching = c + d a + b + c + d (3.9) Pearson P earson = q c.d − a.b (a + c) ∗ (b + c) ∗ (a + d) ∗ (b + d) (3.10) Rogers-Tanimoto Rogers − T animoto = c + d 2.a + 2.b + c + d (3.11) Russel-Rao Russel − Rao = c a + b + c + d (3.12) Simpson is the best of the individual substructures similarities.
Simpson = c
min((a + c), (b + c)) (3.13) Tanimoto is independent of d. It represents the proportion of the on-bits shared.
T animoto = c a + b + c (3.14) Yule Y ule = c.d − a.b c.d + a.b (3.15)
3.4
Statistical methods
3.4.1
Principal Coordinates Analysis
Principal Coordinates Analysis (PCoA), also known as Classical Multidimensional Scal-ing (CMDS), is a statistical technique that provides a graphical representation of the pat-tern of proximities in a given set of objects.
PCoA is an unsupervised statistical learning method and it can be seen as a clustering method that determines natural groupings of objects based solely on their independent variables, such as molecular descriptors. The supervised statistical learning methods use
Chapter 3. Methods 23 a different approach, that consists in using a priori information regarding the classes to which the objects in a training set belongs, as k-NN and NN.
Figure 3.2: Molecules representation in a two dimensional space, after applying cmdscale function, considering Tanimoto measures. The red and blue circles represent molecules able to cross the barrier and not able to cross it, respectively.
PCoA objects are represented as points in a low dimensional (typically two or three) Euclidean space, where distances between the points match the original distances as well as possible. This technique is based on an eigenvalue equation where a symmetric matrix M of n objects (n x n) with a (i, j)th entry, dij, gives a measure of the relationship between the ith and jth objects. The basic idea is that the symmetric matrix contains distance in-formations and the goal is to obtain a set of n points in p dimensions whose interdistances approximate the matrix. Usually, PCoA is used to represent a set of objects in a two-dimensional space, however a low number of dimensions may prove to be insufficient to properly represent data. In this case, the number of dimensions should be increased. The result is useless if the only purpose is to have a visual representation of data. Although, PCoA can be used as a dimension reduction method, transforming the original matrix into a simple and more small distance matrix. A simplified view of the method is as follow:
1. Assign points to arbitrary coordinates in a n-dimensional space; 2. Compute euclidean distances among all pairs of points;
3. Adjust coordinates of each point to get the best representation.
Principal Coordinates Analysis can be done in R by using the cmdscale function [CRAN-R, 29-10-2010]. cmdscale() takes a n x n distance matrix M, and returns a n
Chapter 3. Methods 24 x p matrix Y, in which a row represents the coordinates of n points in p-dimensional space for some p < n. The input has to be square and symmetric indicating relationships between objects, in our case, between molecules.
This technique gives, for each molecule, a vector of coordinates, allowing their simple representation in space, that transmits similarities between molecules.
For our work, we are mainly interested in the classification of molecules in their ability to cross the BBB. The original symmetrical matrix contains distances between molecules, according to its structural similarity.
Figure 3.2 shows the molecules representation, in a two-dimensional space, where red circles are molecules that can penetrate the BBB and blue circles molecules that can not penetrate the BBB. Of the figure, some little clusters of just one color can be identified, meaning that molecules with a clssification tend to be closer of molecules with the same classification.
3.4.2
Statistical measures
In order to classify the results obtained from the algorithm’s analysis various statistical measures are available [Carugo, 2007, Hripcsak and Rothschild, 2005, Baldi et al., 2000]. The degree of reliability of each prediction was estimated with the confusion matrix. The matrix represents a classification of features in positive and negative. In our work, the ability to cross the BBB is considered as the positive feature, so we refer them as ”positive molecules”; on the other hand, the absence of the ability to cross the BBB is considered the negative feature, so molecules are referred as ”negative molecules”.
From the confusion matrix we can define the four following quantities:
True Positives (TP) = number of positive molecules that are correctly predicted; True Negatives (TN) = number of negative molecules that are correctly predicted; False Positives (FP) = number of negative molecules that are (incorrectly) predicted to be positive; and
False Negative (FN) = number of molecules that are predicted to be negative despite they are positive.
The matrix is formed by two rows and two columns that report the number of the four quantities previously explained. Each column of the matrix represents the instances in the predicted class, while each row represents the instances observed in the class (Table 3.3).
Table 3.3: A confusion matrix.
Real + -Predicted + TP FP
Chapter 3. Methods 25 Precision
Precision is defined as the proportion of the true positives against all the positive results. It gives a rate of the ”positive molecules” (TP) that are correctly classified among the total of molecules classified as ”positive molecules” (the sum of TP and FP).
P recision = T P
T P + F P (3.16) Recall
Recall, or sensitivity, is a measure of the ability of a system to recognize all positive cases, it is defined as the number of TP divided by the total number of elements that actually belong to the positive class (the sum of TP and FN). This measure gives us a proportion of ”positive molecules”, but, unlike precision, it is according to the total of molecules that really are positive.
Recall = T P
T P + F N (3.17) Precision and Recall are widely used for evaluate the correctness of a pattern recogni-tion algorithm. Precision can be seen as a measure of exactness or fidelity, whereas recall is a measure of completeness. Both of them may range from 0 to 1, the latter value being associated with perfect predictions.
Accuracy
Accuracy computes the fraction of instances for which the correct result is returned, that means, the proportion of true results (both TP and TN). Its values range between 0 and 1, where 1 means that the predicted values are exactly the same as the given values. With this measure both ”positive molecules” and ”negative molecules” are considered, in the global of possible labels (”positive” and ”negative molecules” correct or incorrect classified).
Accuracy = T P + T N
T P + F P + T N + F N (3.18) The measures explained so far do not take the true negative rate into account, so it is necessary to resort to other measures to assess the performance of a binary classifier. Moreover, none of the measures presented previously can alone describe perfectly a con-fusion matrix. Even giving a measure of correctness values for both classes (positive and negative), accuracy can sometimes fail in the true quality of a system, mainly when classes are unbalanced. This lead us to another measure: the phi measure.

![Figure 2.3: The five routes of transport via blood-brain barrier [Abbott et al., 2006].](https://thumb-eu.123doks.com/thumbv2/123dok_br/19289879.991384/29.892.130.762.487.960/figure-routes-transport-blood-brain-barrier-abbott-et.webp)

![Figure 3.4: Feed-forward network with a single hidden layer. Adapted from Santos and Azevedo [2005]](https://thumb-eu.123doks.com/thumbv2/123dok_br/19289879.991384/52.892.176.753.125.524/figure-forward-network-single-hidden-adapted-santos-azevedo.webp)