doi:10.1093/eurpub/ckx143
. . . .
Prevalence of adult overweight and obesity in 20
European countries, 2014
Adilson Marques1,2, Miguel Peralta3, Ana Naia3,4, Nuno Loureiro5, Margarida Gaspar de Matos3,6,7
1 Centro Interdisciplinar de Estudo da Performance Humana, Faculdade de Motricidade Humana, Universidade de Lisboa, Lisboa, Portugal
2 Centro de Investigac¸a˜o em Sau´de Pu´blica, Escola Nacional de Sau´de Pu´blica, Universidade Nova de Lisboa, Lisboa, Portugal
3 Faculdade de Motricidade Humana, Universidade de Lisboa, Lisboa, Portugal
4 Centro de Investigac¸a˜o em Arquitetura, Urbanismo e Design (CIAUD), Faculdade de Arquitetura, Universidade de Lisboa, Lisboa, Portugal
5 Escola Superior de Educac¸a˜o, Instituto Polite´cnico de Beja, Beja, Portugal
6 Instituto de Sau´de Ambiental, Faculdade de Medicina, Universidade de Lisboa, Lisboa, Portugal 7 William James Center for Research, Instituto Superior de Psicologia Aplicada, Lisboa, Portugal
Correspondence:Adilson Marques, Departamento de Educac¸a˜o, Cieˆncias Sociais e Humanidades, Faculdade de Motricidade Humana, Universidade de Lisboa, Estrada da Costa, 1499-002, Cruz Quebrada, Dafundo, Portugal, Tel: +351 214149100, Fax: +351 214151248, e-mail: [email protected]
Background:Monitoring obesity and overweight prevalence is important for assessing interventions aimed at preventing or reducing the burden of obesity. This study aimed to provide current data regarding the prevalence of overweight and obesity of adults, from 20 European countries. Methods: Participants were 34 814 (16 482 men) adults with mean age 50.817.7. Data from European Social Survey round 7, 2014, were analysed. Body mass index (BMI) was calculated from self-reported height and weight.Results:The proportion of underweight was only 2%, and 44.9% for normal weight. Overweight and obese accounted for 53.1%. More men than women were overweight (44.7% vs. 30.5%). Older adults were significantly more overweight (42.4%) and obese (20.9%) than middle age and younger adults. Retired people account for a greater proportion of overweight (42.0%) and obese (21.5%), when compared with employed, unemployed and students. People from rural areas were significantly more overweight (39.1 vs. 36.1%) and obese (17.0 vs. 15.3%) than those who lived in urban areas. The estimates indicate that the highest prevalence of overweight was in Czech Republic (45.2%), Hungary (43.7%) and Lithuania (41.7%). For obesity, Slovenia (20.8%), Estonia (19.7%) and the United Kingdom (19.2%) were the countries with the highest prevalence.Conclusion: Even though data was self-reported, and individuals tend to overestimate their height and underestimate their weight, the prevalence of overweight and obesity is considered high. More than half of the European population is overweight and obese. This study strengthens and updates the claims of an excessive weight epidemic in Europe.
. . . .
Introduction
I
n recent years, a levelling off has been reported in the prevalence of overweight and obesity among children1,2and adults3,4in several countries. Despite this, the prevalence of overweight and obesity is still high and is a clinical and public health burden worldwide.5–7Obesity is a major risk cause of several comorbidities such as car-diovascular diseases, cancers, type II diabetes and other health problems, which can lead to morbidity and mortality.8 It is also associated with osteoarthritis, asthma and depression.9Besides the health burdens, overweight and obesity are also related to substantial economic costs. If health-related comorbidity is included, it is estimated that overweight and obesity account for between 54 and 59% of the estimated medical costs.10Thus, overweight and obesity are the focus of many public health concerns regarding prevention, control and the decrease of prevalence.11–13
Studies in the European and worldwide populations have shown that the prevalence of overweight and obesity is high. In Europe the prevalence of overweight is estimated to be near 50%14,15and the prevalence of obesity to be around 16%16,17 of the population. Additionally, a recent OECD report shows that the prevalence of obesity increased from 11% in 2000 to 16% in 2014, on average across European member states.16 Results of the European population studies are in line with the worldwide increasing trend in obesity.18Thus, monitoring obesity and overweight prevalence is important for assessing interventions aimed at preventing or
reducing the burden of obesity. The purpose of this study was to provide current data regarding the prevalence of overweight and obesity of adults, from 20 European countries. A relationship was observed between the prevalence of overweight and obesity and socio-economic characteristics of European adults.
Methods
Study design, participants and procedures
Data from European Social Survey round 7, 2014, were analysed. The European Social Survey is an academically driven cross-national survey that has been conducted every two years across Europe and Israel since 2000. The survey measures the attitudes, beliefs and behaviour of European people. The European Social Survey uses a probability cluster sampling design to provide national representa-tive samples among countries. According to national options, par-ticipants were sampled by means of postal code address files, population registers, social security register data, or telephone books. In each country information was collected using a question-naire filled-in through an hour-long face-to-face interview that included questions on the use of medicine, immigration, citizenship, socio-demographic and socioeconomic issues, health perception and physical activity. The questionnaire was translated, by language experts, into the language of each of the participating countries. Further details about European Social Survey are available
elsewhere.19 The study protocol subscribes the Declaration on Professional Ethics of the International Statistical Institute (http:// www.europeansocialsurvey.org/about/ethics.html).
The European Social Survey round 7, 2014, included participants from Austria, Belgium, Czech Republic, Denmark, Estonia, Finland, France, Germany, Hungary, Ireland, Israel, Lithuania, Netherlands, Norway, Poland, Portugal, Slovenia, Spain, Sweden, Switzerland, UK, comprising 40 185 participants. For the present study, only adults were selected, thus participants younger than 18 years of age were excluded (n= 1215). Since Israel is not a European country, its citizens were excluded (n= 2562). Those who did not report height and weight (n= 1379), and at least 4 socio-demographic character-istics (n= 215) were also excluded. The final sample comprised 34814 (16 482 men, 18 332 women) with mean age 50.817.7 (50.317.6 men, 51.217.8 women).
Measures
Body mass index
Body mass index was calculated from self-reported height and weight (kg/m2). BMI categories were calculated in accordance with World Health Organization guidelines:20 underweight < (18.5 kg/ m2), normal weight (18.5–24.9 kg/m2), overweight (25–29.9 kg/m2)
and obese (30 kg/m2).
Socio-demographic characteristics
Participants reported their gender and age. Using reported age, par-ticipants were categorized into three age groups (18–39, 40–59 and60 years). Based on the International Standard Classification of Education,21participants were grouped into less than high school, high school education and superior education. Participants were asked to report what they were doing for the last 7 days. Response options were: paid work (employed), studying (education), unemployed actively looking for a job, unemployed but not actively looking for a job, retired, military service and others. Both unemployed categories were classified into a single category: unemployed. Those who were doing military service were considered employed. To determine the living place, participants were asked to report whether they lived in a big city, suburbs or outskirts of a big city, town or small city, country village, or home in countryside. Those who indicated that they lived in a big city, or suburbs, or outskirts of a big city were grouped into a new category named urban areas; those who responded that they lived in country village or home in countryside were grouped into rural areas. Respondents were asked to describe whether they lived with or without a husband/wife/partner, and their correspondent legal status (e.g. married, civil union, illegally recognized). Response options were dichotomized into live with or without a partner. Household income was determined based on decile. Using this data, 1st to 3rd decile, 4th to 7th decile, and 8th to 10th were grouped to create three groups: low, middle and high, respectively.
Statistical analysis
Descriptive statistics were calculated for all variables (means, standard deviation and percentages). Regarding the prevalence of weight status, according to socio-demographic characteristics and by countries, the percentage was calculated, with a 95% confidence interval (CI). The differences between participants’ socio-demographic characteristics and weight status were tested by Chi-square test. Data analysis was performed using IBM SPSS Statistics version 22 (SPSS Inc., an IBM Company, Chicago, IL). When statistical tests were applied, the level of significance was set atP< 0.05.
Results
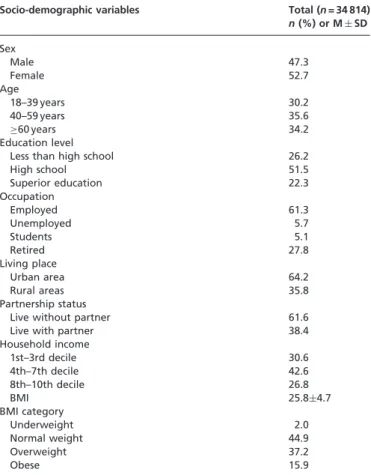
Table 1 presents the participants’ characteristics. For the total sample, the average BMI was 25.84.7. The proportion of under-weight was only 2%, and 44.9% for normal under-weight. Overunder-weight and obese accounted for 53.1%.
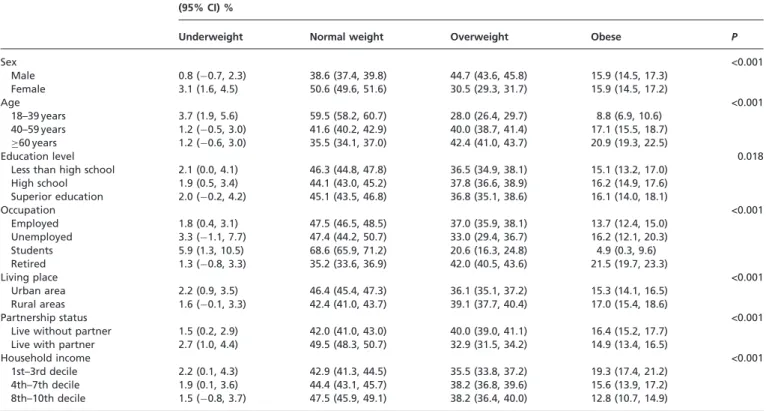
The prevalence of weight status according socio-demographic characteristics is presented in table 2. Significantly more women than men were underweight (3.1%, 95% CI: 1.6–4.5 vs. 0.8%, 95% CI: 0.7 to 2.3%). Conversely, more men than women were overweight (44.7%, 95% CI: 43.6–45.8 vs. 30.5%, 95% CI: 29.3– 31.7%). Older adults were significantly more overweight (42.4%, 95% CI: 41.0–43.7%) and obese (20.9%, 95% CI: 19.3–22.5%) than middle age and younger adults. Perhaps related with age, retired people account for a greater proportion of overweight (42.0%, 95% CI: 40.5–43.6%) and obese (21.5%, 95% CI: 19.7– 23.3%), when compared with employed, unemployed and students. People from rural areas were significantly more overweight (39.1%, 95% CI: 37.7–40.4% vs. 36.1%, 95% CI: 35.1– 37.2%) and obese (17.0%, 95% CI: 15.4–18.6% vs. 15.3%, 95% CI: 14.1–17.7%) than those who lived in urban areas. Forty per cent (95% CI: 39.0–41.1%) of those who live without a partner were overweight compared with 32.9% (95% CI: 31.5–34.2%). For household income, the prevalence of obesity of people from 1st to 3rd decile was 19.3% (95% CI: 17.4–21.2%), higher than those from 4th to 7th decile (15.6%, 95% CI: 13.9–17.2%) and 8th to 10th decile (12.8%, 95% CI: 10.7–14.9%).
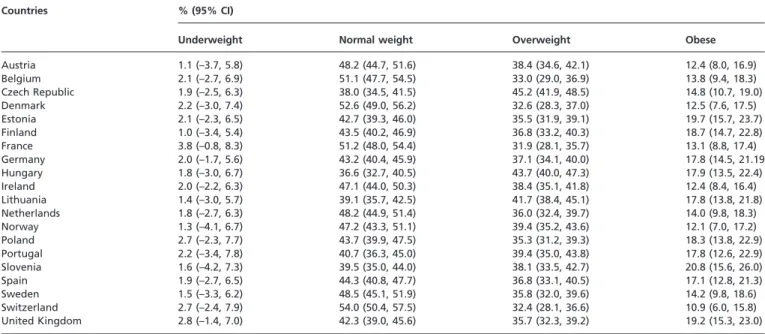
European countries estimates of the prevalence of overweight and obesity are shown intable 3. The estimates indicate that the highest prevalence of overweight was in Czech Republic (45.2%, 95% CI: 41.9–48.5%), Hungary (43.7%, 95% CI: 40.0–47.3%) and Lithuania (41.7%, 95% CI: 38.4–45.1%). For obesity, Slovenia (20.8%, 95% CI: Table 1 Participants’ characteristics
Socio-demographic variables Total (n= 34 814)
n(%) or MSD
Sex
Male 47.3
Female 52.7
Age
18–39 years 30.2
40–59 years 35.6
60 years 34.2
Education level
Less than high school 26.2
High school 51.5
Superior education 22.3
Occupation
Employed 61.3
Unemployed 5.7
Students 5.1
Retired 27.8
Living place
Urban area 64.2
Rural areas 35.8
Partnership status
Live without partner 61.6
Live with partner 38.4
Household income
1st–3rd decile 30.6
4th–7th decile 42.6
8th–10th decile 26.8
BMI 25.84.7
BMI category
Underweight 2.0
Normal weight 44.9
Overweight 37.2
Obese 15.9
BMI, body mass index; M, mean; SD, standard deviation.
15.6–26.0%), Estonia (19.7%, 95% CI: 15.7–23.7%) and the United Kingdom (19.2%, 95% CI: 15.3–23.0%) were the countries with the highest prevalence.
Figure 1presents the results of overweight and obesity, as excess weight, by European country. For all countries, the prevalence of overweight and obesity account for 46.9%. The countries, with figures, were Hungary (61.6%), Czech Republic (60.1%) and Lithuania (59.6%). These countries contrasted with Switzerland (43.3%), France (45%) and Denmark (45.2%), which had the lowest prevalence.
Discussion
This study provides current data regarding the prevalence of overweight and obesity in adults from 20 European countries. In 2014, the prevalence of adult overweight and obesity in European countries was 53.1%. The overall prevalence was higher in Eastern European countries when compared with central and northern countries. Moreover, the prevalence of overweight and obesity was related with socioeconomic characteristics, which indicated that there may be a relationship with social iniquities.
The prevalence of overweight was higher among men than among women, which is in accordance with recent studies findings.22–24
Also, overweight and obesity was greater among adults above 64 years old, which is similar to other studies stating an increased overweight and obesity prevalence with age.24–26 Age and gender findings suggest that the older population, and older men in particular, should be considered a priority group for overweight and obesity prevention in Europe.
Low socioeconomic status is previously described as associated to obesity,27,28as observed in the present study. The socioeconomic
status may indirectly influence weight status through dietary habits,27,29good access to exercise facilities,30health literacy31and physical activity participation.29,32Similar to the older population, low-income households should receive attention for overweight and obesity prevention in Europe.
Those living in rural areas presented a higher prevalence of overweight and obesity. Although results are in line with previous research,24,33to better understand the relationship between obesity and living place one should also consider the degree of rurality, the socioeconomic status and the geography.33
The prevalence of overweight and obesity was different across European countries, from approximately 32 to 45% for overweight and 11–20% for obesity. Eastern European countries (e.g. Hungary, Chez Republic, Lithuania and Slovenia) presented a higher prevalence of combined overweight and obesity than central Europe (e.g. Switzerland, France and Belgium), and northern European countries (e.g. Denmark and Sweden). To a certain extent, the variations in the prevalence of overweight and obesity may be the result of differences in sedentary lifestyle and lack of physical activity.34–37 However, other factors may also explain this variation on the European continent: the built environment, eating habits and physiological and genetic differences.34It is interesting to notice that the prevalence of overweight and obesity is higher in eastern European countries and among those from lower socioeconomic status. Since eastern European countries are known to have less economic power than centre and northern European countries and possibly more population from the lower socioeconomic status, these two findings could be connected. This connection strengthens the idea that overweight and obesity may be related with social iniquities and that social and geographic differ-ences across Europe are responsible for the differdiffer-ences in the prevalence of overweight and obesity. Thus, it is important to develop effective healthy lifestyles programs enhancing health literacy, especially regarding eating behaviours and physical activity. Also, understanding and improving the built environment in order to promote opportunities to engage in physical activity are necessary actions to prevent these conditions.
This study has limitations that should be acknowledged. Whereas, the BMI classification system possesses important utility in studying population health, it has limitations. BMI can be biased when based on self-reported height and weight, with individuals traditionally Table 2 Prevalence of weight status according to socioeconomic characteristics
(95% CI) %
Underweight Normal weight Overweight Obese P
Sex <0.001
Male 0.8 ( 0.7, 2.3) 38.6 (37.4, 39.8) 44.7 (43.6, 45.8) 15.9 (14.5, 17.3) Female 3.1 (1.6, 4.5) 50.6 (49.6, 51.6) 30.5 (29.3, 31.7) 15.9 (14.5, 17.2)
Age <0.001
18–39 years 3.7 (1.9, 5.6) 59.5 (58.2, 60.7) 28.0 (26.4, 29.7) 8.8 (6.9, 10.6) 40–59 years 1.2 ( 0.5, 3.0) 41.6 (40.2, 42.9) 40.0 (38.7, 41.4) 17.1 (15.5, 18.7) 60 years 1.2 ( 0.6, 3.0) 35.5 (34.1, 37.0) 42.4 (41.0, 43.7) 20.9 (19.3, 22.5)
Education level 0.018
Less than high school 2.1 (0.0, 4.1) 46.3 (44.8, 47.8) 36.5 (34.9, 38.1) 15.1 (13.2, 17.0) High school 1.9 (0.5, 3.4) 44.1 (43.0, 45.2) 37.8 (36.6, 38.9) 16.2 (14.9, 17.6) Superior education 2.0 ( 0.2, 4.2) 45.1 (43.5, 46.8) 36.8 (35.1, 38.6) 16.1 (14.0, 18.1)
Occupation <0.001
Employed 1.8 (0.4, 3.1) 47.5 (46.5, 48.5) 37.0 (35.9, 38.1) 13.7 (12.4, 15.0) Unemployed 3.3 ( 1.1, 7.7) 47.4 (44.2, 50.7) 33.0 (29.4, 36.7) 16.2 (12.1, 20.3) Students 5.9 (1.3, 10.5) 68.6 (65.9, 71.2) 20.6 (16.3, 24.8) 4.9 (0.3, 9.6) Retired 1.3 ( 0.8, 3.3) 35.2 (33.6, 36.9) 42.0 (40.5, 43.6) 21.5 (19.7, 23.3)
Living place <0.001
Urban area 2.2 (0.9, 3.5) 46.4 (45.4, 47.3) 36.1 (35.1, 37.2) 15.3 (14.1, 16.5) Rural areas 1.6 ( 0.1, 3.3) 42.4 (41.0, 43.7) 39.1 (37.7, 40.4) 17.0 (15.4, 18.6)
Partnership status <0.001
Live without partner 1.5 (0.2, 2.9) 42.0 (41.0, 43.0) 40.0 (39.0, 41.1) 16.4 (15.2, 17.7) Live with partner 2.7 (1.0, 4.4) 49.5 (48.3, 50.7) 32.9 (31.5, 34.2) 14.9 (13.4, 16.5)
Household income <0.001
1st–3rd decile 2.2 (0.1, 4.3) 42.9 (41.3, 44.5) 35.5 (33.8, 37.2) 19.3 (17.4, 21.2) 4th–7th decile 1.9 (0.1, 3.6) 44.4 (43.1, 45.7) 38.2 (36.8, 39.6) 15.6 (13.9, 17.2) 8th–10th decile 1.5 ( 0.8, 3.7) 47.5 (45.9, 49.1) 38.2 (36.4, 40.0) 12.8 (10.7, 14.9)
Differences between weight status and socio-demographic characteristics were tested by Chi-square.
overestimating their height and underestimating their weight.38In
addition, BMI classifications can be inaccurate for certain groups (e.g. professional athletes or those possessing a high level of muscle mass),39because it does not distinguish between body fat
and muscle mass.
Even though data was self-reported, and individuals tend to over-estimate their height and underover-estimate their weight, the prevalence of overweight and obesity is considered high. As findings suggest that more than half of the European population is overweight and obese, this study strengthens and updates the claims of an excessive weight epidemic in Europe. There are certain risk factors for obesity that appear to be universal, transcending national boundaries and
operating in the dense network of interconnections between biology and culture, but also indications of specific risk factors operating with selective potency in particular countries.34Therefore, there is a
need for a medical management approach to overweight and obesity, and shifts in public health policy, at the European and country-specific levels. Health care professionals should advise patients on the importance of maintaining a healthy weight.40Considering that
even slight weight loss (roughly 5% of initial weight) is considered to be associated with significant improvements in health, and with reduced costs to the health care system and society at large, it is important to develop effective healthy lifestyles programs enhancing health literacy about these conditions.
38.4% 39.9% 40.4% 41.1% 42.9% 44.5% 44.8% 45.1% 45.1% 46.2% 46.4% 46.9% 48.5% 49.2% 49.2% 49.9% 50.0% 53.2% 54.8% 55.0% 56.7%
61.6% 60.1% 59.6% 58.9% 57.1% 55.5% 55.2% 54.9% 54.9% 53.8% 53.6% 53.1% 51.5% 50.8% 50.8% 50.1% 50.0% 46.8% 45.2% 45.0% 43.3%
0% 10% 20% 30% 40% 50% 60% 70% 80% 90% 100%
Hungary Czech Republic Lithuania Slovenia Portugal Finland Estonia United Kingdom Germany Spain Poland Total Norway Ireland Austria Netherlands Sweden Belgium Denmark France Switzerland
Under and normal weight Overweight and obese
Figure 1 Prevalence of overweight and obesity in European countries
Table 3 Prevalence of weight status by European countries
Countries % (95% CI)
Underweight Normal weight Overweight Obese
Austria 1.1 (–3.7, 5.8) 48.2 (44.7, 51.6) 38.4 (34.6, 42.1) 12.4 (8.0, 16.9)
Belgium 2.1 (–2.7, 6.9) 51.1 (47.7, 54.5) 33.0 (29.0, 36.9) 13.8 (9.4, 18.3)
Czech Republic 1.9 (–2.5, 6.3) 38.0 (34.5, 41.5) 45.2 (41.9, 48.5) 14.8 (10.7, 19.0)
Denmark 2.2 (–3.0, 7.4) 52.6 (49.0, 56.2) 32.6 (28.3, 37.0) 12.5 (7.6, 17.5)
Estonia 2.1 (–2.3, 6.5) 42.7 (39.3, 46.0) 35.5 (31.9, 39.1) 19.7 (15.7, 23.7)
Finland 1.0 (–3.4, 5.4) 43.5 (40.2, 46.9) 36.8 (33.2, 40.3) 18.7 (14.7, 22.8)
France 3.8 (–0.8, 8.3) 51.2 (48.0, 54.4) 31.9 (28.1, 35.7) 13.1 (8.8, 17.4)
Germany 2.0 (–1.7, 5.6) 43.2 (40.4, 45.9) 37.1 (34.1, 40.0) 17.8 (14.5, 21.19
Hungary 1.8 (–3.0, 6.7) 36.6 (32.7, 40.5) 43.7 (40.0, 47.3) 17.9 (13.5, 22.4)
Ireland 2.0 (–2.2, 6.3) 47.1 (44.0, 50.3) 38.4 (35.1, 41.8) 12.4 (8.4, 16.4)
Lithuania 1.4 (–3.0, 5.7) 39.1 (35.7, 42.5) 41.7 (38.4, 45.1) 17.8 (13.8, 21.8)
Netherlands 1.8 (–2.7, 6.3) 48.2 (44.9, 51.4) 36.0 (32.4, 39.7) 14.0 (9.8, 18.3)
Norway 1.3 (–4.1, 6.7) 47.2 (43.3, 51.1) 39.4 (35.2, 43.6) 12.1 (7.0, 17.2)
Poland 2.7 (–2.3, 7.7) 43.7 (39.9, 47.5) 35.3 (31.2, 39.3) 18.3 (13.8, 22.9)
Portugal 2.2 (–3.4, 7.8) 40.7 (36.3, 45.0) 39.4 (35.0, 43.8) 17.8 (12.6, 22.9)
Slovenia 1.6 (–4.2, 7.3) 39.5 (35.0, 44.0) 38.1 (33.5, 42.7) 20.8 (15.6, 26.0)
Spain 1.9 (–2.7, 6.5) 44.3 (40.8, 47.7) 36.8 (33.1, 40.5) 17.1 (12.8, 21.3)
Sweden 1.5 (–3.3, 6.2) 48.5 (45.1, 51.9) 35.8 (32.0, 39.6) 14.2 (9.8, 18.6)
Switzerland 2.7 (–2.4, 7.9) 54.0 (50.4, 57.5) 32.4 (28.1, 36.6) 10.9 (6.0, 15.8)
United Kingdom 2.8 (–1.4, 7.0) 42.3 (39.0, 45.6) 35.7 (32.3, 39.2) 19.2 (15.3, 23.0)
Acknowledgements
We also thank Bruce Jones for revising the document.
Conflicts of interest: None declared.
Key points
More than half of the European population is overweight and obese (the proportion of underweight was only 2%, and 44.9% for normal weight, overweight and obese accounted for 53.1%).
The overall prevalence was higher in Eastern European countries when compared with central and northern countries.
The prevalence of overweight and obesity was related with socioeconomic characteristics, which indicated that there might be a relationship with social iniquities.
Older population, low-income households should receive attention for overweight and obesity prevention in Europe. It is important to develop effective healthy lifestyles programs enhancing health literacy about these conditions.
References
1 Marques A, Matos MG. Trends in prevalence of overweight and obesity: are Portuguese adolescents still increasing weight?Int J Public Health2016;61:49–56. 2 Olds T, Maher C, Shi ZM, et al. Evidence that the prevalence of childhood
overweight is plateauing: data from nine countries.Int J Pediatr Obes2011;6:342–60. 3 Rokholm B, Baker JL, Sorensen TI. The levelling off of the obesity epidemic since the
year 1999–a review of evidence and perspectives.Obes Rev2010;11:835–46. 4 Sundquist J, Johansson SE, Sundquist K. Levelling off of prevalence of obesity in the
adult population of Sweden between 2000/01 and 2004/05.BMC Public Health
2010;10:119.
5 Finucane MM, Stevens GA, Cowan MJ, et al. National, regional, and global trends in body-mass index since 1980: systematic analysis of health examination surveys and epidemiological studies with 960 country-years and 9.1 million participants.Lancet
2011;377:557–67.
6 Ogden CL, Carroll MD, Kit BK, et al. Prevalence of childhood and adult obesity in the United States, 2011-2012.JAMA2014;311:806–14.
7 Ng M, Fleming T, Robinson M, et al. Global, regional, and national prevalence of overweight and obesity in children and adults during 1980-2013: a systematic analysis for the Global Burden of Disease Study 2013.Lancet2014;384:766–81. 8 Guh DP, Zhang W, Bansback N, et al. The incidence of co-morbidities related to
obesity and overweight: a systematic review and meta-analysis.BMC Public Health
2009;9:88.
9 Dixon JB. The effect of obesity on health outcomes.Mol Cell Endocrinol
2010;316:104–8.
10 Dee A, Kearns K, O’Neill C, et al. The direct and indirect costs of both overweight and obesity: a systematic review.BMC Res Notes2014;7:242.
11 WHO.The Challenge of the Obesity in the WHO European Region and the Strategies for Response. Copenhagen: World Health Organization, 2007.
12 WHO.Prevention and Control of Noncommunicable Diseases in the European Region: A Progress Report. Copenhagen: World Health Organization, 2014.
13 CDC. Recommended community strategies and measurements to prevent obesity in the United States.MMWR2009;58:1–26.
14 Gallus S, Lugo A, Murisic B, et al. Overweight and obesity in 16 European countries.
Eur J Nutr2015;54:679–89.
15 Peytremann-Bridevaux I, Faeh D, Santos-Eggimann B. Prevalence of overweight and obesity in rural and urban settings of 10 European countries.Prev Med2007;44:442–6. 16 OECD. Overweight and Obesity Among Adults.Health at a Glance: Europe 2016:
State of Health in the EU Cycle. Paris: OECD Publishing, 2016.
17 Berghofer A, Pischon T, Reinhold T, et al. Obesity prevalence from a European perspective: a systematic review.BMC Public Health2008;8:200.
18 NCD-RisC. Trends in adult body-mass index in 200 countries from 1975 to 2014: a pooled analysis of 1698 population-based measurement studies with 192 million participants.The Lancet2016;387:1377–96.
19 Schnaudt C, Weinhardt M, Fitzgerald R, Liebig S. The European Social Survey: contents, design, and research potential.Schmollers Jahrbuch2014;134:487–506. 20 WHO. Obesity: Preventing and Managing the Global Epidemic.Report of a WHO
consultation. Geneva: World Health Organization, 2000.
21 UNESCO.International Standard Classification of Education ISCED 2011. Montreal: United Nations Educational, Scientific and Cultural Organization, 2012. 22 Stepaniak U, Micek A, Waskiewicz A, et al. Prevalence of general and abdominal
obesity and overweight among adults in Poland. Results of the WOBASZ II study (2013-2014) and comparison with the WOBASZ study (2003-2005).Pol Arch Med Wewn2016;126:662–71.
23 Shin HY, Kang HT. Recent trends in the prevalence of underweight, overweight, and obesity in Korean adults: The Korean National Health and Nutrition Examination Survey from 1998 to 2014.J Epidemiol2017.
24 Marqueta de Salas M, Martin-Ramiro JJ, Juarez Soto JJ. Sociodemographic char-acteristics as risk factors for obesity and overweight in Spanish adult population.
Med Clin (Barc)2016;146:471–7.
25 Klumbiene J, Petkeviciene J, Helasoja V, et al. Sociodemographic and health behaviour factors associated with obesity in adult populations in Estonia, Finland and Lithuania.Eur J Public Health2004;14:390–4.
26 Xu W, Zhang H, Paillard-Borg S, et al. Prevalence of overweight and obesity among chinese adults: role of adiposity indicators and age.Obesity Facts2016;9:17–28. 27 Pigeyre M, Rousseaux J, Trouiller P, et al. How obesity relates to socio-economic status:
identification of eating behavior mediators.Int J Obes (Lond)2016;40:1794–801. 28 Fillol F, Dubuisson C, Lafay L, et al. Accounting for the multidimensional nature of
the relationship between adult obesity and socio-economic status: the French second National Individual Survey on Food Consumption (INCA 2) dietary survey (2006-07).Br J Nutr2011;106:1602–8.
29 Manios Y, Panagiotakos DB, Pitsavos C, et al. Implication of socio-economic status on the prevalence of overweight and obesity in Greek adults: the ATTICA study.
Health Policy2005;74:224–32.
30 Saito Y, Oguma Y, Inoue S, et al. Environmental and individual correlates of various types of physical activity among community-dwelling middle-aged and elderly Japanese.Int J Environ Res Public Health2013;10:2028–42.
31 Mesters I, Wahl S, Van Keulen HM. Socio-demographic, medical and social-cognitive correlates of physical activity behavior among older adults (45-70 years): a cross-sectional study.BMC Public Health2014;14:647.
32 Sarlio-Lahteenkorva S, Silventoinen K, Lahti-Koski M, et al. Socio-economic status and abdominal obesity among Finnish adults from 1992 to 2002.Int J Obes (Lond)
2006;30:1653–60.
33 Cohen SA, Cook SK, Kelley L, et al. A closer look at rural-urban health disparities: associations between obesity and rurality vary by geospatial and sociodemographic factors.J Rural Health2017;33:167–79.
34 Blundell JE, Baker JL, Boyland E, et al. Variations in the prevalence of obesity among European countries, and a consideration of possible causes.Obes Facts2017;10:25–37. 35 Lee I, Shiroma EJ, Lobelo F, et al. Effect of physical inactivity on major non-com-municable diseases worldwide: an analysis of burden of disease and life expectancy.
Lancet2012;380:219–29.
36 Kohl HW, Craig CL, Lambert EV, et al. The pandemic of physical inactivity: global action for public health.Lancet2012;380:294–305.
37 Murtagh EM, Murphy MH, Murphy NM, et al. Prevalence and correlates of physical inactivity in community-dwelling older adults in Ireland.PloS One
2015;10:e0118293.
38 Connor Gorber S, Tremblay M, et al. A comparison of direct vs. self-report measures for assessing height, weight and body mass index: a systematic review.
Obes Rev2007;8:307–26.
39 Gupta S, Richard L, Forsythe A. The humanistic and economic burden associated with increasing body mass index in the EU5.Diabetes Metab Syndr Obes2015; 8:327–38.
40 Wilkinson ML, Brown AL, Poston WS, et al. Physician weight recommendations for overweight and obese firefighters, United States, 2011-2012.Prev Chronic Dis
2014;11:E116.