i
Rita de Sousa Gorgulho
Bachelor in Biology
Usefulness of zebrafish model to assess
glomerular and tubular alterations induced
by tenofovir
Dissertação para obtenção do Grau de Mestre em Genética Molecular e Biomedicina
Orientadora: Judit Morello, Professora Auxiliar, NOVA Medical
School, UNL
Co-orientadora: Sofia A. Pereira, Professora Auxiliar, NOVA Medical
School, UNL
Júri:
Presidente: Doutora Margarida Casal Ribeiro Castro Caldas Braga
Vogais: Doutora Judit Morello Bullón
Doutor Miguel Alberto Fernandes Machado e Santos
ii
iii
Usefulness of zebrafish model to assess glomerular and tubular alterations induced by tenofovir
Copyright © Rita de Sousa Gorgulho, Faculdade de Ciências e Tecnologia, Universidade Nova de Lisboa
v
The current work was funded by:
vii
The results discussed in this thesis originated:
Publications in international scientific journals:
Gorgulho, R. S., Lopes, S., Correia, A. C., Tranfield, E. M., Monteiro, E. C., Pereira, S. A., Morello, J. 2015. Usefulness of zebrafish model to assess glomerular and tubular alterations induced by nephrotoxic drugs. Toxic Letters. Volume 238 (2S). ISSN 0378-4274.
Posters in international meetings:
Gorgulho, R. S., Lopes, S., Correia, A. C., Tranfield, E. M., Monteiro, E. C., Pereira, S. A., Morello, J. Usefulness of zebrafish model to assess glomerular and tubular alterations induced by nephrotoxic drugs. Poster for the 51st Congress of the European Societies of Toxicology (Eurotox). Porto, Portugal. 2015.
Oral communications in national meetings:
Gorgulho, R. S., Lopes, S., E. M., Monteiro, E. C., Pereira, S. A., Morello, J. Monitoring glomerular function in zebrafish larvae (Danio rerio) exposed to nephrotoxic drugs. XLV SPF (Sociedade Protuguesa de
Farmacologia) Meeting. NOVA Medical School. Lisbon, Portugal. 5 – 6 February 2015.
Gorgulho, R. S., Pereira, S. A., Morello, J. Evaluation of Tenofovir-induced mitochondrial toxicity in the zebrafish model. Jornadas Intercalares das Dissertações Anuais dos Mestrados. Faculdade de Ciências e Tecnologia – Universidade Nova de Lisboa. Lisboa, Portugal. 2015.
Awards:
ix
In memory of Ruca,
xi
Acknowledgements
A realização desta tese teria sido impossível sem a ajuda de inúmeras pessoas. Por isso irei aproveitar este espaço para reconhecer a preciosa ajuda que me prestaram.
Em primeiro lugar quero agradecer à minha orientadora, a Judit Morello, não só pela oportunidade que me deu para a realização deste trabalho (que adorei!) mas principalmente pela incansável ajuda que me prestou ao longo do ano e por tudo o que me ensinou. Também gostaria de agradecer à minha co-orientadora, Sofia Azeredo Pereira, por toda a ajuda que me deu e também pela preciosa oportunidade.
Também quero agradecer ao grupo do laboratório que me acolheu no IGC. Nunca tinha trabalhado num ambiente tão acolhedor e dinâmico. Ajudaram-me sempre no que precisei e sem dúvida que me ensinaram imensas coisas novas. Por isso, deixo o meu especial agradecimento à Susana Lopes, à Bárbara e à Raquel (adorei as nossas conversas sobre os livros!), à Mónica, à Petra, ao Pedro, à Diana e à Hanna.
Também não podia deixar de agradecer à Catarina e à Erin, do departamento de microscopia eletrónica, por toda a ajuda com o TEM e por me terem ensinado tanto.
Agradeço também ao grupo do laboratório de farmacologia, que, apesar de a minha estadia ter sido curta nesse lado, acolheu-me de braços abertos. Deixo um especial agradecimento à Clara por toda a ajuda na submissão do poster e pela excelente companhia no Porto.
Claro que também não podia deixar de agradecer à minha família e amigos. Obrigada pelo incansável suporte e carinho. Agradeço especialmente à minha mãe, por me ir lembrando de comer qualquer coisa, e ao meu pai que literalmente contribuiu na escrita desta tese. E suponho que também tenho de agradecer à minha irmã por…bem…eu hei de me lembrar de qualquer coisa (edit: por ter me ter dado a conhecer
LoL e animes, e por ser a minha fonte de informação de eventos e coisas interessantes da internet –
quando se lembra de mos contar).
Por último, agradeço ainda aos meus gatos (2ª vez que me fazem companhia à noite na escrita de um trabalho!) e à minha cadela por ser tão querida.
E deixo ainda o meu mais profundo e sincero agradecimento ao Ruca, o cão mais meigo que conheci, pelos 13 anos que passaste connosco. Infelizmente já não estás aqui para te poder agradecer pessoalmente, mas sabes que nunca te vamos esquecer.
xiii
Abstract
Tenofovir (TFV) is one of the most used antiretroviral drugs. However, it is associated with tubular damage with mitochondria as a possible target. Tubulopathy precedes glomerular dysfunction, thus classic markers of renal function like the glomerular filtration rate (GFR) do not detect early TFV damage. Prediction and management of drug induced renal injury (DIRI) rely on the mechanisms of the
drug insult and in optimal animal models to explore it. Zebrafish (Danio rerio) offers unique advantages
for assessing DIRI, since the pronephros is structurally very similar to its human counterpart and is fully developed at 3.5 days postfertilization.
The main aim of the present work was to evaluate the effects of TFV, as well as its pro-drug, tenofovir disoproxil fumarate (TDF), on the GFR and in mitochondria morphology in tubular cells of zebrafish larvae.
Lethality curves were performed to understand the relationship between drug concentration and
lethality. LC10 was selected to explore the renal function using the FITC-inulin assay and to analyze the
mitochondrial toxicity by electron microscopy on larvae exposed to TDF, TFV, paracetamol and gentamicin (positive controls) or water (negative control).
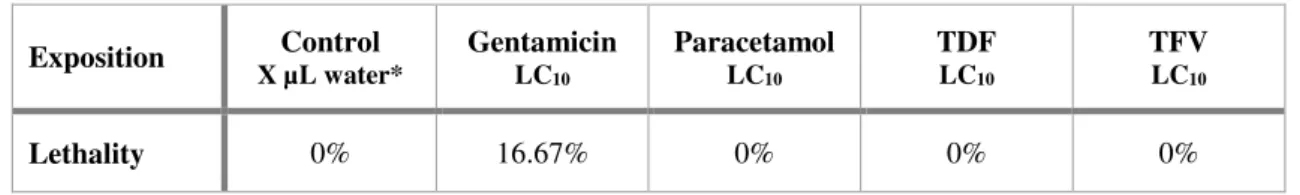
Lethality curves showed that gentamicin was the most lethal drug, followed by TDF, TFV and paracetamol. Gentamicin and paracetamol decreased the GFR, but no differences were found for either TDF or TFV, when compared to controls (%FITC Control = 33±8; %FITC TDF = 35±10; %FITC TFV = 30±10; %FITC Gentamicin = 46±17; %FITC Paracetamol = 83±14). Tubular mitochondria from treated larvae were notably different from non-treated larvae, showing swelling, irregular shapes, decreased mitochondria network, cristae disruption and loss of matrix granules.
These results are in agreement with the effects of these drugs in humans and thus, demonstrate that zebrafish larvae can be a good model to assess the functional and structural damage associated with DIRI.
Keywords
xv
Resumo
Tenofovir (TFV) é um dos fármacos antirretrovirais mais utilizados. No entanto, está associado a danos tubulares, sendo a mitocôndria um dos possíveis alvos. Tubulopatia precede a disfunção glomerular, o que indica que marcadores clássicos da função renal, como a taxa de filtração glomerular (TFG) não conseguem detetar danos prematuros induzidos por TFV. Previsão e gestão de danos renais induzidos por fármacos (DRIF) dependem dos mecanismos da toxicidade causada pelo fármaco e em animais
modelos para o explorarem. O peixe-zebra (Danio rerio) oferece vantagens únicas no estudo de DRIF,
uma vez que o prónefro é estruturalmente muito semelhante ao seu homólogo humano e encontra-se completamente desenvolvido aos 3.5 dias pós-fertilização.
O objetivo principal desta tese é avaliar os efeitos do TFV, bem como do pró-fármaco tenofovir disoproxil fumarato (TDF), na TGF e na morfologia das mitocôndrias de células tubulares de larvas de peixe-zebra.
Foram calculadas curvas de letalidade com o objetivo de encontrar a relação entre as concentrações do
fármaco e a letalidade causada. LC10 foi escolhida para analisar a função renal, através do ensaio com
FITC-inulina, e para analisar toxicidade mitocondrial, por microscopia eletrónica, em larvas expostas a TDF, TFV, paracetamol e gentamicina (controlos positivos) ou água (controlo negativo).
As curvas de letalidade mostraram que a gentamicina foi o fármaco mais potente, seguido pelo TDF, TFV e paracetamol. A gentamicina e o paracetamol diminuíram a TFG, no entanto não foram observadas diferenças entre TDF e TFV, quando comparados com o controlo (%FITC Controlo = 33±8; %FITC TDF = 35±10; %FITC TFV = 30±10; %FITC Gentamicina = 46±17; %FITC Paracetamol = 83±14). Mitocôndrias tubulares de larvas tratadas eram bastante diferentes de larvas não-tratadas, apresentando inchaço, formas irregulares, diminuta rede mitocondrial, disrupção das cristas e perda de grânulos da matriz.
Estes resultados estão de acordo com os efeitos observados em humanos, o que demonstra que as larvas do peixe-zebra podem ser um bom modelo para analisar danos funcionais e estruturais associados a DRIF.
Palavras-chave
xvii
Contents
Acknowledgements ... xi
Abstract ... xiii
Resumo ... xv
Acronyms ... xix
List of figures ... xxii
List of tables ... xxv
Introduction ... 1
1. HIV/AIDS ... 1
a. Brief history of HIV/AIDS – How the epidemic started ... 1
b. HIV infection ... 3
c. Treating HIV/AIDS ... 6
d. ART associated toxicity ... 10
e. Tenofovir ... 11
2. Zebrafish (Danio rerio) ... 15
a. Ecology ... 15
b. Zebrafish (Danio rerio) as a powerful vertebrate model ... 17
Aims ... 21
Materials and methods... 23
1. Zebrafish lines used ... 23
2. Zebrafish breeding and maintenance ... 24
3. Drug stocks ... 24
4. Larvae drug exposition by soaking... 25
5. Lethality curves ... 25
6. FITC-inulin clearance assay ... 26
7. Transmission Electron Microscopy (TEM) ... 28
8. Statistical Analysis ... 30
Results ... 31
1. Lethality curves ... 31
2. Renal Function ... 34
3. Transmission Electron Microscopy ... 36
a. 2D micrographs ... 36
b. 3D models of serial sequences ... 42
xviii
Discussion ... 49
1. Lethality curves ... 50
2. Renal Function ... 51
Conclusions and future perspectives ... 59
References ... 61
Annexes ... 71
I. Recipes ... 71
II. Microwave procedure ... 72
III. Lethalities ... 73
IV. Other techniques performed ... 74
a. Fluorescence Activated Cell Sorting (FACS) ... 74
b. DNA extraction ... 74
c. qPCR ... 74
xix
Acronyms
AIDS Acquired Immunodeficiency Syndrome
AKI Acute Kidney Injury
ART Antiretroviral Therapy
ARV Antiretroviral
AZT Azidothymidine
CCV Common Cardinal Vein
CDC Centers for Disease Control
cdh17 cadherin-17
CKD Chronic Kidney Disease
DIRI Drug Induced Renal Injury
dpf Days post fertilization
DRIF Danos Renais Induzidos por Fármacos
EM Embryo media
FACS Fluorescence-Activated Cell Sorting
FDA U.S. Food and Drug Administration
FITC Fluorescein Isothiocyanate
GFR Glomerular Filtration Rate
HAART Highly Active Antiretroviral Therapy
HIV Human Immunodeficiency Virus
HIVAN HIV-Associated Nephrotoxicity
HIVICK HIV Immune-Complex Kidney Disease
xx
IGC Gulbenkian Institute of Science
INSTI Integrase Strand Transfer Inhibitor
LC10 Lethal Concentration for 10% of the population
LC50 Lethal Concentration for 50% of the population
MDGs UN Millennium Development Goals
mtDNA Mitochondrial DNA
NNRTI Non-Nucleoside Reverse-Transcriptase Inhibitor
NRTIs Nucleoside Reverse-Transcriptase Inhibitors
OAT Organic Anion Transporters
OIs Opportunistic Infections
PCNA Proliferating Cell Nuclear Antigen
PCP Pneumocystis jiroveci pneumonia
PIs Proteinase Inibitors
RNS Reactive Nitrogen Species
ROS Reactive Oxygen Species
TD Tenofovir Diphosphate
TDF Tenofovir Disoproxil Fumarate
TEM Transmission Electron Microscopy
TFV Tenofovir Monophosphate
TUNEL Terminal deoxynucleotidyl transferase dUTP nick end labeling
UN United Nations
UNAIDS Joint United Nations Program on HIV/AIDS
UNGASS United General Assembly Special Session on HIV/AIDS
xxi
xxiii
List of figures
Figure 1 – Illustrations of a 3D representation of a HIV-1 virion. ... 4
Figure 2 –HIV replication cycle. ... 5
Figure 3 – Timeline of the appearance of new ARVs, as they were being approved by the FDA. . 7
Figure 4 – Last statistics regarding HIV infection and ART impact on it. ... 9
Figure 5 - Conversion of TDF to TFV. ... 12
Figure 6 – Mechanism of TFV tubular secretion a tubular cell. ... 13
Figure 7 - The natural distribution of the zebrafish.. ... 16
Figure 8 – Male and female adult zebrafish.. ... 17
Figure 9 – Zebrafish pronephros. ... 19
Figure 10 –5 dpf nacre wt1b::GFP; cdh17::GFP larvae.. ... 24
Figure 11 –Place of injection in larvae. ... 27
Figure 12 – FITC-intensity 2h after FITC-inulin injection. ... 28
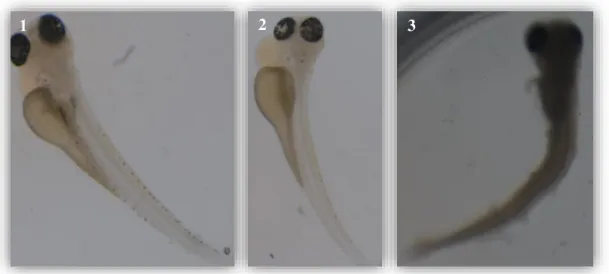
Figure 13– Zebrafish larvae after 24h of TDF-exposition. ... 31
Figure 14 – Lethality curves for gentamicin, paracetamol, TFV and TDF. ... 32
Figure 15 – Percentage (%) of FITC-intensity 2h after FITC-inulin injection. ... 35
Figure 16 – 2D micrographs of convoluted tubules from zebrafish larvae.. ... 39
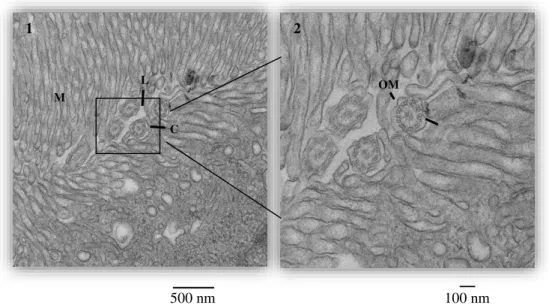
Figure 17 – Transversal section of cilia present in the lumen of the convoluted tubules of a zebrafish larvae after TFV exposition. ... 39
Figure 18 – Transversal sections of the convoluted tubules after water or drug exposition
showing several cell structures.. ... 41
Figure 19 – Snaps of the serial sequences 3D cell models. ... 42
Figure 20 – Damaged mitochondria. ... 43
Figure 21 – Volumes of the organelles obtained with the 3D cells models.. ... 44
Figure 22 – Scheme of how serial sequences and tomograms were performed.. ... 45
Figure 23 – Snaps of the 3D tomograms models. ... 46
xxv
List of tables
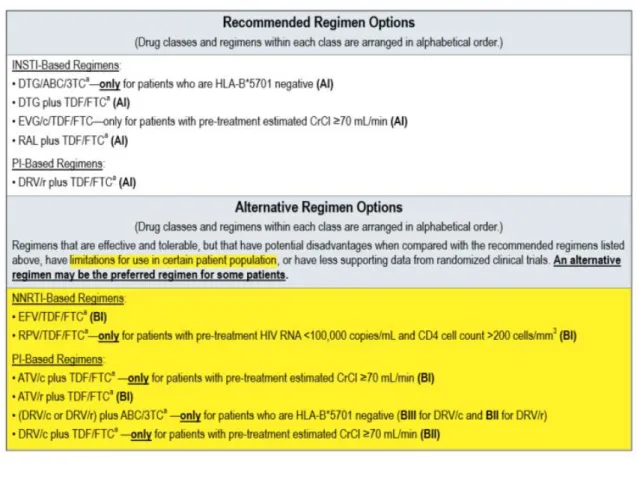
Table 1 – Recommended, Alternative, and Other Antiretroviral Regimen Options for
Treatment-Naïve Patients. ... 8
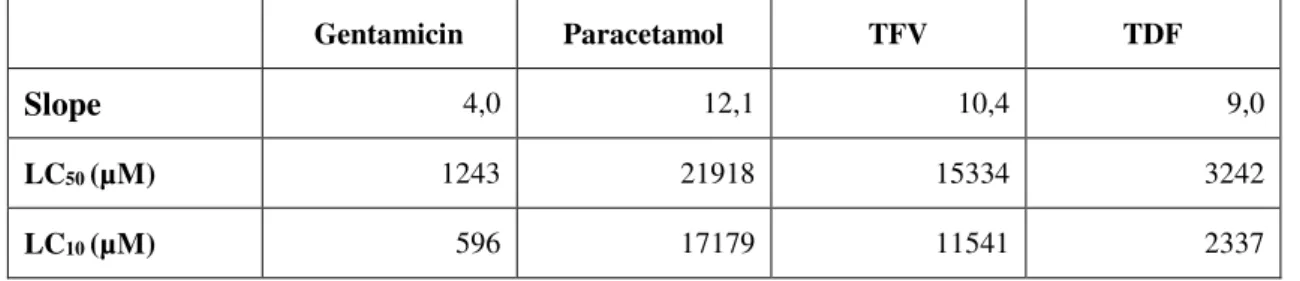
Table 2 – Slope, LC50 and LC10 of each drug. ... 33
Table 3 – Lethalities of the zebrafish larvae used for the FITC-inulin clearance assay. ... 34
Table 4 – Lethalities of the zebrafish larvae after FITC-inulin injection. ... 34
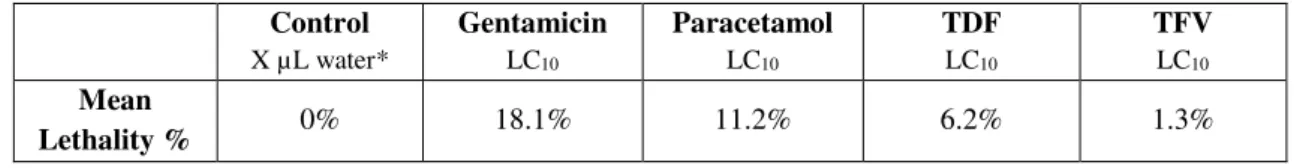
Table 5 – Larvae lethalities percentage for the TEM experiments. ... 36
1
Introduction
1.
HIV/AIDS
a.
Brief history of HIV/AIDS
–
How the epidemic started
It is believed that HIV (Human Immunodeficiency Virus), the virus responsible of AIDS (Acquired Immunodeficiency Syndrome), was probably transferred to humans from primates in Africa between 1884 and 1924. There are several theories regarding it, one of them being that the virus was transmitted either from blood contact, by wounds of hunters that entered in contact with infected primate blood, or via sexual contact. But the epidemic probably started its spread due to vaccination of thousands of people with same needle, in the area where HIV transmission happened (http://www.avert.org/).
Up until 1981, there were no reports associated to AIDS, as the disease was yet unknown and disguised as opportunistic infections (OIs) that were acquired by a deficiency of the immune system
(http://www.avert.org/). Several earlier cases were later linked to it, thought. As Jonathan Mann apud
http://www.avert.org/ said, "The dominant feature of this first period was silence, for the human
immunodeficiency virus was unknown and transmission was not accompanied by signs or symptoms
salient enough to be noticed.”. During this period of silence, approximately 100,000-300,000 persons
were estimated to have been infected unknowingly and unwarily (http://www.avert.org/).
It was only in June 1981 that the world first became aware of a rising epidemic (http://www.avert.org/; WHO, 1997; Mann, 1997), with the CDC (Centers for Disease Control) report about the occurrence,
without identifiable cause, of PCP (formal Pneumocystis carinii pneumonia, now Pneumocystis jiroveci
pneumonia) in five previously healthy gay men in Los Angeles (Schamatz et al., 1990; Wakefield et al.,
1992). Several other similar reports of PCP cases and other opportunistic infections among gay men, as
well as of a rare and unusually aggressive cancer – the Kaposi’s sarcoma –also reached the CDC. By
the end of the year, there was a total of 270 reported cases of severe immune deficiency among gay men, and 121 of those individuals had already died. It was a period of general confusion and divergent conclusions about what this new disease was, how it was transmitted, and whom did it affect (http://www.avert.org; https://www.aids.gov).
The name AIDS was officially given by the CDC in 1982, as up until then organizations were referring
to it in different ways: by reference to the diseases that were occurring (e.g. lymphadenopathy – swollen
2 within the immune system and because it was a syndrome, with a number of manifestations, rather than a single disease (http://www.avert.org).
AIDS took a turning point in people awareness when the first reports in children (by mother-child transmission) and in blood-transfusion recipients appeared. Up until then, non-gay people and non-drug
injectors felt unthreatened by it. As Harold Jaffe apud http://www.avert.org stated, in the CDC for
Newsweek Magazine, “Up until then it was entirely a gay epidemic, and it was easy for the average
person to say 'So what?' Now everyone could relate."
In 1983, doctors at the Institute Pasteur in France reported that they had isolated the Lymphadenopathy-Associated Virus (LAV), which they suggested might be the cause of AIDS, but little notice was given
to it (Barré-Sinoussi et al., 2013). A year later, Dr. Robert Gallo, of the National Cancer Institute,
announced that he had also isolated the virus which caused AIDS, and named it HTLV-III. Later it became clear that they were the same virus. To end the general discussion on its name, the International
Committee on the Taxonomy of Viruses attributed a new name – HIV (http://www.avert.org/).
In April 1985, the first international conference on AIDS was held in Atlanta. Immediately after, the World Health Organization (WHO) organized an international meeting to consider the AIDS epidemic and to initiate intensive worldwide action. The WHO’s Global program on AIDS was then created in 1986-1987 (Kaiser Family Foundation, 2015; WHO, 1997) in order to prevent infection of HIV, to reduce its personal and social impact and to mobilize national and international efforts to combat AIDS (WHO, 1997, Mann, 1997). By then, approximately 75,000 cases had been reported to WHO (WHO, 1997).
Meantime, a second parallel "epidemic of fear" and prejudice was rising within many countries, with the increasing numbers of infected and dying people and the lack and/or misinformed knowledge from the epidemic. Many campaigns against discrimination and promoting AIDS awareness arose, and the AIDS-related organizations raised efforts to educate people (http://www.avert.org/).
As the virus had yet to be stopped, in 1996, UNAIDS (Joint United Nations Program on HIV/AIDS) was formed to serve as the UN (United Nations) system’s coordinating body and to help galvanize worldwide attention to AIDS (Kaiser Family Foundation, 2015).
In 2000, all nations agreed to 10 goals to be met until 2015 regarding several of the most serious diseases
worldwide – the UN Millennium Development Goals (MDGs). The 6th goal regarded several HIV/AIDS
targets. In the UNAIDS 2015 report it was stated that they all have been met (Kaiser Family Foundation, 2015; UNAIDS, 2015).
3 commitments and appealed for an intensification of efforts to combat the epidemic through a total of 10 targets to be met by 2015 (Kaiser Family Foundation, 2015; United Nations, 2011).
In World AIDS Day 2014, UNAIDS set targets for 2020 aimed at ending the epidemic by 2030 (Kaiser Family Foundation, 2015; UNAIDS, 2014).
By the end of 2014, there were approximately 36.9 million people living with HIV. In that same year, there were 2.0 million new HIV infections and 1.2 million AIDS-related deaths globally (UNAIDS, 2015; WHO, 2015).
b.
HIV infection
The HIV is a lentivirus1 belonging to the family Retroviridae2 that causes HIV infection, which might
evolve into AIDS in later stages of the infection. Two HIV strains have been identified: HIV-1 (more
virulent; major responsible of AIDS) and HIV-2 (less common) (Goede et al., 2014).
Each HIV particle (Fig. 1) is composed of three major elements: i) an outer coat composed of a lipid bi-layered envelope that comprises viral glycoproteins, ii) an associated matrix surrounding the capsid that ensures the integrity of the virus particle, and iii) an inner core enclosing two identical copies of a single-stranded RNA genome (9600 nucleotides), polymerase and additional viral proteins, packaged by the
nucleocapsid (Goede et al., 2014). HIV encodes for nine protein classes: three structural proteins, two
regulatory proteins (Tat and Rev) and four accessory proteins (Vif, Vpu, Nef and Vpr). The structural protein classes consist of Gag (capsid proteins), Pol (viral enzymes protease, reverse transcriptase and
integrase) and Env (envelop proteins) (Goede et al., 2014; Peçanha et al., 2002).
1 Long incubation periods, infect non-dividing cells.
2 Enveloped viruses that replicate in the host cell via the enzyme reverse transcriptase to produce DNA from its
4
Figure 1 – Illustrations of a 3D representation of a HIV-1 virion. Viral proteins in red/orange, host proteins in
black/grey. Illustration adapted from https:// www.visualscience.ru.
HIV infection is characterized by CD4 T lymphocytes cell (T cells) depletion, CD8 T cell expansion
and chronic immune activation that leads to immune dysfunction (Catalfamo et al., 2011). HIV mainly
targets CD4 T cells, macrophages, monocytes and dendritic cells, as HIV entry depends on the presence
of certain surface receptors (majorly CD4) and co-receptors (Goede et al., 2014).
HIV can be transmitted through sexual contact, blood transfusion, organ transplant, parenteral drug use, mother to child (either during pregnancy, childbirth or breast feeding) or by any other type of fluids (semen, pre-seminal fluid, rectal and/or vaginal fluids, blood, breast milk) exchange (https://www.aids.gov).
When HIV enters the body, it first attaches to the dendritic cells, found in the mucosal membranes. The dendritic cells then transport the virus from the site of infection into the lymph nodes, where HIV can then infect other immune system cells (https://www.aids.gov).
The HIV replication cycle (Fig. 2) starts with the virus binding to the CD4 receptor and co-receptors of the host-cell, which results in cell and viral membranes fusion. The virion is then uncoated and its
contents – RNA and proteins – are released into the cytoplasm. The HIV RNA is reverse transcribed
into cDNA by the viral enzyme reverse transcriptase and the pre-integration complex assembles and goes to the nucleus. Once there, the viral cDNA is integrated into the host DNA, by the viral enzyme integrase, and subsequently transcribed and translated to form new viral RNA and viral proteins. These translocate to the cell surface to assemble into new immature virus forms that bud off and get released. Afterwards, the new viruses suffer maturation, where the viral protease enzyme cleaves structural proteins present in the envelop, and they finally convert into mature viruses fully capable of infecting
5
Figure 2 –HIV replication cycle. The main steps of the replication cycle are shown: binding to the CD4-receptor
and co-receptors; fusion with the host-cell membrane; uncoating of the viral capsid; release of the viral genome and proteins into the cytoplasm; reverse transcription of the RNA into DNA; formation of the pre-integration complex; translocation into the nucleus. The viral DNA is then integrated into the host DNA and is transcribed inside the nucleus. After export, RNA is translated to form new viral RNA and viral proteins that assemble at the host-cell membrane. New immature viruses bud from the host-cell and are released after which they mature, resulting in the production of new infectious virions. Illustration adapted from Goede et al. (2014).
As the number of CD4 cells depletes, resulting in a dysfunctional immune system, the risk of contracting OIs and certain cancers increases gigantically. When patients get a very low number of CD4 T cells
(below 200 cells/mm3), have one or more of the 20 OIs listed by WHO and/or have certain cancers, they
6
c.
Treating HIV/AIDS
Despite all the efforts and mutual aid between nations, a vaccine and/or cure for HIV/AIDS as yet to be
found (Walker and Burton, 2008; Richman et al., 2009). There are, though, several studies being made
towards it (rgp120 HIV Vaccine Study Group, 2005; Walker and Burton, 2008) and enormous progresses have been made in order to slow the spread of HIV, prevent new infections and to improve the quality of life and life expectancy of people living with AIDS, and those are not to be discarded
(Richman et al., 2009). The discovery and following implementation of Antiretroviral Therapy3 (ART)
made it possible.
The first antiretroviral (ARV) drug that showed signs of slowing down the attack of HIV, the Azidothymidine (AZT), appeared in September 1986. After a quick clinical trial, as it was considered unethical to provide placebo to the patients and deny them the medicine, the U.S. Food and Drug Administration (FDA) approved AZT and it started to be commonly given to AIDS patients (http://www.avert.org).
In 1992, the FDA approved the use of the first successful antiretroviral combination therapy for the treatment of AIDS – dideoxycytidine plus AZT – for adult patients with advanced HIV infection who were continuing to show signs of clinical or immunological deterioration (http://www.avert.org).
In 1995, FDA approved the first protease inhibitor, the drug saquinavir. This new class of drugs proved to be very potent, such as that this announcement was considered one of the best news for people living with AIDS (http://www.avert.org).
By 1997, it was common for the therapy against HIV infection to be held by at least 3 ARVs. This combination therapy was referred as Highly Active Antiretroviral Therapy (HAART) or simply by ART (Berns and Kasbekar, 2006; Kalyesubula and Perazella, 2011; WHO, 2013; http://www.avert.org).
The figure 3 displays the timeline of the introduction of ARVs.
3Therapy held by a combination of 3 or more ARVs (WHO, 2013); it might also be referred as HAART (Berns
7
Figure 3 – Timeline of the appearance of new ARVs, as they were being approved by the FDA.
Now, more than 20 ARVs are available and they can be combined in several different ways (Berns and Kasbekar, 2006). Each drug can block one of the steps of the HIV viral cycle. They are distributed in five different classes, according to the step of the viral cycle they target ant their mechanism of action (Arts and Hazuda, 2012; https://aidsinfo.nih.gov):
Nucleoside Reverse-Transcriptase Inhibitors (NRTIs) are nucleoside or nucleotide analogues
(e.g. Tenofovir) administered in the form of pro-drugs, requiring triple or double
phosphorylation by cellular kinases before enacting an antiviral effect. When incorporated into the new forming cDNA chain, they prevent the incorporation of new nucleosides and thus terminate with the synthesis of the viral DNA;
Non-Nucleoside Reverse-Transcriptase Inhibitors (NNRTI) are non-competitive inhibitors that
bind allosterically to the reverse transcriptase, preventing HIV replication;
Protease Inibitors (PIs), as the name indicates, block protease, preventing HIV viral polyprotein
processing and thus maturation of new (immature) HIV;
Integrase Strand Transfer Inhibitor (INSTI) block integrase, preventing proviral cDNA from
integrating into the cell genome;
Entry inhibitors:
o Fusion Inhibitors block the HIV envelope fusion with the host CD4 cell membrane,
8
o CCR5 Antagonists block the CCR5 co-receptor on the surface of CD4 cells, preventing
HIV from entering the cell.
ART act by gradually restoring pathogen-specific immune responses, mediated by a suppression of HIV replication and an increase in the CD4 cell count. However, many patients in resource-poor settings start
ART at late stages of the disease, thus decreasing the benefic effects of the treatment (Muller et al.,
2010). Other barriers, such as a poor adherence and non-persistency of the therapy, insufficient clinical
surveillance and viral resistance may also explain the sometimes inefficient therapy treatment (Bae et
al., 2011).
According to the most recent WHO 2013 Treatment Guidelines (WHO, 2013), HIV-infected people
should undergo ART treatment when CD4 cell count is lower than 500 cells/mm3. Current guidelines
(WHO, 2013; Panel on Antiretroviral Guidelines for Adults and Adolescents, 2015) recommend as first line ART a combination of 2 NRTIs plus 1II or 1 PI (Table 1).
9 Before ART, life expectancy was measured in months; now it is measured in decades. Besides, nowadays HIV viral load can be suppressed to undetectable levels (Berns and Kasbekar, 2006).
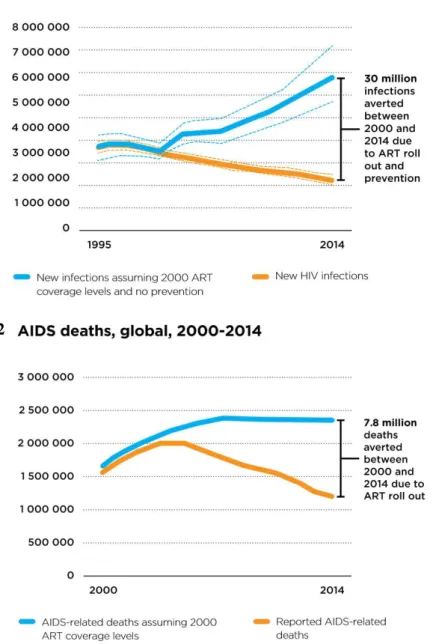
In 2000, less than 700,000 people were receiving antiretroviral drugs; by 2014, 15 million people had access to it. In just 15 years, the number of new HIV infections reduced from around 3.1 million to around 2.0 million, thanks to the ART (Fig. 4.1). Without it, 30 more million people would have been infected with HIV and 7.8 million more would have died (Fig. 4.2) (UNAIDS, 2015).
Figure 4 – Last statistics regarding HIV infection and ART impact on it. (1) New HIV infections, from 1995
till 2014. (2) AIDS related deaths, globally, from 2000 till 2014. Illustrations adapted from UNAIDS (2015).
1
10
d. ART associated toxicity
Even though the ART has prevented over 7.8 million deaths (Fig. 4.2) and has significantly increased the life-span of people living with AIDS from months to decades (UNAIDS, 2015), it has also been highly associated with mild to severe levels of toxicity. Because of the seriousness of the epidemic, the FDA has “rushed” the release of several new ARVs, with the approval of new regulations, in 1988, but many times without the proper long-term side effects studies been made on the new drugs (http://www.avert.org/).
By 1997 doctors were becoming increasingly aware of the unpleasant and sometimes serious side effects of these drugs and several “post-market” studies appeared later reporting serious side effects of some drugs (http://www.avert.org/).
Regarding ARVs associated nephrotoxicity, it is important to highlight that HIV by itself has always been associated with renal complications, as the virus can cause direct injury to the kidneys, a condition referred as HIV-associated nephrotoxicity (HIVAN) (Kalyesubula and Perazella, 2011). Other forms of HIV-related nephropathies include HIVICK (HIV Immune-Complex Kidney Disease), HIV thrombotic microangiopathy and kidney disease associated with opportunistic infections, such as cytomegalovirus, mycobacterium, cryptosporidium, and malignancies like lymphoma and Kaposi’s sarcoma (Gerntholtz
et al., 2006; Tambkus et al., 2006; Brady et al., 2010; Pollol et al., 1995). Also, Hepatitis B and C
infections, often related and present in HIV infected people, also contribute to several glomerular lesions
(Wyatt et al., 2008; Fischer et al., 2010; Szczech et al., 2004).
The kidney plays a major role in the metabolism and excretion of ARVs (Berns and Kasbekar, 2006; Kalyesubula and Perazella, 2011). For that reason, the kidney is a vulnerable target to many various types of injuries caused by ARVs, including acute kidney injury (AKI), tubulopathies, chronic kidney disease (CKD), and end-stage renal disease requiring renal replacement therapy (Kalyesubula and Perazella, 2011). HIV-infected people have a 3.87% increase risk of developing renal disease when
compared to non-infected (Islam et al., 2012)
For that reason, nowadays HIV continues to be greatly associated with nephrotoxicity, but now majorly because of ART, as some ARVs cause renal toxicity (Kalyesubula and Perazella, 2011). ART related nephrotoxicity accounted for 14% of late-AKI episodes, occurring 3 months after initiating ART (Roe
et al., 2008). CKD has also been associated with ART. In 3316 ART-naïve adults who were initiated
with ART, 2.7% developed severe kidney dysfunction (Reid et al., 2008).
11 an interesting study relating common age-related diseases with HIV infection, suggesting that HIV patients may suffer from accelerated or premature “aging”.
Therefore, the Infectious Disease Society of America apud Kalyesubula and Perazella (2011)
recommends that all patients at the time of HIV diagnosis have to be assessed for existing kidney disease with a screening urine analysis for proteinuria and an estimate of the glomerular function in order to individualize the therapy. The most accurate method to measure GFR (Glomerular Filtration Rate) involves the administration of a substance like inulin or radio-isotopes that the glomeruli will filter completely as waste, without reabsorption nor secretion by the tubules, and measuring its clearance over
time (Levey et al., 2002; Smith et al., 1951). Serum creatinine, albeit a classical method used to measure
GFR, is believed to be a poor marker of renal disease, especially in patients with muscle wasting (Berns and Kasbekar, 2006), since several antiretroviral drugs, such as tenofovir, cause nephrotoxicity without impairment of the glomeruli.
Some drugs, thought, seem to be more closely related to kidney disease events. Islam et al. (2012)
published a systematic review and meta-analysis of relative risk of renal disease among populations of people living with HIV. They reported an increased risk of renal disease of 0.54% among people
undergoing ART therapy versus ART-naïve and an increased risk of renal disease of 1.56% among
people receiving a tenofovir-based ART therapy versus non-tenofovir ART therapy.
e.
Tenofovir
Tenofovir is one of the most used ARVs for the treatment of HIV infection, due to its easy
administration, that enables for a high adherence, and high antiretroviral efficacy (Winiarczyk et al.,
2009; Abraham et al., 2013). Tenofovir, a NRTI, is now part of the majority of ART therapies, besides
being also a component of hepatitis B treatment (Fernandez-Fernandez et al., 2011).
Tenofovir bioavailability as tenofovir monophosphate (TFV) is relatively low, though, since it has a low
oral absorption due to its non-ionic state that results in a low permeability across membranes (Gelder et
al., 2001). Therefore, it is administered as tenofovir disoproxil fumarate (TDF), a bi-ester oral pro-drug
(Abraham et al., 2013).
TDF is orally administered and absorbed by the intestinal tract. After being absorbed, TDF is degraded to its (mono)ester-equivalent, by carboxylesterases, and further to TFV, probably by
12
Figure 5 – Conversion of TDF to TFV. First, TDF (A) is converted to the (mono)ester intermediate (B)
[enzymatically (mainly by carboxylesterases) or chemically] and further to TFV (C) (probably mediated by phosphodiesterases). Illustration adapted from Gelder et al. (2002).
TFV is then distributed across several tissues, majorly through the liver, kidney and intestines. TFV is eliminated unchanged through the kidneys, by glomerulus filtration and proximal tubules secretion
(Fernandez-Fernandez et al., 2011). 20-30% of the drug enters the proximal tubule cells by organic
anion transporters (OAT1 and OAT3) in the basolateral membrane, and is secreted into the urine by
apical membrane transporters (MRP4 and MRP2) (Fig. 6) (Moss et al., 2014; Fernandez-Fernandez et
al., 2011).
A
B
13
Figure 6 – Mechanism of TFV tubular secretion a tubular cell.Illustration adapted from Novoa et al. (2011).
TFV, after entering into the lymphocytes in order to exercise its antiretroviral activity, suffers two phosphorylations by cellular enzymes to give its antiretroviral-active form, tenofovir diphosphate (TD)
(King et al. 2006). TD is a structural analog of deoxyadenosine-5’-triphosphate, the natural substrate
for viral RNA-directed DNA polymerase, and is a weak inhibitor of mammalian DNA α- and
β-polymerases and mitochondrial DNA γ-polymerase (Fernandez-Fernandez et al., 2011).
When tenofovir first became available, early randomized clinical trials and post-marketing data
supported the safety of tenofovir, as in none was observed Fanconi syndrome4 nor drug discontinuation
because of renal complications (Gallant et al., 2004; Nelson et al., 2007). It was only later that the first
tenofovir-related nephrotoxicity studies started to arise. These mismatched results may be because clinical trials have very strict inclusion and exclusion criteria, while in routine clinical practice patients have highly diverse backgrounds, and some of them may be predisposed to a higher tenofovir
nephrotoxicity sensibility (Fernandez-Fernandez et al., 2011).
The main site of tenofovir toxicity is the proximal tubule. Since tenofovir has to enter the proximal tubular cells to be secreted, it accumulates inside them, causing toxicity. Current evidence suggests that
mitochondria are the main targets of tenofovir toxicity within the cell. Several human (Tsai et al., 2014)
and animal studies have shown damage to specifically renal proximal tubular mitochondria (Abraham
et al., 2013).
14 It is well known that mitochondrial damage usually results in the overproduction of reactive oxygen species (ROS) and reactive nitrogen species (RNS), which upon accumulation can cause oxidative and nitrosative damage to the lipids, proteins and DNA. Proximal tubular cells have a relative high requirement for ATP for the active reabsorption of filtered nutrients and ions, making them naturally sensible to mitochondria damage, given the fact that mitochondria are the main producers of ATP in the
cell (Abraham et al., 2013; Ramamoorthy et al., 2014). Therefore, when mitochondria are impaired,
ATP production is depleted and tubular cells cannot properly ensure reabsorption of ions and small molecules, such as potassium, glucose, phosphate, uric acid, amino acids, and β2- microglobulin. As it is, these molecules are secreted in abnormal quantities in the urine, which is the definition of the Fanconi
syndrome (Tsai et al., 2014). Damage to the proximal tubular mitochondria can therefore have two
consequences: i) proximal tubular dysfunction resulting in Fanconi syndrome and ii) increased
production of ROS thereby resulting in increased oxidant stress (Abraham et al., 2013).
The main clinical presentations of tenofovir nephrotoxicity are: i) proximal tubular dysfunction with normal renal function and ii) proximal tubular dysfunction with decreased renal function. Decreased renal function may be classified as AKI, CKD, or GFR that is decreased when compared with baseline values, albeit within normal limits. In severe cases patients can develop Fanconi syndrome that may or
may not be associated with decreased GFR (Abraham et al., 2013; Fernandez-Fernandez et al., 2011).
Tubular dysfunction may precede the decline of renal function (Fernandez-Fernandez et al., 2011).
Thus, it is important to highlight that tenofovir associated nephrotoxicity not always is associated with altered GFR, one of the mostly used parameters that is routinely checked for the diagnosis of kidney diseases.
As with most drugs, the prediction and management of tenofovir-related neuphrotoxicity has been relying on the mechanisms of the drug insult and on optimal animal models to explore it. Albeit several case reports and meta-analyses have been performed on humans, they have important limitations due to
the big number of factors that cannot be controlled over the population, e.g. genetic factors, environment
factors (e.g. diet, alcohol, smoke, drugs), low adherence to the therapy, alterations of prescribed ARVs
mid-therapy (mainly because of its ineffectiveness and/or side effects) (Islam et al, 2012). As it is,
15
2.
Zebrafish (
Danio rerio
)
Several different animal models have been used to date – rats, mice, mini-pigs, fruit flies and others in
toxicology (Kohler et al., 2009; Ramamoorthy et al., 2014; Cui et al, 2014; Cud, 2005). The animal
model may vary depending of the study intent and field area, but an emergent animal model to study drug toxicity that has been gaining popularity, given its attractive advantages is the zebrafish.
a.
Ecology
Kingdom: Animalia
Phylum: Chordata
Superclass: Osteichthyes
Class: Actinopterygii
Order: Cypriniformes
Family: Cyprinidae
Genus: Danio
Species:D. rerio
The zebrafish (Danio rerio) are ray-finned fishes (Actinopterygii), a class of the bony fishes superclass
(Osteichthyes). They belong to the Cypriniformes order and to the family of freshwater fishes
Cyprinidae (Spence et al., 2008).
Zebrafish are indigenous to South Asia, around the Ganges and Brahmaputra river basins, and are broadly distributed across parts of India, Bangladesh, Nepal, Myanmar, and Pakistan (Lawrence, 2007;
16
Figure 7 – The natural distribution of the zebrafish. Major river systems indicated. Black dots indicate recorded
occurrences. Illustration adapted from Spence et al. (2008).
These reported natural occurrences suggest that zebrafish seem to prefer still or slow moving water bodies, for example the edges of streams and ditches, particularly adjacent to rice-fields (Sterba, 1962, Talwar & Jhingran, 1991; Jayaram, 1999), which are more likely free of large predatory fishes (Spence
et al., 2008) and rich in fertilizers that promote the growth of zooplankton, a major component of the
zebrafish diet. They also prefer shallow waterbodies, frequently in unshaded locations with aquatic
vegetation and a silty substratum (Spence et al., 2008). They have a preference for slightly alkaline
water (pH∼8.0) of relatively high clarity (Lawrence, 2007) and have a maximal thermal tolerance range
of 6.7–41.7oC, although the recommended temperature range for their maintenance, given by Matthews
et al. (2002), is 24-30oC.
Zebrafish are omnivorous, their natural diet consisting primarily of zooplankton and insects (Spence et
al., 2008). They are an annual species in nature (Spence et al., 2008), but domesticated zebrafish have
been shown to have a mean life span of 42 months (Gerhard et al., 2002). In the laboratory, domesticated
zebrafish strains breed all year whereas in nature spawning is more seasonal, which is probably dependent on food availability that co-varies with season, since their natural habitat has a monsoon
climate (Spence et al., 2008). They have courtship behavior and ovulation is dependent on female
exposure to male gonadal pheromones (Spence et al., 2008).
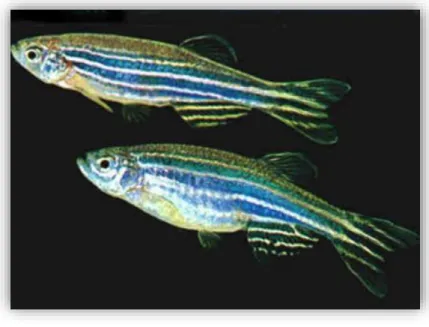
17 pattern: dark blue melanophores, gold xantophores and iridescent iridophores. They have five to seven
blue stripes that interleave with yellow ones (White et al, 2007; Spence et al., 2008) (Fig. 8).
Males and female fish are very similar, albeit males tend to be slimmer and have larger and more yellow anal fins, while females tend to have a bigger belly (Fig. 8).
Figure 8 – Male and female adult zebrafish. The fish on the top of the image is a male fish, while the bottom
one is a female. Image adapted from http://www.achetudoeregiao.com.br/.
b.
Zebrafish (
Danio rerio
) as a powerful vertebrate model
The zebrafish has emerged as an excellent model organism for studies on vertebrate biology. It is especially attractive due to its several advantages (Dooley and Zon, 2000; Bluthgen, 2014):
1. It is a vertebrate animal;
2. All sequenced genome;
3. High homology with humans at the genetic (85% of homology in genomes), anatomical,
physiological, cellular and molecular levels;
4. Embryonic transparency, that allows a visual analysis of early developmental processes as well
as microinjection;
5. Rapid development, with precursors of all major organs developed within 36 hours post
fertilization (hpf) and fully developed larvae available after 48 - 72 hpf;
6. They achieve sexual maturity at 3-4 months;
7. Embryonic development outside the uterus;
18
9. Small and robust;
10. Low space requirements;
11. The different development stages are well characterized;
12. Wealth and versatility of genetic, cellular and physiological manipulations that can be
performed;
13. Several different transgenic strains available;
14. Relativly cheap maintenance.
Therefore, several authors have searched and requested zebrafish to perform a high variety of studies, including nephrotoxicity tests, since the zebrafish kidney is now recognized as a valuable tool to identify and assess the function of renal genes and model renal diseases (Gerlach and Wingert, 2013), and the kidney is an organ highly susceptible to drug toxicity.
The vertebrate kidney is an essential organ responsible for the removal of metabolic waste through blood filtration. In addition, it also produces several important regulatory hormones and helps to maintain
homeostasis (e.g., fluid, pH, blood pressure) (Drummond and Davidson, 2010).
The kidney is composed of several nephrons, the functional units of the kidney. A nephron is composed of a glomerulus (the blood filter) attached to a segmental epithelial tubule that guides the filtrate – urine
– into a collective duct and later to the urinary bladder for excretion (Drummond and Davidson, 2010;
Cheng et al., 2015).
Higher vertebrate’s embryo development is characterized, regarding kidney ontogeny, for the generation and subsequent degradation of three kidneys of increasing complexity. The first kidney-like structure is the pronephros, whose function in higher vertebrates, up until now, is not known. Upon its degradation, the mesonephros arises, who functions as the embryo filtration organ. The metanephros arises then, upon the mesonephros destruction, and serves as the adult kidney (Drummond and Davidson, 2010;
Cheng et al., 2015).
Lower vertebrates, such as the amphibians and fishes, never develop a metanephros, instead using the mesonephros as the adult kidney. Also, opposite to the higher vertebrates, its pronephros is fully
functional and serves as the filtration and osmoregulation organ in free-swimming larvae (Cheng et al.,
2015; Drummond et al., 1998).
The larvae zebrafish pronephros, opposite to the mesonephros and metanephros, is a very simple organ that is fully developed at 4 dpf (days post fertilization). It consists of only two nephrons with two glomerulus fused together at midline, pronephric tubules connecting directly to the glomeruli and paired bilateral pronephric ducts which conduct the filtrate outside the animal, through the cloaca (Drummond
19 proximal tubule segments (proximal convoluted tubule and proximal straight tubule) and two distal tubule segments (distal early and distal late) that are homologous in several ways to the segments of the mammalian nephron (Drummond and Davidson, 2010) (Fig. 9.3).
Although the overall structure of the zebrafish pronephros is quite different from higher vertebrate’s
kidney, tubular and glomerular differentiation processes are similar (Fig. 9.1) (Cheng et al., 2015;
Drummond et al., 1998). Several reports have previously shown that the functions of many genes
important during mammalian renal ontogeny are conserved in the zebrafish.
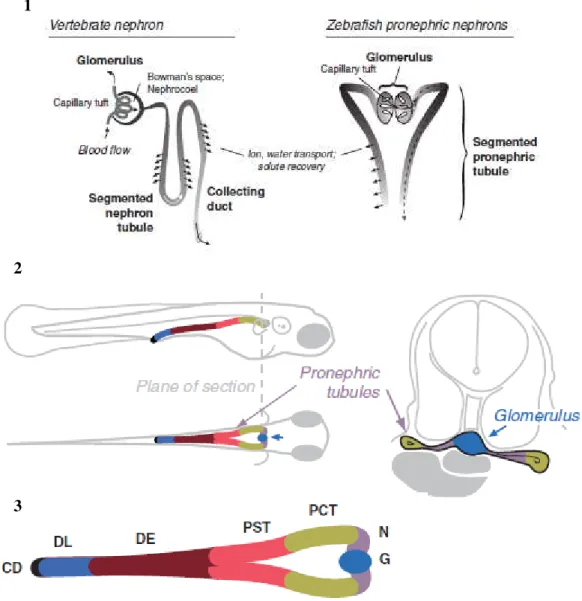
Figure 9 – Zebrafish pronephros. (1) Similarity between the vertebrate nephron and the zebrafish pronephric
nephrons. (2) Diagram of the zebrafish pronephric kidney in a 3 dpf larva; midline compound glomerulus connects to the segmented pronephric tubules that run laterally; the nephrons are joined at the cloaca where they communicate with the exterior. (3) The several segments that comprise the zebrafish nephron: neck (N), proximal convoluted tubule (PCT), proximal straight tubule (PST), distal early (DE), late distal (DL), and collecting duct (CD). Illustration adapted from Drummond and Davidson (2010).
1
2
20
Therefore, the zebrafish is an attractive tool for the in vivo research on the regulation of kidney
development, and has been quite useful in the study of the glomerulus formation, as well as on its molecular regulation. The zebrafish pronephros provides, then, a simplified renal system that can be used for the nephron-related studies, including nephrotoxicity.
21
Aims
What is known?
1. Zebrafish has become a very popular animal model in toxicology due to its several technical
and scientific advantages;
2. Paracetamol and gentamicin, two drugs known to cause nephrotoxicity in humans, have already
been demonstrated to cause morphological and/or functional alterations in the pronephros of zebrafish larvae;
3. Tenofovir, a widely used ARV, causes proximal tubulopathy that precedes the decline in the
GFR;
4. The mechanism of renal toxicity of tenofovir is not fully understood, but mitochondria could be
a possible target for its toxicity.
What needs to be known?
1. Whether zebrafish larvae are a good model to study tubular toxicity;
2. The relationship between tenofovir concentration and its lethality in zebrafish larvae;
3. If tenofovir affects the renal function in zebrafish larvae;
4. If tenofovir induces ultrastructural mitochondrial changes in zebrafish larvae;
5. It tenofovir induces mitochondrial DNA alterations in zebrafish larvae cells;
6. If there are any differences, in terms of toxicity, between tenofovir and its pro-drug, TDF.
Working hypothesis:
The working hypothesis of this thesis is that tenofovir induces the same alterations that are reported in humans, in zebrafish larvae: tenofovir causes mild or no alterations in the glomerular function and causes ultrastructural mitochondrial alterations in the proximal tubule.
23
Materials and methods
1.
Zebrafish lines used
All procedures involving zebrafish were approved by the Ethical Committee at the Instituto Gulbenkian de Ciência (IGC), according with directives from Direcção Geral Veterinária (Portaria nº 1005/92 de 23 de Outubro).
For this work, two zebrafish lines were used: casper and nacre wt1b::GFP; cdh17::GFP. These specific
lines were chosen because nacre wt1b::GFP; cdh17::GFP has the pronephros marked with green
fluorescence and as the main focus of this thesis regards changes in this organ, it will prove to be helpful
in further experiments; casper line was chosen because of the larvae transparency.
The casper (mitfa-/-,roy-/-) zebrafish are transparent through all adulthood and embryogenesis, since they
are doubly mutant for nacre (complete lack of melanocytes due to a mutation in the mitfa5 gene (Lister
et al., 1999; White et al., 2007) and roy (complete lack of iridophores, the gene/mutation responsible is
currently unknown) (White et al., 2007; http://zfin.org). This zebrafish line was chosen because its
transparency allows to see the internal structures and organs of the larvae (including the blood vessels).
The nacre (mitfa-/-, roy+/+ or +/-) wt1b::GFP; cdh17::GFP (Fig. 10.1) zebrafish are also transparent, since
nacre zebrafish lack the mitfa gene, even though they express roy. The Wilms tumor suppressor (Wt1b)
gene encodes a zinc-finger transcription factor and is expressed in several organs, such as the kidney,
gonads and spleen (Horsfield et al., 2002). cadherin-17 (cdh17). The zebrafish homolog of the
mammalian kidney-specific cadherin6, is expressed in the epithelium of the pronephric tubule and ducts,
in larvae, as well as in the mesonephric tubules and ducts of juvenile fish (Zhou et al. 2010). In this line,
the wt1b sequence is attached to the GFP sequence, thus driving the fluorescence expression to the
proximal tubule and the glomerular primordium in the pronephros (Horsfield et al., 2002); another GFP
sequence is attached to the promoter of cdh17, guiding the fluorescence to the distal and collecting ducts
of the pronephros and mesonephros (Fig. 10.2). GFP is also expressed in the pancreas and gut, probably because of enhancer elements of the 5’ neighbor gene of wt1b, the gene ga17, and also, more weakly,
in the eye, gill arches and heart sac, due to the wt1b::GFP (Horsfield et al., 2002).
5Microphthalmia-associated transcription factor a (Lister et al., 1999).
6The cadherin superfamily of transmembrane glycoproteins are calcium-dependent cell adhesion molecules
24
Figure 10 –5 dpf nacre wt1b::GFP; cdh17::GFP larvae. (1) Whole larvae image, obtained with a microscope.
(2) Close up of the region where the fluorescence can be seen, between the middle of the larvae eyes until the cloaca (from left to right); the image was obtained with a confocal microscope. Ey – eye; Pt – proximal tubule; D – duct; C – cloaca.
2.
Zebrafish breeding and maintenance
Adult zebrafish were raised and maintained at 28ºC with 14h on/ 8h off light cycle, in the Fish Facility of the IGC. Male and female fish were matted once per week according to the protocols of the Fish Facility. After crossing, embryos were collected and grown at 28°C in embryo media (EM) till 4 dpf,
time point when the zebrafish pronephros is structurally and functionally developed (Drummond et al.,
2004). Embryo media was changed 24h after crossing in order to remove non-viable embryos. All recipes of every solution can be consulted in the annex I.
3.
Drug stocks
Three different drugs were used for the next experiments of this thesis: gentamicin, paracetamol and
tenofovir. Gentamicin7 and paracetamol8 were used as positive controls, as several previous reports on
zebrafish larvae stated that gentamicin decreased renal function (Hentschel et al., 2004) and paracetamol
7 An aminoglycoside antibiotic used in the treatment of several bacterial infections manly caused by Gram-negative
organisms (Perner et al. 2007).
8 Also known as acetaminophen, is the most commonly available over-the-counter drug, and it is used for the relief
of fever and headaches due to its analgesic and antipyretic properties (McCampbell and Wingert, 2014; David and Pancharatna, 2009)
1
2
Pt
Ey
C Gut
25
induced morphological alterations in the glomerulus (Peng et al., 2010). Negative controls were exposed
to the drug vehicle, water or EM. Tenofovir was administered in two forms: as TDF (Sequoia Research Products, UK) and TFV (Sequoia Research Products, UK). A stock solution for each drug was previously prepared at solubility concentration: 5000 µg/mL gentamicin, 12000 µg/mL paracetamol, 5000 µg/mL TFV and 6000 µg/mL TDF. All drugs powder were dissolved in water, except TFV, which was dissolved directly in EM due to its relatively low solubility and the high concentrations that are required to observe lethal effects. So, the percentage of water would be higher than the percentage of
EM, which could be unpleasant to the larvae. All drug solutions were stored at -20oC until further use.
4.
Larvae drug exposition by soaking
Drugs were delivered by soaking, thus meaning by diluting a specific volume of each drug stock solution, or water or EM in case of negative controls, in the EM and in each well of a 96 well plate (total
volume per well = 350 µL). 2 larvae of 4 dpf were placed per well. Drug exposition lasted 24h, at 28oC.
Larvae mortality and macroscopic alterations (including both behavioral and morphological alterations) were always registered.
5.
Lethality curves
The nacre wt1b::GFP; cdh17::GFP zebrafish line was used to perform this experiment. Lethality curves
for TDF and TFV were obtained with 5 or 6 different concentrations: 1000, 1500, 2000, 2500 and 3000 µg/mL for TDF and 2500, 3000, 3500, 4000, 4500 and 5000 µg/mL for TFV. Lethality curves for paracetamol and gentamicin had already been previously obtained. Drug concentrations for each drug were chosen so that the lowest would equal a 0% mortality and the highest a 100%. 10 larvae of 4 dpf were used for each concentration and 4 or 5 replicates were made for each drug concentration. After 24h of drug exposure, all zebrafish larvae were observed under a stereoscope (Nikon SMZ 745). The following characteristics were evaluated: body curvature, tail-flip response, heart oedema, heartbeat and necrosis. Lethality was defined as the absence of heartbeat and/or the presence of body necrosis. Percentages of lethality were calculated and plotted against the logarithm of drug concentration. The
slope of the curves as well as the LC10 and LC50 (Lethal Concentration for 10% and 50% of the
population, respectively) were calculated after the Probit transformation (Randhawa, 2009). The slope
of each curve was obtained through the tendency line equation of the respective curve. The LC50 and
LC10 values were obtained by plotting the probits values 5 or 3.72, respectively, against the log
26
The LC10 was the concentration selected for the following experiments of this thesis. Choice criteria
were: i) high enough concentration that would probably enable the appearance of visible alterations, morphological and functional, with the different administrated drugs, and also ii) low enough concentration so that the majority of the living larvae would not be moribund, since it could give unreliable results and also because it would be unethical to keep the larvae in visible suffering with such high drug-toxicity levels.
6.
FITC-inulin clearance assay
Renal function was assessed with the FITC-inulin clearance assay, following the protocol published by
Rider et al. (2012), with some modifications. The casper zebrafish line was used for these experiments
due to the transparency of their larvae and their non-fluorescence.
2.5% (w/v) FITC-inulin was dissolved in 0.9% NaCl, at ~70oC, and dialyzed with 1000 Da dialysis
tubingfor the removal of any unbound FITC. The solution was stored at -20oC until further use.
Casper larvae (4 dpf) were exposed to the LC10 of each drug for 24h. After drug exposition larvae were
anaesthetized with a 1:6 dilution of tricaine (x25) and placed laterally on a 2% agarose injection mold.
1.4 nL of 2.5% (w/v) FITC-inulin solution, previously heated at ~70oC to dissolve any potential crystals,
27
Figure 11 –Place of injection in larvae. Casper larvae (5dpf) were injected in the CCV, as part of the
FITC-inulin clearance assay. (1) Larvae laterally placed upon an agarose mold. (2) Close up of the black dotted box of the previous image, showing the place of injection. Black arrows and line – CCV.
Fiji software was used to quantify FITC-intensity for each larvae. Rider et al. (2012) performed three
FITC-intensity measurements over the caudal artery (Fig. 12.2), in the area posterior of the cloaca,
between somites 16 and 18. But since this was a rather time consuming performance, Rider’s protocol
was adapted for the experiment reported here so that only one measurement was executed, covering the
intersection of four intersegmental vessels (the area measured in Rider et al. (2012)) (Fig. 12.3). A
paired-samples t-test (IBM SPSS v.22) confirmed the equality between the mean of the three FITC-intensity measurements and the one measurement made covering the same area of the caudal artery, for both the fluorescent values at 0h and 2h (p<0.001). As it is, the FITC-intensity was obtained by only one measurement throughout the rest of the experience.
1
28
Figure 12 – FITC-intensity 2h after FITC-inulin injection. Zebrafish larvae (5 dpf) injected with 1.4 nL 2,5%
FITC-inulin. 1- Whole larvae; 2- Zoomed in image of the region over the caudal artery where the FITC-intensity
was measured as in Rider et al. (2012); 3- Zoomed in image of the region over the caudal artery where the FITC-intensity was measured; a - marked area shows the region in which the intensity value was acquired, covering the
extent within the intersection of four intersegmental vessels and casing the three regions in which Rider et al.
(2012) measures the FITC intensity. b - the three measurements performed by Rider et al. (2012).
Larvae with FITC-intensity values (mean grey value) under 50 were discarded, since the amount of injected FITC-inulin was so little that it could had run out before the 2h period. Also, larvae with fluorescence clots or injuries, resulting in extended damaged vessels, were discarded. The fluorescence measured 2h after injection was normalized with the fluorescence measured at 0h to correct for variability in initial FITC-intensity. Thus, results were expressed as percentage of FITC-intensity 2h
after injection, which was calculated as the ratio – (FITC-intensity 2h / FITC-intensity 0h) *100.
Two replicates of the assay were performed for each drug and the minimal number of larvae that were injected for each drug in each replicate was 15 larvae. Control larvae were always injected in parallel with drug-exposed larvae, for comparison reasons and statistical analysis.
7.
Transmission Electron Microscopy (TEM)
Nacre wt1b::GFP; cdh17::GFP larvae (4dpf) were exposed to the LC10 of each drug for 24h. After drug
exposition, larva were euthanized with ice and fixed o/n in a fixation solution. Microwave procedure was used to fix the larvae (see annex II for a better explanation). After fixation, larvae were left in 100%
EPON resin o/n. On the following day, molds were made with 100% resin at 60oC in an oven.
1
a
a 3
29 Transversal sections were cut with a glass or diamond knife of 70 nm (for 2D micrograph), 100 nm (for serial sequences) or 120 nm (for tomograms), in the proximal convoluted tubules zone (when at least two parts of the tubule could be seen in the same side, since in this zone they are convoluted). For the serial images and tomograms, sections were sequentially cut. Sections were stained with 4x 1min uranyl acetate, 4x 1min water, 3min lead citrate and 5x 1 min water. For the tomograms, gold was added (10nm diameter) to the grids.
Photomicrographs were taken with a Transmission Electron Microscope (TEM, Hitachi H-7650). Three types of analyses were performed with TEM: 2D single micrographs, serial sequences and tomograms. 2D single micrographs are regular micrographs that were taken with a magnification of 1k, 3k, 5k and 10k per condition. Serial sequences consist on a z-series of 36 micrographs of the same cell (covering 360 nm of the cell, along the z-axis) from sequential sections, with a magnification of 3k; criteria for cell selection were that it was part of the tubules, fit wholly in the micrograph, nucleus was present and the apical side of cell ended in microvilli. For the tomograms, 111 micrographs were taken, with a
magnification of 8k, on the same section, in the same spot, but with different angles (from -55o to 55o,
with a 1o increase); criteria for spot selection were a minimum of 3 mitochondria that fit in the same
micrograph, mitochondria belonged in a cell from the tubule where the apical side ended in microvilli and in which the nucleus was present; 3 tomograms from 3 serial sections were performed for each condition.
Each set of 36 serial micrographs was opened with Fiji to set a scale and then saved as an image sequence. In a Linux environment (with the software Cygwin) they were converted to .st files and aligned with midas with the eTomo software. The aligned file was opened with the 3dmod software and a Z value, correspondent of the thickness of the section (19.85 pixels), was given to the micrographs.
Each tomogram was opened with Fiji and saved as an image sequence. In a Linux environment (with the software Cygwin) they were converted to .st files and aligned by tracking the gold beads with the eTomo software. The three sequential tomograms were then opened with eTomo, aligned with midas and saved as just one file.
30
8.
Statistical Analysis
Lethalities and FITC-intensities are expressed as mean and standard deviation. Larvae mortality is expressed as mean percentage.