Carolina Pereira Lobato Costa
Bachelor in Micro and Nanotechnology Engineering
September 2018
Investigation of laser based processes to optimize
eletrospun nanofiber nonwovens for tissue engineering
Dissertação para obtenção do Grau de Mestre em
Engenharia de Microeletrónica e Nanotecnologias
Supervisor: Prof. Dr. rer.nat. G. Hillrichs, University of Applied Sciences,
Merseburg
Co-Supervisor: Prof. Dr. João Paulo Borges, Associate Professor with
Habili-tation, Faculdade de Ciências e Tecnologia da Universidade
Nova de Lisboa
Júri:
Presidente: Prof. Dr. Rui Igreja
Arguentes: Prof. Dr. Jorge Silva
Investigation of laser based processes to optimize eletrospun nanofiber nonwovens for tissue engineering applications
Copyright © Carolina Pereira Lobato Costa, Faculdade de Ciências e Tecnologia, Uni-versidade Nova de Lisboa.
vii
Acknowledgements
First of all, I would like to thank Faculdade de Ciências e Tecnologia da Universidade Nova de Lisboa, to Prof. Dr. Rodrigo Martins and Prof. Dra. Elvira Fortunato for the promotion and continuous improvement of this excellent and wise course, that make us globally competitive.
I am heartily also grateful to the University of Applied Sciences Merseburg, Germany and my supervisor Prof. Georg Hillrichs for suggesting the topic and giving me this great opportunity for developing research abroad. I would also like to thank Prof. João Paulo Borges for the support as my co-supervisor. Also, to Marco Götze and Olaf Krimig for all the guidance and assistance during the project. To Eramus + program for sup-porting me financially.
Futhermore, thanks to my Eramus friends for listening me, supporting me and made my journey in Germany one of the best experiences of my life.
Um enormíssimo obrigada vai para a minha família que sempre acreditou, suportou e me ajudou (mesmo em dias insuportáveis…), também para meus amigos da facul-dade/residência por me aturarem e por proporcionarem tão bons momentos que torna-ram esta grande e dura etapa maravilhosa. Não esquecendo a comandita de Monção que sempre viu o lado melhor de mim.
Much more people supported me during this journey. Without all of them, their contri-bution, their encouragement, this work would not have been possible.
Muito muito obrigada, Thanks a lot,
ix
Abstract
Polymers and especially polymeric nanofibers are widely investigated in tissue engineering. These materials can imitate the extracellular matrix. Therefore, they can be used as scaffolds for growing human cells. However, in many cases a surface treatment of the nanofiber nonwovens is useful to enhance the cell adhesion. The polar and dis-persion components of surface free energy have to be adjusted to control the wettability.
To optimize the cell colonization on electrospun nanofibers, polyamide (PA 6.6) and polylactide (PLA) fibers were processed with different types of pulsed UV laser ra-diation. For comparison polyimide (PI), PA and PLA bulk materials were also gated. Static contact angles were measured before and after laser processing to investi-gate the effects of laser irradiation on the wettability. The morphology of the treated areas was evaluated by confocal and scanning electron microscopy. Chemical analyses, like FTIR-ATR were also performed.
The wettability of the different materials was changed. PA nanofiber nonwovens are hydrophilic and are appropriate for good adhesion of some kind of cells. PLA nano-fiber nonwovens are hydrophobic. By certain laser processes, it was also possible to make this material more hydrophilic. It was observed, that the laser generated topogra-phy of the nonwovens plays a great rule in the wettability.
xi
Resumo
Polímeros e nanofibras poliméricas são amplamente utilizados em engenharia de tecidos. Estes materiais imitam a matriz extracelular podendo ser utilizados como su-porte para o crescimento de células humanas. No entanto, muitos requerem tratamento de superfície para melhorar a adesão celular, assim como para controlar a molhabili-dade.
Para otimizar a colonização celular em nanofibras produzidas por eletrospinnig, fibras de poliamida (PA 6.6) e poliácido láctico (PLA) foram processadas com diferentes tipos de radiação laser pulsada. Para comparação, poliimida (PI), PA e PLA bulk foram também investigados. A molhabilidade foi medida antes e depois da irradiação do laser. A morfologia das áreas tratadas foi avaliada por microscopia confocal e microscopia ele-trónica de varredura. Análises químicas, como FTIR-ATR foram também realizadas.
A molhabilidade dos materiais foi alterada. As nanofibras não tecidulares de PA são hidrofílicas e ocorrendo uma boa adesão de certas espécies celulares. As nanofibras não tecidulares de PLA não hidrofóbicas. Embora, com o tratamento com nanosecond la-ser fosse possível tornar este material mais hidrofílico. Além disso, obversou-se que a topografia gerada pelo laser nas fibras, desempenha uma papel crucial na molhabili-dade.
xiii
Contents
LIST OF FIGURES ... XV
LIST OF TABLES ... XVII
LIST OF SYMBOLS ... XVIII
INITIALISMS ... XX
MOTIVATION ... 1
INTRODUCTION ... 3
FUNDAMENTALS AND LITERATURE ... 5
2.1WETTABILITY ... 5
2.2LASER STRUCTURING ... 6
2.3WENZEL AND CASSIE-BAXTER MODELS ... 6
MATERIALS AND METHODS ... 9
3.1MATERIALS ... 9
3.2CONTACT MEASUREMENT /WETTABILITY ... 10
3.3ATR-FTIR ... 12
3.4LASER STRUCTURING ... 12
3.5MICROSCOPY ... 15
RESULTS AND DISCUSSION ... 17
4.1POLYIMIDE BULK ... 17
4.2POLYAMIDE 6.6 ... 26
4.3PLLA(POLY-L-LACTIDE) ... 29
APPENDIXA ... 45
APPENDIXB ... 47
APPENDIX C ... 50
xv
List of Figures
FIGURE 2.1 CASSIE- BAXTER MODEL[18] ... 7
FIGURE 3.1- SEM PICTURES OF: UNTREATED PA NANOFIBERS AND UNTREATED PLA NANOFIBERS . ... 10
FIGURE 3.2- DROP SHAPE ANALYZER -DSA25E, KRÜSS; DROP PROFILE, [26]. ... 11
FIGURE 3.3- SCHEMATIC OF THE PICO-SECOND LASER SYSTEM, [28] ... 13
FIGURE 3.4 - SCHEMATIC OF LASER STRUCTURING, [29] ... 14
FIGURE 3.5- EXAMPLE OF THE PROFILE ROUGHNESS FOR RA CALCULATION, [32] ... 15
FIGURE 3.6-EXAMPLE OF THE PROFILE ROUGHNESS FOR RZDIN CALCULATION,[32] ... 16
FIGURE 4.1- SEM IMAGES OF POLYIMIDE WITHOUT CLEANING TREATMENT ANDAFTER CLEANING TREATMENT ... 19
FIGURE 4.2- INTERFERENCE PATTERN OBTAIN BY COMPUTER SIMULATION OF THE LASER PARAMETERS ... 20
FIGURE 4.3-ATR-INFRARED SPECTRA OF POLYIMIDE BULK AND POLYIMIDE TREATED WITH PICOSECOND LASER BEFORE AND AFTER CLEANING TREATMENT WITH ISOPROPANOL ... 20
FIGURE 4.4- GRAPHS WITH CA, SRA AND SRZDIN OF PI BULK SAMPLES STRUCTURED WITH DIFFERENT LASER PARAMETERS ... 22
FIGURE 4.5 SEM PICTURES OF POLYIMIDE BULK TREADED WITH 7,3 J/CM2: LINE DISTANCE OF 20 µM; SPOT DISTANCE OF 4 µM AND LINE DISTANCE OF 10 µM; SPOT DISTANCE OF 10 µM. ... 23
FIGURE 4.6- GRAPH WITH WATER CA OF POLYIMIDE SAMPLES STRUCTURED WITH DIFFERENT SPOT DISTANCE. ... 23
FIGURE 4.7- SEM PICTURES OF POLYIMIDE BULK TREADED WITH 7,3 J/CM2, LINE DISTANCE OF 20 µM: SPOT DISTANCE OF 2 µM ND SPOT DISTANCE OF 16 µM (RIGHT).ANDRESPECTIVE PROFILE GRAPHS ... 24
FIGURE 4.8-SEM PICTURE OF POLYIMIDE BULK TREADED WITH 7,3 J/CM2, LINE DISTANCE OF 20 µM, SPOT DISTANCE OF 2 µM AND VELOCITY OF 200 MM/S,ANDRESPECTIVE PROFILE GRAPH OF THE SAMPLE SURFACE ... 25
FIGURE 4.9- GRAPH OF THE WATER CA IN FUNCTION OF THE CONTACT TIME WITH UNTREATED PA NANOFIBERS. . 27
FIGURE 4.10- PICTURES OF THE SAME DROPLET BUT IN DIFFERENT TIMES: (T=0 MS), (T=13MS) AND (T=104 MS). ... 27
FIGURE 4.11- GRAPH OF THE WATER CONTACT ANGLE AS A FUNCTION OF THE CONTACT TIME WITH PA NANOFIBERS TREATED WITHPSLASER . ... 28
FIGURE 4.12- SEM PICTURES OF TREATED PA NANOFIBERS. :SPOT DISTANCE OF 4 µM AND LINE DISTANCE OF 40 µM (V=400 MM/S, F=100 KHZ, F=0,74 J/CM2) AND WITH A SPOT DISTANCE OF 4 µM AND LINE DISTANCE OF 20 µM (VELOCITY OF 400 MM/S, 100 KHZ AND 0,74 J/CM2). ... 28
FIGURE 4.13-SEM PICTURE OF PLLA BULK TREATED WITH A SPOT DISTANCE OF 8 µM, LINE DISTANCE OF 20 µM (V=200 MM/S, 25 KHZ AND 7,3 J/CM2. RESPECTIVE PROFILE GRAPH OF THE SAMPLE SURFACE. ... 30
FIGURE 4.14-SEM PICTURE OF PLLA BULK TREATED WITH A SPOT DISTANCE OF 8 µM, LINE DISTANCE OF 40 µM (V=200 MM/S, F=25 KHZ, F=7,3 J/CM2). RESPECTIVE PROFILE GRAPH OF THE SAMPLE SURFACE ... 30
FIGURE 4.15- GRAPH OF THE WATER CONTACT ANGLE IN FUNCTION OF THE CONTACT TIME WITH UNTREATED PLLA NANOFIBERS. ... 31
FIGURE 4.16-SEM PICTURES OF PLLA NANOFIBER TREADED WITH A SPOT DISTANCE OF 4 µM, LINE DISTANCE OF 40 µM (V= OF 200 MM/S, F= 50 KHZ AND 7,3 J/CM2). ... 32
xvi
FIGURE 4.18- SEM PICTURES OF PLLA NANOFIBER WITH LINE DISTANCE OF 8 µM AND SPOT DISTANCE OF 4 µM (V=200 MM/S, F=50 KHZ AND 1,51 J/CM2). ... 34
FIGURE 4.19-SEM PICTURES OF PLLA NANOFIBER TREATED WITH NANOSECOND WITH 47,31 J/CM2; 42,58 J/ CM2
AND 37,84 J/ CM2 ... 35
FIGURE 4.20- GRAPHS OF THE WATER CONTACT ANGLE IN FUNCTION OF THE CONTACT TIME WITH PLLA NANOFIBERS ALL TREATED WITH F= 200 KHZ, V=5 MM/S, LINE DISTANCE OF 20 µM AND 47, 31 J/CM2,
42,58 J/CM2AND 37,84 J/CM2. ... 35
xvii
List of Tables
TABLE 3.1- CHARACTERISTICS OF THE BULK MATERIALS STUDIED ... 9
TABLE 3.2- DATA OF THE PICOSECOND LASER ... 12
TABLE 3.3- DATA OF THE NANOSECOND LASER (COHERENT MATRIX 355) ... 13
TABLE 3.4- DATA OF THE NANOSECOND LASER (NEXLASE) ... 13
TABLE 3.5- ABLATION THRESHOLD FOR EACH MATERIAL ... 14
TABLE 4.1- COMPARISON BETWEEN RESULTS OBTAINED BEFORE AND AFTER CLEANING TREATMENT ... 18
TABLE 4.2- VARIATION OF PI TREATED WATER CA UNDER NORMAL ATMOSPHERE ... 21
TABLE 4.3- DIFFERENT “INITIAL” WATER CONTACT ANGLES MEASURED IN T=0 S IN PA NANOFIBERS ... 27
TABLE 4.4- WATER CONTACT ANGLE ON PLLA NANOFIBERS WITH DROPLETS OF DIFFERENT SIZES ... 31
TABLE 4.5- CA MEASURED AND CALCULATED USING CASSIE BAXTER MODEL ... 36
TABLE A.1 ,A.2 AND A.3 - COMPARISON BETWEEN RESULTS OBTAINED BEFORE AND AFTER CLEANING TREATMENT ... 45
TABLE A. 4- VALUES MEASURED AND CALCULATED IN POLYAMIDE BULK TREATED WITH NANOSECOND LASER ... 46
TABLE B.1- WATER CONTACT ANGLE OF PI BULK SAMPLES STRUCTURED WITH DIFFERENT LASER PARAMETERS .... 47
TABLE B. 2- WATER CONTACT ANGLE OF POLYIMIDE SAMPLES WITH DIFFERENT SPOT DISTANCES ALL SAMPLES WERE CLEANED WITH ISOPROPANOL. ... 48
TABLE B.3- PROPERTIES OF THE PI SAMPLES WHERE IT WAS ACHIEVED SIMILAR CA ... 49
TABLE C. 1- PROPERTIES OF PLLA BULK SAMPLES TREATED WITH DIFFERENT PARAMETERS WITH PICOSECOND LASER. ... 50
xix
List of symbols
d1 Spot diameter
ƒpPulse repetition frequency
ƒs Area fraction of solid on the surface
ƒv Area fraction of vapor on the surface
H Height of the evaluating area
L Evaluation length
Od Pulse overlap
r Ratio of the actual area of the solid surface to its nominal area
Ra Arithmetic mean roughness
Rmax Maximum value of the five Rzi values
RzDIN Arithmetic mean of Rzi values
Rzi Difference between the largest and smallest profile values in each section
sRa Expansion to surface data of the Ra
sRzDIN Expansion to surface data of the RzDIN
v Scan speed or velocity
ZR Rayleigh length
θC Intrinsic contact angle on the original smooth surface
θCBApparent contac angle on Cassie-Baxter model
θWActual contact angle on real rough surface or Wenzel’s angle
𝜽𝜸 Equilibrium Young contact angle observed on an ideally smooth surface
θv Contact angle on the vapor fraction
xxi
Initialisms
ATR-FTIR Attenuated total reflectance Fourier transform infrared
CA Contact angle
EB Bond energy
ECM Extracellular matrix
EP Photon energy
FDA Food and Drugs Administration
LD Line distance
NF Nanofibers
PA 6.6 Polyamide 6.6
PI Polyimide
PLA Polylactide
PS Picosecond laser
SD Spot distance
SEM Scanning electron microscopy
1
Motivation
Over the years, polymers have widely investigated for different purposes. Partic-ularly, in biomedical field, surface modification can enhance cell proliferation and colo-nization. Several processes have been studied to modified the properties of the poly-meric nanofibers produced by electrospinning that can be applied for implants and tis-sue injuries recovering.
The main objective of this work or thesis was to change the wettability of poly-actide and polyamide 6.6 nanofibers nonwovens with UV laser radiation. This two ma-terials were studied because PLA is already approved by the U.S. Food and Drugs Ad-ministration (FDA) for human clinical applications and PA 6.6 could by use for filtration purposes, for example in kidney, a problem that affects a large percentage of people in the world.
For comparison, polyimide, polyamide and polylactide bulk materials were stud-ied. Finally, in order to characterize the change of the wettability on the different mate-rials water contact angles were measured before and after laser treatment.
Introduction
In recent years, there is a growing interest on the use of polymers, like polyimide (PI), polyamide 6.6 (PA6.6), or polylactide (PLLA) in different fields. The production is comparably easy and economical and they have widely tunable mechanical and optical properties. In the biomedical field, the biocompatibility of polymers is critically depend-ent on surface properties, for example, their surface wettability which controls the flow behavior of biological reagents [1][2].
Biomaterials which mimic the extracellular matrix (ECM), such as nanofiber nonwovens, have been pointed out as good scaffolds for cartilage regeneration. The ECM typically consists of a viscoelastic network with nanofibrous proteins, that provide biological and chemical moieties as well as a physical framework for supporting cell attachment and growth[3].
PLLA nanofibers produced by electrospinning, have a large interest due to their structural similarity to the extracellular matrix of biological systems such as collagen fibers. The high surface area to volume ratio and the characteristics described above in-dicate, that they may serve as an effective tissue engineering scaffold[3]. Also, electro-spun polyamide (PA) nanofibers are interesting in the biomedical field. They are cur-rently mainly used for filtration purposes. Several studies on the cytotoxicity confirm the potential use as short-term implants or cell carriers[4].
Most of the mentioned materials are chemically inert, and, therefore, require sur-face treatment to enhance their cell adhesion, protein adsorption and motility. These characteristics are generally accepted to be influenced by polar and dispersion compo-nents of surface free energy and wettability. Thus, the capability to flexibly control and pattern surface properties of polymeric scaffolds is of significance for various practical
4
tissue engineering applications, like restoring, maintaining or enhancing tissue and or-gan function. [1-3][5][6]. Several methods, such as, enriching surfaces with ECM compo-nents or the incorporation of natural polymers with synthetic polymers to improve bio-material surfaces and make them more suitable to cell attachment and spreading, have been reported[3].Laser processing has emerged as a novel powerful approach for the modification of the surface wettability. This technique presents some unique advantages over others methods like lithography patterning techniques, plasma treatment, ion implantation or electron beam irradiation. It is a one-step direct maskless fabrication technique. Pro-grammed patterns with micrometer-scale resolution can easily be created in air or other gas atmospheres. Furthermore, laser irradiation can be applied to all kinds of materials, including hard materials such as ceramics and soft materials such as polymers or biopol-ymers[6][7].
Surface wettability studies usually involve the measurements of the contact angle between the perimeter of a liquid drop and the surface as the primary data. This contact angle indicates the degree of wetting when a solid and a liquid interact. Small contact angles (<90º) correspond to hydrophilic behavior and high wettability, while large con-tact angles (>90º) correspond to hydrophobicity and low wettability[8][9].
5
Fundamentals and literature
2.1 Wettability
The wetting proprieties of surface-modified polymers are important for defining polymer characteristics such as the ease of coating, oleophobicity or hydrophilicity. They are is often strongly correlated to the adhesion properties of surface[10].
It’s also important to know the value of surface free energy (SFE) of a biomaterial, because it has an effect on wettability. The SFE is the energy necessary for creating a new
surface unit, while separating two phases in equilibrium, in a reversible isothermal pro-cess. SFE cannot be measure directly. There are different models for the calculation of the interfacial energy that can be used to determine the surface energy of a solid via con-tact angle measurements with different test liquids (with different surface free ener-gies)[11-13].
These models are used to determine the polar and dispersive parts of the surface tension of a liquid because the cohesion between the atoms and molecules which causes the surface energy/tension of a substance can be explained by these different types of interactions. Interactions caused by temporary fluctuations of the charge distribution in the atoms/molecules are called dispersive interactions (van der Waals interaction). Polar interactions comprise Coulomb interactions between permanent dipoles and between permanent and induced dipoles (e.g. hydrogen bonds). Van der Waals interactions occur between all atoms and molecules. There is no substance with a surface free energy/ten-sion that solely consist of a polar part. On the other hand, there are substances, like dii-odomethane, which do not have any polar groups. Therefore their surface energy it is purely dispersive[12].
The main content of this research is to modify the wetting behavior of electrospun PA and PLA nonwovens with laser irradiation. However, wetting of nonwoven is a much more complex process than wetting of bulk material. It involves simultaneously
6
various wetting mechanisms, such as spreading, immersion, adhesion, and capillary penetration. Nonwovens are usually porous, heterogeneous and may have an aniso-tropic structure. Therefore, the reliability of the measurement of the contact angle is al-ways a concern, especially when the nonwoven is hydrophilic[13]. Thus, only static con-tact angles were possible to measure in nonwovens.
For comparison and for evaluation purposes, various bulk materials like PA 6.6, PLLA and PI were also investigated by static contact angle measurements. The static contact angle is more representative for the total surface, because several droplets were done on different places on the surface and the final value was an average of the all measurements.
2.2 Laser structuring
Laser direct writing is a widely used approach for generating wetting surfaces be-cause of it is ease of setup and performance. The resultant topography of laser structured surfaces depends on the exposure parameters (energy, fluence, intensity, pulse duration, repetition rate, wavelength, scanning speed, polarization, environment, etc.) and mate-rial properties (bandgap, thermal conductivity, absorption and reflection, roughness etc.)
Nanosecond laser ablation is a photophysical process due to occurrence of thermal and non-thermal mechanisms. The excitation energy is instantaneously transformed into heat that can result in material vaporization with or without surface melting. If the pho-ton energy EP is high enough, linear absorption of the electrons can occur, leading to
direct bond breaking. In this work, a wavelength of λ = 355nm was used, that results in
a photon energy of EP = 3.49eV. With this photon energy, it is possible to break C-N
bonds with a bond energy of EB = 3.04eV, existent in every studied material expect PLA[14].
Due to the short pulse duration, the laser intensity of the picosecond lasers irradi-ation is significantly higher which enables nonlinear effects like multiphoton absorption and thus increases the possibility of direct bond breaking even if EB> EP. Thus, photo-chemical ablation is expected to be the dominant ablation mechanism[15].
2.3 Wenzel and Cassie-Baxter Models
Besides the laser fluence and pulse number, the scan speed can also influence the topography and surface wettability by controlling spot overlap.
7
𝑐𝑜𝑠𝜃
(= 𝑟𝑐𝑜𝑠𝜃
+(1)
where θW is the actual contact angle on a real rough surface or Wenzel’s angle, r is
the ratio of the actual area of the solid surface to its nominal geometric area. Because of the roughness, the actual surface is bigger than the nominal surface. So, r is bigger than 1. 𝜃+ is the equilibrium Young contact angle observed on an ideally smooth surface. Wenzel’ law predicts, with the increasing surface roughness, an enhanced hydrophilic-ity for an initially hydrophilic material and enhanced hydrophobichydrophilic-ity for hydrophobic surfaces[2][16].
The emergence of hydrophobicity and even superhydrophobicity (Q > 150°) after
laser texturing can be explained by the Cassie−Baxter (suspension) model[17], which
assumes that a liquid drop does not completely wet the structured surface but interacts with the composite surface made of a substrate material and air that is trapped in the crevices of the structured surface (Fig.1) [7].
Figure 2.1 Cassie- Baxter model: Vapor pockets are trapped between the groves and the liquid droplet [18]
The apparent CA (θCB) is given by the equation 2:
cos θ
01= f
3cos θ
0+ f
6cos θ
6(2)
where θC is the intrinsic contact angle on the original smooth surface and ƒs and ƒv are
the area fractions of solid and vapor on the surface, respectively. Since ƒs +ƒv =1 and θv
=180º (“air-liquid contact angle”), implying that a suspended liquid droplet in air it is a perfect sphere,Eq. 2 can be rewritten as follows (eq.3) [18]:
cos θ
01= f
3cos θ
0+ 1 − 1
(3)
To obtain a superhydrophobic surface, the contribution of the solid part should be as small as possible. An increase in the height of the structures with increasing laser fluence will lower the fraction of a droplet that is in contact with the solid, thus resulting in high water repellency.
8
randomly oriented PLA fiber mats the water contact angle increases. This also happens on aligned fibers with respect to the former ones.Least el at.[19] concluded, that an increase in the PI contact angle due to the de-pletion of oxygen species and an increase in the carbon content during the laser ablation process contributed to the transition to a hydrophobic surface. They achieved cone struc-tures on PI surfaces, and observed that closely packed feastruc-tures tend to give a high con-tact angle, while features which were spaced further apart had lower concon-tact angle. However, they could not find an obvious relation between laser parameters, feature size or feature density, and the resulting contact angle.
9
Materials and Methods
The main content of this research is to modify the wetting behavior of electrospun PA and PLA nonwovens with laser irradiation. For comparison and for evaluation pur-poses, various bulk materials like PA 6.6, PLLA and PI were also investigated.
3.1 Materials
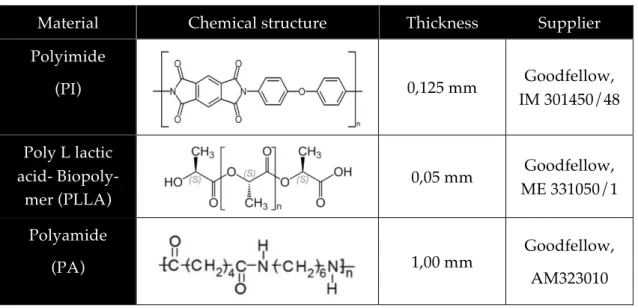
The characteristics of the bulk materials studied are shown in the Tab.3.1.
Table 3.1- Characteristics of the bulk materials studied
Material Chemical structure Thickness Supplier
Polyimide
(PI) 0,125 mm Goodfellow,
IM 301450/48
Poly L lactic acid-
Biopoly-mer (PLLA)
0,05 mm Goodfellow,
ME 331050/1
Polyamide
(PA) 1,00 mm
Goodfellow,
AM323010
The nanofibers materials were produced through the electrospinning process, that generates loosely connected 3D porous mats with a high porosity and high surface area which can mimic extra cellular matrix structure and therefore makes them excellent can-didates for use in tissue engineering.
10
In this process, a high electric field is applied to the droplet of a fluid which may be a melt or solution coming out from the tip of a die, which acts as one of the electrodes. This leads to the droplet deformation and finally to the ejection of a charged jet from the tip of the cone accelerating towards the counter electrode leading to the formation of continuous fibers. Depending on process parameters the fibers can have different lengths and diameters in the nanometer range [23][24].For the production of PA-nonwovens, Polyamide 6.6 (Sigma Aldrich) was dis-solved in a blend of 50 % acetic acid (Carl Roth) and 50 % formic acid (Carl Roth) to a concentration of 15 % (w/v). The commercial nozzle-free electrospinning device “Nan-ospider“(Elmarco) was used for the polyamide nonwovens. The process was performed at 80 kV with a working distance of the electrodes at 240 mm. The diameter of the fibrils is in the nanometer range (60 nm to 250 nm).
PLA was dissolved in Hexafluoroisopropanol (HFIP, Alfa Aesar) to a concentra-tion of 10% (w/v) and the eletrospun on a different “single nozzle” electrospinning de-vice. The tip-to-substrate distance was set at 120 mm, with a voltage of 25 kV and a flowrate of 10 µl/min. The fibers diameters are in micrometer range (200 nm to 900nm)[25].In Fig. 3.1 PA (left) and PLA nanofibers (right) are shown.
3.2 Contact measurement / Wettability
The most widely used technique of contact angle measurement is a direct meas-urement of the tangent angle at the three- phase contact point on a sessile drop profile, carried out using a Drop Shape Analyzer (DSA25E, Krüss) described on Fig.3.2.
50 µm 50 µm
Figure 3.1- SEM pictures of: untreated PA nanofibers (left) and untreated PLA nanofibers
11
With this equipment, it is possible to find the best theoretical profile that matches the drop profile extracted from an experimental image as is shown in figure 3.2 in the right side. From appropriate contact angle measurements , the drop volume, the surface and the surface tension or surface energy can be computed[8].The procedure to determine static contact angles is as follows. At first, sessile drops were comprised of typically 1 µl of ultrapure water (polar test liquid) or diiodo-methane (non-polar test liquid) and were released onto the surface through a (1 ml, 0.5 mm) syringe. The liquid feed rate was 0,08 ml/min and 15 measurements were recorded during 10s. All values displayed are averages of 9 readings at different locations on the sample.
To establish an advancing contact angles, the best way is to slowly grow the sessile drop to a diameter of approximately 5 mm using a micrometre syringe with a narrow-gauge stainless steel or Teflon needle. The needle must remain in the liquid drop during the measurement to avoid undesired vibration. The needle diameter should be as small as possible so that it does not distort the drop profile shape. Because the drop might be unsymmetrical, is necessary to measure the contact angles in both sides of the liquid drop profile, and use the averaged result.
In order to achieve accurate values of contact angles, it was necessary to clean the surface during 10 minutes with isopropanol (not acetone) in an ultrasonic bath (the tem-perature of isopropanol was 21º and after starting the ultrasonic bath was 26º) [27]. Thereafter, dry the samples in a drying oven at a lower temperature than the glassy tem-perature of the material, during 10 minutes. The cleaned samples were kept in an alumi-num foil until the measurement to prevent dust contamination and oxidation. The meas-urements were done in stable ambient atmospheric conditions and the contact angle was always measured in a “fresh” position in the sample, and not in the position that it has previously been wetted. However, for many of the fiber samples this cleaning procedure
Motor driven syringe Illumination source Camera Manual lift table (z-axis) Shape line base line (substrate)
12
could not be used. In these cases, extremely care was taken, to avoid contamination of the surfaces by the handling and storage procedures.The liquid diiodomethane was stored in an amber glass bottle, because it decom-poses in the time due to the effects of light. Also, both test liquids were replaced after one week.
3.3 ATR-FTIR
Chemical analysis of PI bulk was done before and after picosecond laser irradia-tion (before and after cleaning treatment). It was carried out by Attenuated Total Reflec-tance Fourier Transform Infrared (ATR-FTIR) spectroscopy over the range of 4,000- 400 cm-1. The FTIR Spectra were recorded on a spectrometer (BRUKER - FT-IR Spektrometer
Vertex 70) using a single reflection horizontal attenuated total reflection (Platinum -Di-amond – ATR unit) accessory.
3.4 Laser structuring
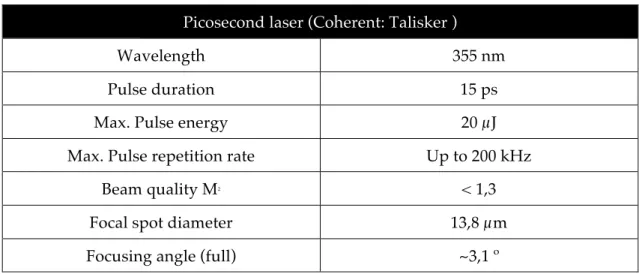
A Nd:YAG based picosecond laser system (Talisker) and two types of nanosecond lasers (Matrix 355 from Coherent and Nexlase) with the following specifications (Tab. 3.2, 3.3 and 3.4) , were used.
Table 3.2- Data of the picosecond laser
Picosecond laser (Coherent: Talisker )
Wavelength 355 nm
Pulse duration 15 ps
Max. Pulse energy 20 µJ
Max. Pulse repetition rate Up to 200 kHz
Beam quality M2 < 1,3
Focal spot diameter 13,8 µm
13
Table 3.3- Data of the Nanosecond laser (Coherent Matrix 355)
Nanosecond laser ( Coherent Matrix 355 )
Wavelength 355 nm
Pulse duration 30 ns
Max. Pulse energy 88 µJ
Max. Pulse repetition rate 50 kHz
Beam quality M2 < 1,3
Focal spot diameter 14 µm
Focusing angle (full) ~3,1 º
Table 3.4- Data of the nanosecond laser (Nexlase)
Nanosecond laser ( Nexlase)
Wavelength 355 nm
Pulse duration 1,9 ns
Max. Pulse energy 53 µJ
Max. Pulse repetition rate Up to 200Hz
Beam quality M2 < 2
Focal spot diameter 11,6 µm
Focusing angle (full) ~6,9 º
Irradiation with the Talisker laser and the Matrix laser, the samples were posi-tioned by a computer- controlled XYZ stage. Then, the laser beam is scanned by an xy-galvoscanning mirror system and focused by an f-theta lens (f=103nm) on the sample surface. The schematic of the laser system is represented in Fig. 3.3.
14
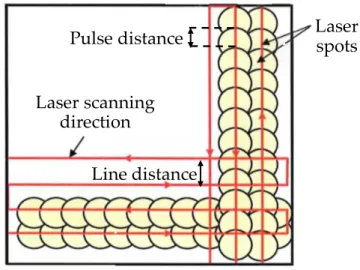
For the Nexlase laser system, the sample is moved in the focal plane of a stationary laser beam.To treat the materials different patterns can be used. In this work chess pattern and straight vertical lines were used. The patterns (Fig. 3.4) are determined by the laser spot to spot distance along the scan direction (pulse distance) and by the distance between the scan lines (line distance).
The spot distance determines the pulse overlap (Od) which refers to the fractional intersection between locations of focus spots for consecutive pulses. It is related to the pulse repetition frequency ƒp , the focus spot diameter d1 and the scan speed or velocity
as (eq.4) [30]:
𝑂
:= 1 −
𝑣
𝑑
=×𝑓
@(4)
The ablation threshold is defined as minimum laser fluence where a significant material removal can be observed[31]. The ablation threshold for each material, found in the literature, are present in table 3.5. Details of the procedure for the calculation of single pulse ablation threshold fluence can be found elsewhere[24].
Table 3.5- Ablation threshold for each material
Material Laser Fth (J/cm2)
PA Bulk 355 nm, 15 ps 2.00
PA nanofibers 355 nm, 15 ps 0.16
355 nm, 1.9 ns 0.48
PLA bulk 355 nm, 15 ps 1.4
PLA nanofibers 355 nm, 15 ps 0.39
355 nm, 30 ns 5.78
Laser
spots
Laser scanning
direction
Line distance
Pulse distance
15
3.5 Microscopy
Scanning electron microscopy, SEM, and confocal microscopy were used to obtain more accurate characterization of the topography of the irradiated surfaces.
SEM
To examine samples having structures in micrometer and nanometer range, the non-conductive samples were coated by thermal evaporation with thin layers of carbon. In the case of PLLA, the samples were coated with gold by sputtering. The SEM used was a Tescan Vega 3. Most of the images were taken at an electron beam accelerating voltage of 5 kV.
Confocal Microscopy
With confocal microscopy (KFM, OPM Messtechnik) imaging, surface roughness measurements, namely sRa and sRzDin, were carried out.
The roughness parameter, Ra, specifies the arithmetic mean of all profile values (eq.5):
𝑅𝑎 =
=C
×
𝑧(𝑥) 𝑑𝑥
C
H
,
(5)
The arithmetic mean roughness (Ra) is the shaded area divided by the evaluation length (L). In the diagram (Fig. 3.5), the average value is shown in red line. The profile values below the red line are mirrored for calculation. Ra is the most frequently used roughness parameter.
16
the following equation 6:𝑠𝑅𝑎 =
1
𝐿
×
1
𝐻
×
𝑧(𝑥, 𝑦) 𝑑𝑥𝑑𝑦
C
H M
H
(6)
where H is the height of the evaluating area.
To determine the parameters RzDIN (eq.7) and Rmax, the evaluation section in the pro-file is divided into five equal long sections. In each segment, Rzi is determined by differ-ence between the largest and smallest profile values. RzDIN is the arithmetic mean of Rzi values, Rmax is the maximum of the five Rzi profile values.
In Fig. 3.6, RzDIN is the mean of the five individual ranges, Rmax the maxi-mum range Rz4.
By using the surface data, the software decomposes the profile into 5x5 sections, and determines in each part the minimum and maximum profile value. The maximum minus minimum values from of each section determine Rzij (i and j represents both di-mensions on the surface of the material). sRzDIN are then calculated as in eq.8 :
𝑠𝑅𝑧𝐷𝐼𝑁 =
1
25
×
𝑅
STUV
WXV V
Y
(8)
𝑅𝑧𝐷𝐼𝑁 =
1
5
×
𝑅
STV
WX=
;
(7)
17
Results and Discussion
To investigate the effects of picosecond laser irradiation on wettability, static and dynamic contact angle measurements were carried out before and after laser processing in different materials.
Although, some dynamic contact angles were measured, normally the static con-tact angle was taken into to account. In porous surfaces like nonwovens it is complicated to measure the dynamic contact angle, because often immediate absorption occurs. Since it is only meaningful to compare static contact angles or only dynamic contact angles, static contact angles were also measured for bulk materials. Static contact angles are more representative for the whole surface, because several droplets were done on dif-ferent surface positions and the final value it was an average of the all measurements.
4.1 Polyimide bulk
Polyimide bulk material was chosen as starting point because its material proper-ties are well characterized. It is a thermally stable material and it is known that the wet-ting properties of surfaces can be altered by surface texturing. [16][29][19][33].
4.1.1 Influence of the cleaning treatment:
The static water contact angle (CA) on untreated polyimide was measured to be 83,2° ± 1,3° and after cleaning treatment 79.0° ± 1.3°, similar reported in literature[16].
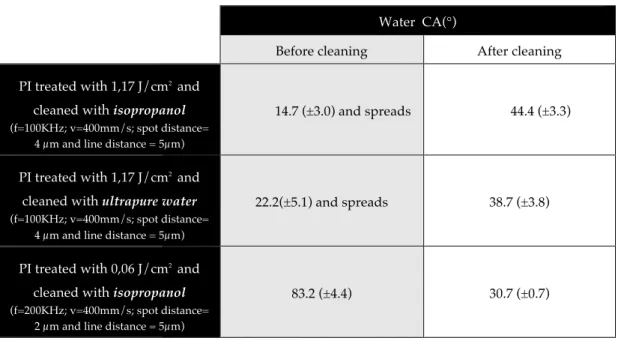
Regarding the cleaning treatment, after laser structuring, a great difference in CA before and after the cleaning treatment was observed (Tab.4.1).
18
Table 4.1- Comparison between results obtained before and after cleaning treatment
In case of spreading, the CA shown is the first CA measured. After cleaning the surfaces with ultrapure water, also the same discrepancy was achieved.
Another attempt was to treat this surface with 0.06 J/cm2, below the threshold flu-ence. Before cleaning treatment, a CA of 83.2° was achieved, similar to the untreated material. However, the CA on the cleaned surface is smaller (30.7°).
In appendix A additional experiments concerning the cleaning treatment are pre-sented.
De Marco et al. [2] found out, that for laser ablation of PMMA the debris strongly affects the contact-angle results leading to hydrophilic behaviour of the substrate (CA ~20°). The presence of the debris was also observed with an optical microscope before and after washing. However, in the experiments with PI presented here it was not pos-sible to see the debris neither in the optical microscope nor in the SEM (Fig. 4.1).
Water CA(°)
Before cleaning After cleaning
PI treated with 1,17 J/cm2 and
cleaned with isopropanol
(f=100KHz; v=400mm/s; spot distance= 4 µm and line distance = 5µm)
14.7 (±3.0) and spreads 44.4 (±3.3)
PI treated with 1,17 J/cm2 and
cleaned with ultrapure water
(f=100KHz; v=400mm/s; spot distance= 4 µm and line distance = 5µm)
22.2(±5.1) and spreads 38.7 (±3.8)
PI treated with 0,06 J/cm2 and
cleaned with isopropanol
(f=200KHz; v=400mm/s; spot distance= 2 µm and line distance = 5µm)
19
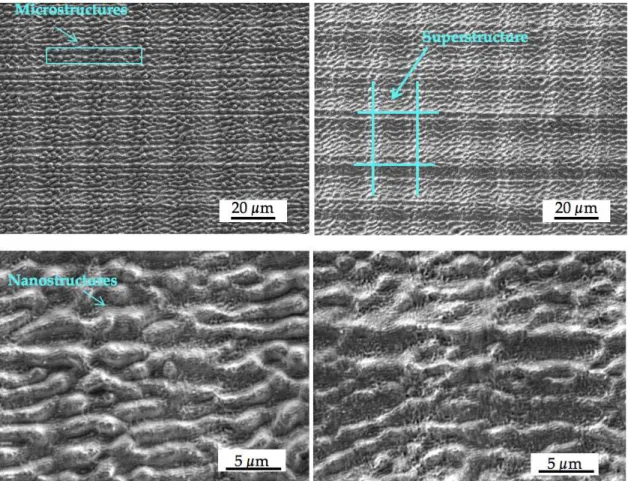
No topography difference was detected between the uncleaned and cleaned sam-ples. In both images is possible to see long “ripples” in one direction (microstructure) with very tiny ripples on the surface (nanostructure) with a distance between them of ~200 nm. Also, the roughness on both samples was identical. In the cleaned sample the sRA value measured was 0.251 µm and the sRzDin value was 1.9 µm. For the not cleaned sample 0.225 µm (sRa) and 1.79 µm (sRzDin) were measured. From the top images in Figure 5 it can be seen, that there is a bigger square superstructure. With computer sim-ulations, it was proved that this latter structure is the interference pattern of the Gauss-ian profile which occurs because of the chess hatch (Fig.4.2). This has to be analysed further.Figure 4.1- Left pictures: SEM images of polyimide without cleaning treatment; Right pictures: SEM images of polyimide after cleaning treatment; Both samples were treated with
20
Thus, a possible reason for the variance in CA, due to the cleaning treatment, could be a change in the surface chemistry. To quantitatively asses the issue of the surface chemistry changes and to get some information on the state of degradation of the poly-mer, infrared spectra of PI at the ablated site (before and after cleaning) and at an un-treated site were acquired in ATR mode.The spectra exhibit the characteristic absorption peaks for C=O unsymmetrical stretching of imide groups (at 1775.42 cm-1), C=O symmetrical stretching of imide groups
(1710.55 cm-1), C=C aromatic (1598.95 cm-1) and C-N, aromatic group (1304.46 cm-1 )[34].
ATR_FTIR spectra displayed on the left graph of Fig. 4.3 were essentially identical for laser structured surfaces before and after cleaning. This indicates that the cleaning Figure 4.3 ATR-infrared spectra of polyimide bulk (blue line) and polyimide treated with picosecond laser (fluence = 1,17 J/cm2; f=100 KHz; v=400 mm/s; line distance=5 um) before
(red line) and after cleaning treatment with isopropanol (black line).
21
treatment with isopropanol induced no or negligible changes in the composition. How-ever, these conclusions have to be further investigated, i.e. by XPS-spectroscopy and Ra-man spectroscopy.Analyzing the right graph in Fig. 4.3, there is a notable difference in intensity be-tween the structured and unstructured samples. The reason why this happens could be the roughness of the laser treated samples leading to a less effective contact between the sample surface and the ATR-probe. No difference in the cleaned and not cleaned sam-ples were detected by ATR_FTIR analysis.
Time dependence of CA:
To study the time dependence of CA under normal atmosphere, represented in table VI, the CA on laser structured uncleaned PI-samples (Fluence=1.17 J/cm2; f=100 KHz; v=400 mm/s; line distance=5 µm and spot distance=4µm) were measured after different time periods. For each time period a new sample was used (Tab. 4.2)
Table 4.2- Variation of PI treated water CA under normal atmosphere
Time after structuring Water CA
1h Total spreading
3h Total spreading
1 day Total spreading
2 days Total spreading
7 days Total spreading
8 days < 20°
9 days < 20°
12 days < 20°
Total spreading was observed for up to 7 days, in the days after, a small CA could be measured. On probable reason for this behaviour it is possible accumulation of dust or/ and change the electrostatics.
4.1.2 Influence of the laser parameters of picosecond laser treatment on CA:
22
samples structured with different laser parameters and the results are summarized in the graphs (Fig.4.4) and Tab.b.1 in Appendix B.
PI samples were washed in isopropanol after laser exposure to clean the surface and remove possible residual dust or/fat.
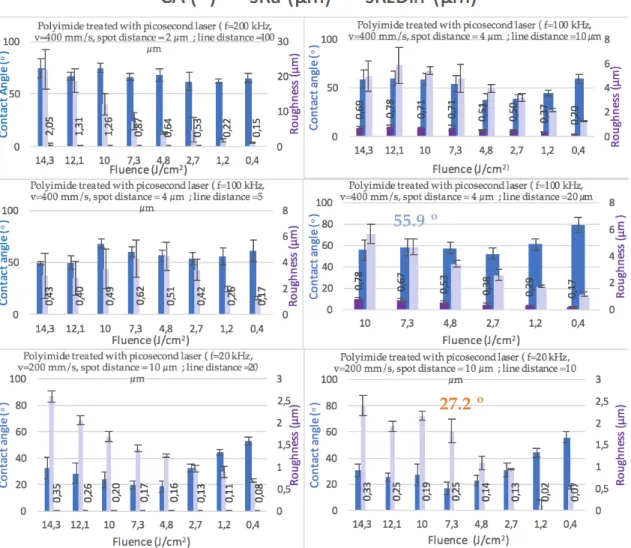
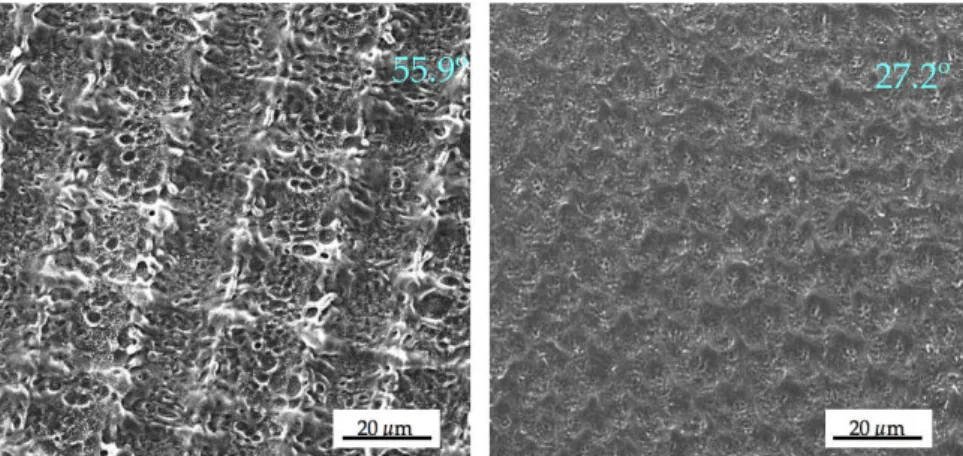
Analyzing Fig. 4.4, it appears, that the spot distance is the parameter with the biggest influence on the water contact angle. For example, the sample treated with 7.3 J/cm2, that has a line distance 20 µm and a spot distance of 4 µm, the water contact angle meas-ured was 55.9° (Fig.4.4, Blue Color). Whereas, another sample treated with the same laser fluence but with a smaller line distance of 10 µm and a bigger spot distance of 10 µm has a water contact angle of 27.2° (Fig.4.4, Orange color). Both samples were coated with carbon layer and analysed with same SEM conditions.
27.2 º
55.9 º
23
The SEM pictures display in Fig.4.5 show that is possible to achieve distinct surface morphologies with the same laser fluences but different spot distances. In the left pic-ture, there is a more prominent macrostructure with a regular pattern that corresponds to the line distance. On the right side the structures are also regular but less prominent and with a completely different pattern. Also, there seems to be more melting on the left sample maybe due to smaller spot distance. The difference between the contact angles (56° and 27°) can be due to this different morphology.In this way, experiments using 7.3 J/cm2, a line distance of 20 µm and a scanning velocity of 400 mm/s, described in Fig.4.6 and in Appendix B (Tab. B.2), were made to understand what happens when the spot distance is changed.
Figure 4.6- Graph with water CA of polyimide samples structured with different spot distance. Blue line corresponds to the water CA of untreated PI
It is evident that up to a spot distance of about 15 µm the water contact angle de-creases. For a spot distance larger than about 25 µm the spots along a laser line are com-pletely separated. With further increasing spot distance the CAs seem to increase again.
55.9º
27.2º
Figure 4.5 SEM pictures of polyimide bulk treaded with 7.3 J/cm2: line distance of 20 µm;
24
The water contact angle measured in the sample with the spot distance of 2 µm was 51.4°. On the sample processed with 16 µm the CA was 34.9°.Fig.4.7 shows SEM pictures and profiles of the surface of the both experiments mentioned before.
In both SEM pictures a regular but different pattern is visible. In the sample with 2 µm spot distance lines with more prominent dots appear, that in the graph profile look like “mountains”. There are two types of mountains. A possible reason for this effect could be due to the cross pattern, the laser first did the horizontal lines and afterwards the verticals. The measured roughness is 1.19 µm (sRa) and 11.9 µm (sRzDin).
In the picture on the right side instead of lines, small circles with the size of the spot distance (16 µm) can be seen. In the respective surface profile, the distance between peaks is about 20 µm, corresponding to the line distance, however the mountains are not so prominent. The roughness measured was 0.19 µm (sRa) and 0.86 µm (sRzDin), and thus much smaller than it was obtained in the sample with a spot distance of 2 µm, ac-cording with smaller spot distance leads to higher energies and consequently more ab-lation.
51.4°
34.9°
40 !m 20 !m
20 !m
Figure 4.7- Above: SEM pictures of polyimide bulk treaded with 7.3 J/cm2, line distance
25
To further increase the CA, the velocity and the repetition rate were decreased to 100 kHz and 200 mm/s (before 200kHz and 400 mm/s) to obtain a similar spot distance but a longer time between the pulses due to the smaller repetition rate. This should lead to more prominent peaks because the material has more time to cool down between two laser pulses, resulting in a reduced melting effects (Fig. 4.8).After changing the velocity, a contact angle of 78.4 º was measured, which is simi-lar to the CA of untreated PI. As in the previous experiments (Fig. 4.7, left) a regusimi-lar pattern with prominent peaks was achieved. However, the small peaks nearly vanished and transformed in to regular peaks.
A further decreasing of the velocity and the repetition rate to 100 mm/s and 50 kHz leads to smaller contact angles. More experiments were done varying different pa-rameters on the picosecond laser: power, velocity, line distance and focus position. How-ever, was not possible to achieve contact angle bigger than 80° (Appendix B). This could be an indication that for this material, Wenzel model could be applied. Using as example the samples shown on Fig. 4.7, the sample that has a water contact angle of 51.4º and sRa of 1.19 µm results in a r of 3.3 (see eq.1). On the other hand, the sample with smaller contact angle (34.9 º) has a smaller sRa (0.19 µm) leading to r= 4.3. So, an initially hydro-philic surface (79.0 º) become more hydrohydro-philic by increasing r.
Teme at al. [29]achieved contact angles bigger than 100° in very melted polyimide surfaces, treated with nanosecond laser irradiation( Nd: YVO Laser). One possible ex-planation for the observed behavior is that the picosecond laser irradiation does not in-duces sufficient melting on the polyamide. The picosecond laser normally evaporates the material and induces less thermal energy in the surroundings of the ablation spot. Also, the good thermal stability of PI further enhanced this “cold ablation”.
50 µm
78.4°
Figure 4.8-SEM picture of polyimide bulk treaded with 7,3 J/cm2
,
line distance of 20 µm,26
To summarize the experiments with PI, it was possible to create completely differ-ent structural surface patterns using differdiffer-ent laser processing parameters. The occur-rence of macro-, micro- and nanostructures like “ripples” in different materials treated with high laser fluences was already reported in the literature [35 - 37]. It was possible to increase the hydrophilicity of PI from 79° (untreated surface) down to (16.7º± 4.8º). This can be interesting for gluing of PI in electronic or microsystem technology applica-tions. The details of the laser induced surface changes could be adjusted by the laser pulse overlap by choosing appropriate laser fluence, pulse repetition rate, scanning ve-locity and hatch line distance (see appendix B, Tab. B.1 and Results and Discussion Fig.4.4). Within the parameter range used in this work, it was not possible to make PI more hydrophobic.4.2 Polyamide 6.6
Electrospun polyamide (PA) nanofibers are currently mainly used for filtration purposes, but they are also interesting in the biomedical field as short-term implants or cell carriers. The wetting behavior of the materials was studied.
4.2.1 PA6.6-Bulk:
The average static water contact angle of untreated PA 6.6 was measured to be 77.1° ± 3.8°, which is in agreement with the value reported in the literature[38]. Neither for ps- nor for ns-laser structuring the CA could be changed significantly compared to the untreated material (Tab.A.4, Appendix A).
4.2.2 PA Nanofibers
Comparing to bulk material, some nonwovens could absorb the water droplets which makes it difficult to measure the static CA with the common procedure. The pro-cedure used before, that is picking up the droplet by lifting the sample until there is contact with the droplet, has the disadvantage that the table must first be moved back to the measuring position and the first drop formation phase cannot be observed. In [27], (Krüss technical notes), another procedure was suggested : let the drops be “fall down”onto the sample from a small height above the sample and record the first milli-seconds of the drop contact. The first measured CA should be the static CA for the nonwovens.
27
In Fig.4.9, the water contact angle is shown as a function of the contact time for untreated nanofibers..
In the graph, it is shown that a contact angle of 94.2° is formed when the drople
t
drops on the nanofibers (Fig.4.10-left) and instantly increases until 101.4° (Fig.4.10-mid-dle). This is the moment when the liquid is in equilibrium with the air [39]. Then, the CA starts to decrease down to a constant value of around 60° (Fig.4.10-right) during few milliseconds. This process takes around 5 seconds until the droplet is completely ad-sorbed in the nanofibers.Compared to untreated PA6.6-bulk material this initial CA is slightly bigger. How-ever, this first contact angle was not reproducible. The fact that is necessary to jiggle the syringe makes the droplet fall faster or slower and consequently produces a difference in the contact angle measure (Tab. 4.3).
Table 4. 3- Different “initial” water contact angles measured in t=0 s in PA nanofibers
CA ( t=0s)
138° 94.2° 70.3° 51.8 ° 45°
4.2.2.1 Picosecond laser treatment of PA-Nanofibers:
PA-Nanofibers were structured with picosecond laser irradiation. The material was treated with different laser parameters. In the Fig. 4.11, shows the water contact angle as a function of the contact time for 3 different samples.
Figure 4.9- Graph of the water CA in function of the contact time with untreated PA nanofibers.
28
Figure 4.11- Graph of the water contact angle as a function of the contact time with PA nanofibers treated with a chess pattern, F= 0.74 J/cm2, f=100 kHz, v=400 mm/s, SD= 4µm and
LD= 40 µm (dark line); F= 0.74 J/cm2, f=100 kHz, v=400 mm/s, SD= 4µm and LD= 40 µm and a
chess pattern (red line) and only vertical lines ( blue line).
In the graph in Fig.4.11, can be seem that the water CA measured in the sample structured with the higher fluence (0.74 J/cm2) and bigger LD (40 µm) decreases faster than in the other samples. In the range from 0.5 s to 2.5 s, the water contact angle was stable and the water was absorbed within 24 s (Fig.4.12-left). The other two samples were structured with lower fluence (0.41 J/cm2) and smaller LD (20 µm). On one a chess pat-tern was used (red line) and on the other only vertical lines (blue line and Fig.4.12-right). On the sample structured with chess pattern the firsts CAs measured were higher, how-ever both CA follow the same tendency. The total absorption of the water, for both sam-ples were about 10 s. So, when the fluence is decresead the absorption time is reduced by half.
92.7°
44.0°
Figure 4.12- SEM pictures of treated PA nanofibers. Left -spot distance of 4 µm and line distance of 40 µm (v=400 mm/s, f=100 kHz, F=0.74 J/cm2); right- with a spot
29
The bigger contact angle (92.7 °) was achieved with a fluence of 0,74 J/cm2 and achess pattern (Fig. 12 left). While the smaller contact angle (44 °) was achieved reducing the fluence to 0.412 J/cm2and making only vertical lines (Fig. 19- right).
In the left picture, there are holes due to the laser cross pattern and the line are not so prominent because the nanofibers look melted. On the right side, the line distance is prominent, is unquestionable that the laser only did one direction (vertical lines) and in the surface, cannot be seen so many molten features.
To summarize, it was not possible to change the wettability of PA 6.6 neither with ps nor ns treatment. In relation to PA 6.6 nonwovens still is necessary to improve the process of measuring the contact angle, one possibility could be using the captive bubble method. This method is done under water, representing a measurement that is much closer to the real process. The treated materials will be insert in a nutrient medium (liq-uid medium) to let the cells grow.
4.3 PLLA( Poly-L-lactide)
PLLA, due to its properties like biodegradability, biocompatibility, thermal stabil-ity and because it is a material approved by the U.S. Food and Drugs Administration (FDA) for human clinical applications, is widely used for biomedical purposes[3]. For bulk PLLA and PLLA nanofibers (PLLA-NF) the change of wettability by laser structur-ing of the surface was studied. Normally PLLA-NF have a very hydrophobic behaviour. However for some cell types it is favourable to have more hydrophilic surfaces[7].
4.3.1 PLLA Bulk
The average water contact angle, measured in this work, of untreated PLLA-Bulk is 78.6° ± 1.6°. A similar value is reported in the literature[40]. Some experiments were done with PLLA bulk varying laser parameters.
For the experiments the PLLA was glued to a flat surface because the structuring of this very thin (50 µm) material caused bending. In this way, some attempts of meas-uring the contact angle were done, however, once again, it was observed that the clean-ing treatment is an important step. The static water CA varied of about 20º due to the cleaning process. So, all bulk samples were cleaned before the CA measurements.
30
Changing only the line distance to 40 µm results in the smaller contact angle achieved in the structured samples (85.8° ± 4.3°) and smaller surface roughness 0.965 µm (sRa) and 9.97 µm (sRzDin), Fig. 4.14.Melted structurers are detected in both pictures, however the surface that has a smaller contact angle has bigger structures.
From the experiments performed in the framework of this thesis, no unambiguous relationship between the laser processing parameters and the contact angle could be ob-served. Increasing hydrophilicity of PLLA bulk material was not obob-served.In this ini-tially hydrophilic material, it was possible to enhance the hydrophobicity, an indication the Wenzel law is not applied. This can be interesting for applications in which a strong interaction between the PLLA bulk and the material in touch is not wanted [41].The fo-cus of this thesis is lying more on PLLA nanofibers, so extended investigations of PLLA bulk material will be done in further work. Althought, some more results about the latter material can be found in Tab. C.1, Appendix C.
(85.8° ± 4.3°)
(117.9° ± 3.1°)
Figure 4.14-SEM picture of PLLA bulk treated with a spot distance of 8 µm, line distance of 20 µm (v=200 mm/s, 25 kHz and 7.3 J/cm2. Respective profile graph of the sample surface.
Figure 4.13-SEM picture of PLLA bulk treated with a spot distance of 8 µm, line distance of 40 µm (v=200 mm/s, f=25 kHz, F=7.3 J/cm2). Respective profile graph of the sample surface
31
4.3.2 PLLA nanofibers
The contact angles represented in table 9 were observed using the suggested pro-cedure, mentioned in section 4.4.2 PA NF, and different droplet sizes. Bigger droplets make it easier to be dropped on the surfaces.
Table 4. 4- Water contact angle on PLLA nanofibers with droplets of different sizes
Droplet size (µl) 1 2 3
CA(°) 129.4 ± 3.4 129.8 ± 2.4 126.5 ± 1.8
The contact angles with 1 µl and 2 µl are very similar but with 3 µl the CA, there is a small decrease. So, the maximum droplet volume which is useable without strongly influencing the results is assumed to be 2 µl. Some experiments were done with a Teflon needle, because sometimes the droplets tend to stay attached to a steel needle. Never-theless, the same happens. It was more difficult to make the droplet falling on the right place, because the teflon needle is more flexible.
In Tab.4.4 it could be seen that the nonwovens show a hydrophobic behavior. This is in contrast with the CA of 78º measured for untreated PLLA-bulk material. It was not possible to clean the nonwoven samples. This could be one significant reason for this difference. It is also clear that the porosity of the nonwovens will affect the wettability. The mechanical properties are different. While the bulk material is more rigid, the nonwovens are smoother and flexible.
Figure 4. 15- Graph of the water contact angle in function of the contact time with un-treated PLLA nanofibers.
32
4.3.2.2 Picosecond laser treatment of PLLA-nonwovens:
PLLA-Nonwovens were structured with picosecond laser irradiation. The mate-rial was treated with different laser parameters and in some samples, a smaller contact angle of 93.8° ± 1.4° compared to 130º of the untreated, was obtained. However, it was not reproducible, other samples were structured with the same laser parameters but a bigger contact angle was achieved (~130º). To understand this behavior, SEM analysis were performed (Fig. 4.16).
The laser structured surface was found to be not homogenous. There were brighter and darker places on the sample. The brighter places seemed to be like the bulk material due to the melted area (Fig.4.16 - right). On the other hand, the darker places show a regular pattern. This heterogeneity could result from the not flat surface of the nanofibers samples during the structuring process. Therefore, PLA NF were placed on a gluing pad to make the surface as flat as possible. This is important, because the sample surface needs to be in the correct focus position of the laser.
Because the bulk material has a smaller contact angle (78º), one approach was to make all the surface partly melting as in the brighter places. One hypothesis was to vary the laser defocusing distance by placing the sample surface “out of focus” up to 2 times the Rayleigh length (ZR). So the laser spot area on the sample was increased and the
flu-ence was decreased. The Rayleigh length (ZR) is the distance along the propagation
di-rection of a beam from the waist to the place where the beam radius is increased by a factor of the square root of 2 and is given by (eq.11) :
𝑍
\=
𝜋×𝑤
H_𝜆×𝑀
_=
𝜋×(7×10
de)
_355×10
dg×1,3
= 0,314 𝑚𝑚
(11)
(93.8° ± 1.4°)
Figure 4.16-SEM pictures of PLLA nanofiber treaded with a spot distance of 4 µm, line distance of 40 µm (v= of 200 mm/s, f= 50 kHz and 7.3 J/cm2). Left: dark spot in the sample; Right:
33
Several laser defocusing distances were tested but no significant change was ob-served in water contact angle. For example, in Fig.4.17, the nanofibers were treated with 4 µm of spot distance, line distance of 40 µm (200 mm/s of velocity, 50 kHz and 0,65 J/cm2)-the sample was placed 0, 56mm~1.8xZrabove the focus position) and the water contact angle achieved was 127. 5º.It was observed, that when the laser crosses twice the same place a hole is drilled, while in areas where the laser only passes once the surface shows more melting effects. Possibly this behavior relates to the fluence distribution across the Gaussian laser beam. In the central part of the beam where the fluence is higher, material ablation occurs. In the wings the thermal effect is stronger making the surface melting. Also, incubation effects caused by the first laser pulses on a spot can make a difference between positions with one- and two times irradiation.
Therefore, instead of chess pattern, only vertical lines were done and the line distance was reduced to 8 µm. No big difference in the CA was achieved. Again, it was noticed, that the treated surface was not homogeneous. There were parts where the laser went through the material. This is caused by the non-uniform thickness (132 µm ± 30 µm) of the PLA nonwovens. Consequently, the glue pad could have had some influence in the contact angle measurement because the value measured on the treated sample 117.7° ± 0.9° comparable to the water CA measured on the glue pad (112.9° ± 1.5°). To avoid the drilling of via holes, a second layer of PLA nanofibers was placed above the first layer glued to the pad to avoid this influence. For these configuration, a water con-tact angle similar to the untreated material was achieved (131.1º).
Figure 4.17 SEM pictures of PLLA nanofiber with spot distance of 4 µm and line distance
of 40 µm (v= 200 mm/s, f=50 kHz and 0.65 J/cm2). Schematic of Gaussian laser beam
Fth
No melt/ fibers
melt melt
Laser lines, melted places holes
20 µm
34
Also, some experiments varying the line energy (LE) the area energy (AE) were per-formed. No simple correlation with the water contact angles was found, as can be notice in Tab.D.1 in Appendix D. The smallest CA that could be achieved was 105,1 ° ± 2,8°. It was measured in a sample structured only in one direction with 4 µm of spot distance, line distance of 8 µm (200 mm/s of velocity, 50 kHz and 1,51 J/cm2 - the sample wasplaced 0, 28 mm above the focus position) resulting in a LE of 1 µJ/µm, Fig.4.18.
On the surface shown in Fig.4.18 stronger melting effects are observed, but the laser lines are still visible and ablation still occurs. E.g., from Fig. 17 and 18 it is also obvious, that the laser ablation can be used to create channels and holes to guide cell growth from the surface into the volume of the nonwovens. These processes have been analyzed in more detail by our group in another work [42].
4.3.2.3 ns-Laser treatment of PLA-nonwovens:
To evaluate the hypothesis that a more molten surface leads to similar static CAs than bulk material, the surfaces were also structured with a nanosecond laser (Nexlase, see Tab. 3.4 Material Methods). The longer pulse duration should lead to a more thermal ablation and thus to more melting on the surface. The achieved structures had a very similar roughness to the untreated nanofibers. Furthermore, comparing with picosecond laser treatment, these surfaces have larger “holes”, less “mountains” and more fine structures due to the collapsing of the nanofibers (Fig.4.19).
50 µm
105.1º± 2.8°
Figure 4.18- SEM pictures of PLLA nanofiber with line distance of 8 µm and spot
35
Figure 4.19-SEM pictures of PLLA nanofiber treated with nanosecond with 47.31 J/cm2
(left); 42.58 J/ cm2 (middle) and 37,84 J/ cm2 (right). The other parameters were equal for every
sample: f= 200 kHz, v=5 mm/s, line distance of 20 µm. The fluence values are given for the focal plane. The samples were treated about 60 µm out of focus.
These surface topographies lead to hydrophilic behavior as can be seen in graphs below (Fig.4.20).
Figure 4.20- Graphs of the water contact angle in function of the contact time with PLLA
nanofibers all treated with f= 200 kHz, v=5 mm/s, line distance of 20 µm and 47.31 J/cm2 (red
36
The water contact angle of the sample treated with less fluence ( 37.84 J/cm2) has a stable and smaller water CA than the untreated PLLA NF. Moreover, water adsorp-tion occurred in two samples, as it can be observed in the graph on Figure 4.20. This is the reason why only the first contact with the sample was considered.As explained in the Fundamentals and Literature section, there are different models to describe the CA on rough and porous materials. The water contact angle measured in each sample is expressed in the Tab.4.5 together with the water contact angle achieved following the theoretical Cassie and Baxter model.
Table 4.5- CA measured and calculated using Cassie Baxter model
To calculate the CA following CB, the solid fraction, fs, must be determined. The
program image J was used to change the contrast of the SEM pictures in a way that the solid fraction appears white (nanofibers) and the gaps between the fibers are black. The program counts the number of black and white pixels and calculates the solid fraction in the picture. This fraction was calculated in two pictures (1k and 2k magnifications) for each sample. A similar f value was achieved in both magnifications.
Sample CA measured(º) fs
Cassie and Baxter CA(º)
Nanosecond laser
(v= 5 mm/s, f=200 Hz, line distance of 20 µm, spot distance of 25 µm, and only vertical lines)47.31 J/cm2 78.4 0.630 103.8
42.58 J/cm2 88.9 0.610 105.2
37.84 J/cm2 91.3 0.625 103.3
Picosecond laser
(v= 200mm/s, f=50 KHz, line dis-tance of 8 µm, spot disdis-tance of 4 µm, and only vertical lines)1.07 J/cm2 105.1 0.440 117.9

![Figure 3.3- Schematic of the pico-second laser system, [28]](https://thumb-eu.123doks.com/thumbv2/123dok_br/16699284.743947/35.892.254.698.852.1094/figure-schematic-pico-second-laser.webp)