Dezembro, 2018
Priscila Gonçalves Calmeirão
[Nome completo do autor]
[Nome completo do autor]
[Nome completo do autor]
[Nome completo do autor]
[Nome completo do autor]
[Nome completo do autor]
[Nome completo do autor]
[Licenciada em Engenharia Biomédica]
[Habilitações Académicas]
[Habilitações Académicas]
[Habilitações Académicas]
[Habilitações Académicas]
[Habilitações Académicas]
[Habilitações Académicas]
[Habilitações Académicas]
Energy production on a Microbial Fuel Cell with
Serratia marcescens, using conductive fabric
as electrodes
[Título da Tese]
Dissertação para obtenção do Grau de Mestre em
[Engenharia Micro e Nanotecnologias]
Dissertação para obtenção do Grau de Mestre em
[Engenharia Informática]
Orientador: Isabel Ferreira, Professora Ph.D., UNL-FCT
Co-orientador: Carla Carneiro, Professora Ph.D., IPS-ESTS/UNL-FCT
Júri:
Presidente: Prof. Hugo Miguel Águas
Arguentes: Prof. Rui Amaral Prof. Carla Carneiro
i
“Energy production on a Microbial Fuel Cell with Serratia marcescens,
us-ing conductive fabric as electrodes”
Copyright © Priscila Gonçalves Calmeirão, Faculdade de Ciências e Tecnologia,
Universidade Nova de Lisboa.
A Faculdade de Ciências e Tecnologia e a Universidade Nova de Lisboa têm o
direito, perpétuo e sem limites geográficos, de arquivar e publicar esta
disserta-ção através de exemplares impressos reproduzidos em papel ou de forma digital,
ou por qualquer outro meio conhecido ou que venha a ser inventado, e de a
divulgar através de repositórios científicos e de admitir a sua cópia e distribuição
com objectivos educacionais ou de investigação, não comerciais, desde que seja
dado crédito ao autor e editor.
iii
v
Agradecimentos
Estes últimos anos foram uma jornada de enorme aprendizagem que
esta-rei sempre grata pelo conhecimento que ganhei e pelas pessoas que conheci.
Apesar de ter sido um percurso complicado não posso deixar de agradecer
aos meus orientadores Professora Doutora Carla Carneiro e Professora Doutora
Isabel Ferreira pelo apoio mesmo perante alguma distância e falta de tempo da
minha parte foram sempre prontos para resolver os problemas que apareciam.
Agradeço ao Professor Doutor José Moura pela oportunidade que me deu
de pertencer ao seu grupo de investigação durante dois longos anos.
Pelo trabalho suportado pela Faculdade de Ciências da Universidade Nova
de Lisboa (FCT-UNL) e pelo REQUIMTE/Centro de Química Fina e
Biotecnolo-gia da Universidade Nova de Lisboa.
Ao laboratório de Bioquímica e Microbiologia da Escola de Tecnologia de
Setúbal - Instituto Politécnico de Setúbal (IPS-ESTS) por me ter dado a minha
primeira base de formação nesta área e por me receber sempre de braços
aber-tos.
Por todo o suporte e incentivo a minha família, que teve um papel muito
importante na conclusão desta tese e que sempre me apoiou e acreditou em
mim. Para a minha mãe e ao meu irmão o meu eterno agradecimento, por me
fazerem a pessoa que eu sou hoje, muito obrigado aos dois.
vi
Resumo
A produção de energia é um tema de tendência atualmente, com o excesso
de combustíveis fóssil e a disseminação de energias renováveis. A busca por
novas formas de produzir energia é ampla. Neste caso, uma bactéria
gram-ne-gativa Serratia marcescens é usada com uma célula de combustível microbiana
(MFC). Este dispositivo irá converter a energia química proveniente da atividade
catalítica da bactéria em eletricidade. Para otimizar o sistema de referência, a
fim de aumentar a sua eficiência elétrica, é utilizada uma deposição de filme de
grafeno sobre uma camada de contato condutiva, materiais condutores recentes
feitos de tecido são alternativa ao habitual filme comum de crómio-ouro, para
manter a neutralidade e evitar a difusão de oxigênio utiliza-se uma Membrana
de Troca de Protões (PEM) ou uma membrana diferente de acetato de celulose.
Essa estrutura permite uma captura mais profunda dos elétrodos livres da
câ-mara anódica.
Palavras-chave: MFC; Grafeno; Tecido Condutor; PLA; Serratia
vii
Abstract
The production of energy is a trend subject nowadays, with overdo of fossil
fuels and the spread of renewable energies. The search for new ways to produce
energy is wide; in this case, a gram-negative bacteria Serratia marcescens is
usedwith a Microbial Fuel Cell (MFC). This device will convert the chemical
en-ergy coming from the catalytic activity of the bacteria into electricity. To optimize
the reference system, in order to increase the electrical efficiency, a graphene
film deposition is used over a conductive contact layer, recent conductive
mate-rials made of fabric are an alternative to the common chromium-gold film, to
main-tain the neutrality and avoid the oxygen diffusion it is used a Proton Exchange
Membrane (PEM) and a different membrane made of cellulose acetate. This
structure allows a more in-depth capture of the free electrodes from the anode
chamber.
Keywords: MFC; Graphene; Conductive Fabric; PLA; Serratia
viii
List of Tables
T
ABLE1
-
L
IST OF THEMFC
BASELINE TESTS AND INTRODUCTION OFS.
MARCESCENS. ... 10
T
ABLE2
–
S
TANDARDS
TATISTICS FOR THE4
POPULATIONS IN STUDY. ... 20
T
ABLE3
-
W
ELCHANOVA
RESULTS. ... 21
T
ABLE4
-
K
RUSKAL-W
ALLISR
ESULT. ... 22
T
ABLE5
-
P
ROPOSED Nº1
CONCENTRATIONS TO REACH OPTIMAL CONDITIONS. ... 24
T
ABLE6
-
P
ROPOSED Nº2
CONCENTRATIONS TO REACH OPTIMAL CONDITIONS. ... 25
T
ABLE7
-
P
ROPOSED Nº3
CONCENTRATIONS TO REACH OPTIMAL CONDITIONS. ... 25
T
ABLE8
-
R
EFERENCE CHARACTERISTICS USED FOR THEC
R/A
U FILM DEPOSITION IN THIS STUDY.
(F
ERNANDES ET AL.,
2014) ... 26
ix
List of Figures
FIGURE 1-SCHEMATIC DIAGRAM OF A TYPICAL TWO-CHAMBER MICROBIAL FUEL CELL.A-RECTANGULAR SHAPE;
B-SQUARE MINIMIZE SHAPE. (DU, LI, & GU, 2007) ... 4
FIGURE 2 – SCHEMATIC OF THE FUNCTIONING REACTIONS OCCURRING ON A MICROBIAL FUEL CELL. (LOVLEY, 2006) ... 5
FIGURE 3 - REFERENCE MICROBIAL FUEL CELL STRUCTURE ADAPTED FROM (FERNANDES, ROCHA, & CARNEIRO, 2014). ... 10
FIGURE 4-GROWTH CURVE FOR SERRATIA MARCESCENS. B)PRESENCE OF PLA TRIAL 1; C) PRESENCE OF PLA TRIAL 2 ... 13
FIGURE 5 - A) PHOSPHATE BUFFER TRIAL IN TWO SUB-CELL COMPARTMENTS; B) GLUCOSE TRIAL IN TWO SUB-CELL COMPARTMENTS ... 14
FIGURE 6 – RESULTS FOR GLUCOSE BASELINE (1). ... 15
FIGURE 7 – RESULTS FOR METHYLENE BLUE BASELINE (2). ... 15
FIGURE 8 – RESULTS FOR THE COMBO GLUCOSE + METHYLENE BLUE BASELINE (3); A – DRY-UP CONDUCTIVE FABRIC; B – CONDUCTIVE FABRIC PREVIOUSLY BATHED IN PHOSPHATE BUFFER SOLUTION. ... 16
FIGURE 9–ALL BASELINES, THIS GRAPHIC DISPLAYS ONLY THE TWO BEST RESULTS FROM ALL THE TRIALS PERFORMED. ... 17
FIGURE 10 - SERRATIA MARCESCENS GROWTH CURVE WITH TEST CONDITIONS THROUGH 30 HOURS. ... 18
FIGURE 11 – INTRODUCTION OF SERRATIA MARCESCENS (4) IN THE MFC TRIALS. ... 19
FIGURE 12 - MFC TEST IN SERIES WITH ALL THREE COMPARTMENTS CONNECTED TO THE CIRCUIT. ... 23
FIGURE 14 - MFC STRUCTURE WITH GRAPHENE AS AN ELECTRODE. ADAPTED (FERNANDES, ROCHA, & CARNEIRO, 2014). ... 26
FIGURE 15-SKETCH OF THE PLA/S.M. BIOCOMPATIBILITY TEST (ERLEN MAYER WITH S. MARCESCENS). ... 35
x
List of Acronyms
3D – Three Dimensional
Au – Chemical element for Gold
BOD - Biochemical Oxygen Demand
Cu – Chemical element for Copper
CNT – Carbon Nanotubes
MFC – Microbial Fuel Cell
Ni – Chemical element for Niquel
PC - Polycarbonate
PDMS - Polydimethylciloxane
PEM – Proton Exchange Membrane
PLA – Polylactic Acid
1
Content
AGRADECIMENTOS V
RESUMO VI ABSTRACT VII LIST OF TABLES
VIII
LIST OF FIGURES IX
LIST OF ACRONYMS X
INTRODUCTION 3
MATERIALS AND METHODS 9
RESULTS AND DISCUSSION 11
CONCLUSION 29
FUTURE PERSPECTIVES 31
REFERENCES 33
3
Introduction
1.1. Microbial Fuel Cell
A Microbial Fuel Cell (MFC) is a device that converts chemical energy, contained in the chemical bonds of organic compounds, to electrical energy through catalytic reac-tions of microorganisms under anaerobic condireac-tions. The electrons produced by the bac-teria from these substrates are transferred to the anode (negative terminal) and flow to the cathode (positive terminal) and their linked by a conductive material containing a resistor or operated under a load.
It has been known for many years that it is possible to generate electricity directly by using bacteria to break down organic substrates. Bacteria can be used in Microbial Fuel Cells to generate electricity while accomplishing the biodegradation of organic mat-ters or wastes.
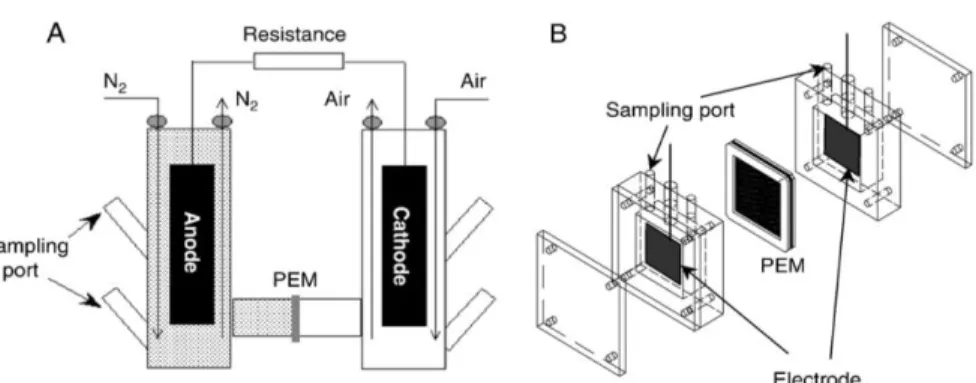
Figure 1 shows a schematic diagram of a typical MFC for producing electricity. The anodic and cathodic chambers are separated by a proton exchange membrane (PEM). Keeping the microorganisms separated from oxygen or any other end terminal acceptor other than the anode makes the generation of electric current possible, requir-ing only an anaerobic anodic chamber. A MFC mimics the way nature uses to recycle the energy from renewable biomass, it does not require fossil fuels, which makes it a clean energy. (Du, Li, & Gu, 2007)
The process is simple, microbes are injected into the anode of the MFC that oxi-dize when added a substrate and generate electrons and protons in the process, the electrons in the anode are transferred to the cathode through an external circuit, the protons cross over a PEM to move into the cathode, as in figure 2. The performance of an MFC is related to the electrochemical reactions that occur between the organic sub-strate, at a low potential, such as glucose and the final electron acceptor with a high potential, such as oxygen. Microbes in the anode will extract electrons and protons. In the dissimilative process of oxidizing organic substrates, however, it’s not possible to
1
4
know the ideal cell voltage because the electrons are transferred to the anode from the organic substrate through a complex respiratory chain that varies from microbe to mi-crobe and even for the same mimi-crobe when growth conditions differ.( Du, Li, & Gu, 2007) (Pant, Van Bogaert, Diels, & Vanbroekhoven, 2010)Microbial cells not only can produce energy (Eq.3) but also have as products water (Eq.2), heat and, depending on the fuel source, little amount of gases release such as carbon dioxide (Eq.1), nitro dioxide and other. (Fernandes, Rocha, & Carneiro, 2014)(Kalathil, Patil, & Pant, 2017)
Anodic reaction: CH3COO- + 2H2O ⟶ (microbes) 2CO2 + 7H+ + 8e- Eq. (1) Cathode reaction: O2 + 4e− + 4H+ → 2H2O Eq. (2)
Overall: CH3COOH+2O2 2CO2 +2H2O+ Biomass + Electricity Eq. (3)
There are a few types of MFC system designs considering de disposition of the anode and cathode chambers. According to (Du, Li, & Gu, 2007) we can find a single-compartment MFC, a two-single-compartment MFC, a Up-flow mode MFC and a Stacked MFC.
The system used in this study is a two-compartment MFC (figure 1). The anode and the cathode chambers are separated/connected by a Proton Exchange Membrane, this system allows the protons to move across to the cathode chamber while blocking oxygen diffusion into the anode chamber. The shapes of each chamber can be whatever the user design it to be, the most simple and also the one of choose for this study was a square chamber, as shown in figure1B.
Figure 1 - Schematic diagram of a typical two-chamber microbial fuel cell. A-
5
Figure 2 – Schematic of the functioning reactions occurring on a microbial fuel
cell. (Lovley, 2006)
1.2. Materials for Microbial Fuel Cell Construction
A wide range of materials have been tested to improve the performance of MFCs. The performance of MFC directly depends on the kinetics of the electrode reactions within the cell, and its performance is very influenced by the materials they are made from. A superior biocompatible material will increase the bacterial adhesion and hence the life of the MFC. (Mustakeem, 2015)
Anodic materials must be conductive, biocompatible, and chemically stable in the reactor solution. Metal anodes must be noncorrosive stainless-steel mesh, but copper is not useful due to the toxicity to the bacteria. The most versatile electrode material is carbon, available as compact graphite plates, rods, or granum- les, as fibrous material (felt, cloth, paper, fibers, foam), and as glassy carbon. (Logan et al., 2006)
Cathode materials due to its good performance, ferricyanide (K3[Fe (CN)6]) is very popular as an experimental electron acceptor in microbial fuel cells. The greatest ad-vantage of ferricyanide is the lower overpotential when using a plain carbon cathode, resulting in a cathode working potential close to its open circuit potential. The greatest disadvantage, however, is the insufficient re-oxidation by oxygen, which requires the catholyte to be regularly replaced or used in tests that required a shorter period of time. The output power of MFCs is greatly constrained by the surface area of electrodes. The ohmic losses are directly proportional to the resistance of the electrode. A wider and effective surface area is considerably important to improve the efficiency of the cell. At
6
the same time, the interfacial impedance of the electrode material should be low to facil-itate the electron transfer. At the cathode, the ionic conductivity is also required to facili-tate triple phase boundary reaction. (Mustakeem, 2015)1.3. Microbial culture: Serratia marcescens
The anodic electron transfer mechanism in MFC is a key issue in understanding the theory of how MFCs work. As mentioned above, microbes transfer electrons to the electrode through an electron transport system that either consists of a series of compo-nents in the bacterial extracellular matrix or together with electron shuttles dissolved in the bulk solution.(Du, Li, & Gu, 2007) Substrate is important for any biological process as it serves as carbon (nutrient) and energy source. The efficiency and economic viability of converting organic wastes to bioenergy depend on the characteristics and compo-nents of the waste material. (Ghanapriya, Rana, & Kalaichelvan, 2010) Theoretically, most microbes can potentially be used as a biocatalyst in MFC. In this study it was used
Serratia marcescens, a gram-negative bacillus classified as a member of the Enterobac-teriaceae, that has been recognized as a cause of hospital-acquired infection for the last
two decades. S. marcescens can use a wide range of nutrients and has the ability to survive and grow under extreme conditions, including in disinfectant, antiseptics and double distilled water and it’s easily recognized by its red colonies. (Hejazi & Falkiner, 1997)
1.4. Applications
The microfluidic MFC device developed could serve as a versatile platform for studying the interactive effects of cell growth, electrode reactivity, and ion transport at the micro-/Nano-scale.(Qian, Baum, Gu, & Morse, 2009)
Presently, most of the world’s energy is derived from fossil fuels, but their effi-ciency, security and environmental effects hold it back from being a preferred energy resource. To meet future energy demands, there is a need of reliable, sustainable and clean energy source. While nuclear power may be an alternative mean of energy, a safer and reliable implementation is always a beneficial choice. Currently, real-world applica-tions of MFCs are limited because of their low power density. (Pant. 2010)
There are a few applications being studied nowadays with Microbial Fuel Cells, the potential of producing energy out of microorganism opens a new perspective for the creation of Bioenergy, new alternative Bio-sensors and for the residual water’s treatment. And the reason for that is that MFCs are theoretically energy profitable, based on their low energy consumption and direct electricity generation, they have a low adverse im-pact on the environment and, theoretically, have a good operational stability and low operational cost. (Liu, Cheng, 2014)
Wastewaters Treatment
A lot of energy is stored in wastewaters, capturing this energy is of great signifi-cance for meeting the world’s energy needs, reducing wastewater handling costs and
7
increasing the sustainability of wastewater treatment. The microbial fuel cell can be used for electrical energy recovery from the organic pollutants in wastewaters. MFCs hold great promise for sustainable wastewater treatment. More importantly, MFCs are capa-ble of directly producing electricity from the organic matter in wastewater with a high energy conversion rate, whereas the conversion of biogas (e.g., CH4 or H2) into elec-tricity causes a significant energy loss of more than 60% (Rittmann, 2008).Biosensors
According to previous studies (Kim, Chang, Gil, Park & Kim 2003) (Chang, Jang,
Gil, Kim 2004)
MFC could be used to continuously measure the biochemical oxygen demand (BOD) of wastewater for real-time monitoring. The directly proportional relation between the coulomb that is being produced from the microbial fuel cell and the strength of the wastewater make possible to use this technology as a BOD sensor.Bio- Hydrogen
Hydrogen can be produced from certain forms of biomass by biological fermen-tation though yields are low. However by electrochemically expanding the cathode po-tential in a MFC circuit it is possible to directly produce hydrogen from protons and elec-trons produced by the bacteria. This technique will reduce the energy needed to make hydrogen directly from organic matter compared to that required for hydrogen production from water via electrolysis. Deriving the protons and electrons from organic matter in-stead of water, we can directly generate hydrogen at a low voltage using a type of MFC device that does not require oxygen. The use of a completely anaerobic process should increase the Coulombic efficiency of the MFC process using mixed cultures as oxygen diffusion through the cathode is avoided (Liu, Grot, Logan 2005).
9
Materials and Methods
This research is based on a previous work (Fernandes, Rocha, & Carneiro, 2014), consists on building a MFC with alternative materials such as polymeric structure and conductive fabric for electrodes.First phase: redo a complete new MFC using the same design structure but re-placing acrylic and glass parts with a PLA 3D printed piece, silicone was replaced with PDMS and Nafion PEM with cellulose acetate.
A compatibility test had to be done using PLA and the bacterial environment in use,
Serratia marcescens, in order to make sure that the change of material wouldn’t affect
the bacteria growth. The process is displayed in figure 14 in Appendix 1.
Second phase: Replace from the original cell only the glass material with PC parts with five times the thickness of the glass, to make a less fragile and a more tightened cell. The electrodes were also replaces for [Cu+Ni+Au] conductive fabric from METALINE, instead of the Cr/Au + Carbon Nanotubes and Nafion PEM (Nafion N-117 membrane,
0.180mm thick, => 0.90 meq-7g exchange capacity)
Third phase: Introduction of graphene, in this phase two experiments were to be done (1) switch the carbon nanotubes for graphene using the same reference method; (2) combining graphene with the conductive fabric using the method performed in phase two of this research.
Since the experiment uses liquid solutions, it was mandatory that this new structure would avoid any leakage so it wouldn’t compromised the study. To ensure this a sealing test was done in all the cells. Guarantee the sterilization of the cell and the materials for the inoculation was also required so to ensure that every glass/plastic material went through an autoclave at 121ºC and the cell (MFC) parts Every single part from the MFC was sterilized using Ethanol 80% concentrated bath for 20-30 min and 30 min exposure to UV light. (Phillips, P: TUV 15WaH/ G15T8 ≈40cm)
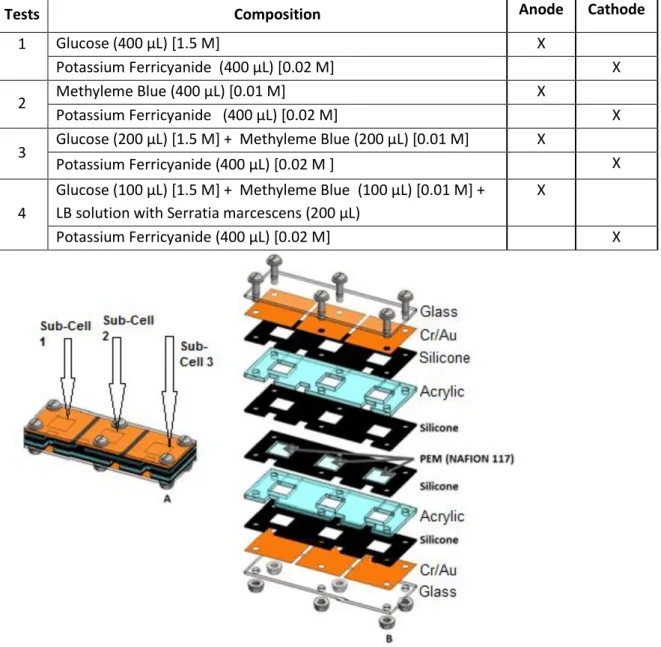
For the MFC trials the following solutions were made using phosphate buffer in-stead of distilled water, this way the volume is slightly minimalized and therefore we can increase the volume of microorganisms, as represented in table 1.
10
S. marcescens was inoculated in 18 mL of LB solution with 2 mL of S.m., for every
trial the temperature for the inoculation was kept at 37ºC in a controlled environment without agitation. The microorganism are added in the MFC after 23 hours of inoculation.
Table 1 - List of the MFC baseline tests and introduction of S. marcescens.
Figure 3 - Reference Microbial Fuel Cell structure adapted from (Fernandes,
Rocha, & Carneiro, 2014).
Tests Composition Anode Cathode
1 Glucose (400 μL) [1.5 M] X
Potassium Ferricyanide (400 μL) [0.02 M] X
2 Methyleme Blue (400 μL) [0.01 M] X
Potassium Ferricyanide (400 μL) [0.02 M] X
3 Glucose (200 μL) [1.5 M] + Methyleme Blue (200 μL) [0.01 M] X
Potassium Ferricyanide (400 μL) [0.02 M ] X
4
Glucose (100 μL) [1.5 M] + Methyleme Blue (100 μL) [0.01 M] + LB solution with Serratia marcescens (200 μL)
X
11
Results and Discussion
1st Phase - 3D printed Microbial Fuel CellIn this early state we’ll start to see how the microorganism in study does behaves and how is this behavior being affected by the presence of new materials. Because the biocompatible properties in a microbial fuel cell and especially in the anode can define the adhesion of the microbes to the material. (Mustakeem, 2015)
In all the tests presented in this section, the growth of microorganisms was carried out in 75 ml of LB solution, inoculated with 7.5 ml of microorganisms. The growths were carried out with an agitation of 120 rpm and a constant temperature of 30 º C and 37°C in order to see the impact of the temperature in the growth process, and with the purpose of studying a controlled environment temperature and a temperature influenced by the season during the tests were being performed. The PLA trials were carried out at 37 ºC and 120 rpm of agitation.
The cell mass of all the trials was measured by reading the absorbance at 600 nm as it can be seen in figure 4.
In figure 4A it’s possible to see the Serratia marcescens growth curve for two dif-ference temperatures (30 ºC; 37 ºC) this variance of temperature appears to have the same growth rate in general for the culture in study.
We can see in the figure 4B and 4C that the growth curve of our bacteria has the same behavior with and without de presence of the PLA. This means that we got good results concerning the new polymeric material, PLA, hence shows no negative impact to the Serratia marcescens growth rate.
A 3D sample was printed with these materials as compact as possible with very thin filaments to avoid any porosity. Though this 3D printed cell fails containing the liquids (H2O) being only sustainable for 2 hours maximum after that time leakage would be per-ceived in the top cover parts and 5 hours later in the central (main container) part of the cell.
This only discards the 3D printed process used for this trial, the process itself de-livers parts with a substantial porosity that doesn’t allow the parts to be used on experi-ments involving liquids.
12
However, PLA is still validated as a possible material to be used on futures expe-riences with microorganisms due to not affecting its growth rate and for its resistance to microbial attack compared to other microbial and synthetic aliphatic polymers. The deg-radation of PLA is slow and that takes a long time for degdeg-radation to start. (Tokiwa, Calabia, Ugwu, & Aiba, 2009)B
A
13
Figure 4 - Growth curve for Serratia marcescens. b) Presence of PLA trial 1; c)
presence of PLA trial 2
2nd Phase – Conductor fabric as MFC electrode
In this part of the experiment the cell structure in use is similar to the one presented in figure 3 with a few changes, instead of the glass we have polycarbonate parts and in the conductive fabric goes to Cr/Au place. Before of each trial the structure and the con-ductive fabric went through the sterilization process mentioned in chapter 2 and in Ap-pendix 1.
This structure contains the solutions perfectly which allowed for the research to proceed to the next step, conductivity trials using a [Cu+Ni+Au] conductive fabric as electrodes. The cells used from the MFC were the left one (1) and the one on the right (3) in all trials except for the ones in series.
The conductivity test was done with Phosphate Buffer and Glucose Figure 5a and 5b respectively. It’s possible to see some electrical charge going throughout the time in case of glucose and in we can also see a peak of charge even when the same solution was being tested in both anodic and cathodic chambers. This another proof that our cell at this point is containing properly our solutions.
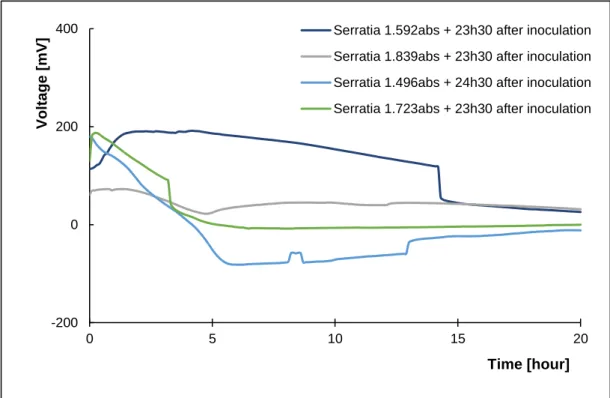
Moving on to what we call the test for baselines, to evaluate all the solutions iso-lated and together, compare them to the trial with S.marcescens and see their contribu-tion and if the microbial component really optimizes our system. In figure 6 - 8 we can see the baseline trials 1 - 3 stated on Table 1 and in figure 9 a resume of the two best results from these baselines. Trial 4 presented on table 1 can be seen on figure 10.
14
Figure 5 - a) Phosphate Buffer trial in two sub-cell compartments; b) Glucose
trial in two sub-cell compartments
-30 -20 -10 0 10 0 0,5 1 1,5 2 V O LT A G E [MV ] TIME [HOUR] SubCell-1 SubCell-3 -100 -75 -50 -25 0 0 5 10 15 20 V O LT A G E [MV ] TIME [HOUR] "SubCell-1" "SubCell-2" SubCell-3
A
15
Figure 6 – Results for Glucose Baseline (1).
Figure 7 – Results for Methylene Blue Baseline (2).
0 50 100 150 200 0 2 4 6 8 10 12 V o lt age [mV] Time[hour] Trial 1 Trial 2 Trial 3 Trial 4 -400 -200 0 200 400 0 5 10 15 20 V o lt age [mV] Time [hour] Trial 1 Trial 2 Trial 3 Trial 4
16
Figure 8 – Results for the combo Glucose + Methylene Blue Baseline (3); A –
Dry-up conductive fabric; B – Conductive fabric previously bathed in Phosphate buffer solution.
When the conductive fabric is previously humidified has a certain stability for a longer period of time as we see in figure 8B.
-200 0 200 400 600 0 5 10 15 20 V o lt age [mV] Time [hour] Trial 1 Trial 2 Trial 3 Trial 4 -200 0 200 400 0 5 10 15 20 V o lt age [mV] Time [hour] Trial 1 Trial 2 Trial 3 Trial 4
A
B
17
Figure 9 – All baselines, this graphic displays only the two best results from all
the trials performed.
The results in figure 9 show a maximum of 436 mV that corresponds to 436 nA being produced by one single sub-cell of the MFC, since 1 MΩ resistor was being used. The peak is from the baseline 3, Glucose + Methylene Blue as the anode and Ferricya-nide as the cathode.
Introducing Serratia marcescens to the trials
In all the tests presented in this section, the growth of microorganisms was carried out in 20 ml of LB solution, inoculated with 2 ml of microorganisms. The growths were carried out with a constant temperature of 37°C. The cell mass of all the trials was meas-ured by reading the absorbance at 600 nm. In figure 10 we see a typical growth curve for our bacteria. We can detect two different behaviors, one we can see all the stages of the growth (leg, log and stationary) reaching the stationary stage 24 hours after the in-oculation and the other one we see that the bacterial culture hasn’t reach the stationary state even 30 hours after the inoculation. Compared to the study from (Fernandes, Rocha, & Carneiro, 2014 ) we already can spot a difference, somehow our inoculations were influenced between 5h – 25h that led to a different growth rate, most likely temper-ature fluctuations influenced by the environment where the culture was staying. In the previous study the best state for Serratia marcescens ended up to be the stationary state with an absorbance at 600 nm of ≈ 1.7 (14 hours after inoculation) and in this study the
-50 0 50 100 150 200 250 300 350 400 450 500 0 5 10 15 20 V ol tag e [m V ] Time [hour] "Glucose-Ferricyanide_1" "Glucose-Ferricyanide_2" "Methylene blue - Ferricyanide_1" "Methylene blue - Ferricyanide_2"
"Glucose+Methylene Blue - Ferricyanide_1" "Glucose+Methylene Blue - Ferricyanide_2"
18
stationary state is at an absorbance (600 nm) of ≈ 1.5 and in the present study is needed ≈23 hours for the bacteria to reach this state.Figure 10 - Serratia marcescens growth curve with test conditions through 30 hours.
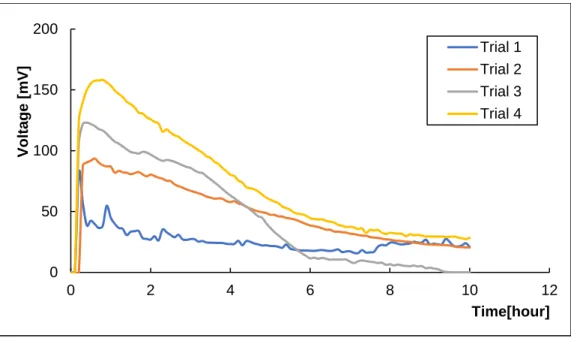
When adding the 100 µL of S.marcescens and reducing to half (100 µL) the Glu-cose volume, the electric potential registered doesn’t go above the 200 mV, as seen in figure 10, we get one rehearsal with a continuous electric charge during approximately 14 hours and 2 other that have their peak in the first minutes and go immediately down-wards in the next 4 hours.
The conducting fabric doesn’t have the same electron acceptance as a nanocar-bon based electrode or a graphene coated electrode would’ve, this and the possibility of the concentration of substrate in the anode chamber be insufficient for the number of microorganisms in the anode, can be one explanation for the results obtained. (Mustakeem, 2015) There are a lot of variables associated to this new microbial fuel cell technique, due to the alternative materials that has being used.
We can see in figure 10 that different concentration of Serratia marcescens show different behaviors on the MFC, the middle concentrated cultures of the four show the highest currents and for the first 4 hours we got and average current of 171.902 nA for the culture with 1.592 Abs (600 nm) and 117.8122 nA for the culture with 1.723 Abs (600 nm).
This difference shows that the inoculation process was suffering an external inter-ference that made the process longer than it was theoretically expected to be and, there-fore the trials in the MFC were not always performed in the stationary stage of the bac-teria. This can explain part of the results that we see on figure 11. For the “Serratia 1.592 Abs” and “Serratia 1.723” we see periods of great energy production which indicates that
19
the inoculum used was indeed in the stationary stage, on the other hand the other two results indicates that most probably the bacteria was still on the logarithmic stage.Figure 11 – Introduction of Serratia marcescens (4) in the MFC trials.
We will analyze the data for Glucose + Methylene Blue and after adding
S.mar-cescens in the first 5 hours to see if we can find some similarity between them and see
if the energy being produced is influenced by the Serratia marcescens or only the Glu-cose., for that we will make a brief statistic.
Statistical view
To better understand these results, it was performed an Analysis of Variance (ANOVA) between those 4 trials and see if we can find some statistical values that lead us to some conclusions about these tests.
Samples in study:
A – Serratia marcescens 1.592 Abs (600 nm) B – Serratia marcescens 1.723 Abs (600 nm)
C – Glucose + Methylene Blue – Potassium Ferricyanide _1 D- Glucose + Methylene Blue – Potassium Ferricyanide _2
ANOVA is one of the most frequently used methods in statistics and it allows us to compare more than two group means in a continuous response variable, which is our case. To perform an ANOVA model we’re assuming 3 things:
-200 0 200 400 0 5 10 15 20 V o lt age [mV] Time [hour]
Serratia 1.592abs + 23h30 after inoculation Serratia 1.839abs + 23h30 after inoculation Serratia 1.496abs + 24h30 after inoculation Serratia 1.723abs + 23h30 after inoculation
20
1. the probability distribution of responses in each group is normal.2. Each probability distribution has the same variance. 3. Samples are independent.(Liu, 2015)
The null hypothesis for Welch’s F-test is H0: “The means are equal” The null hypothesis for Levene’s test if H0: “The variance are equal”
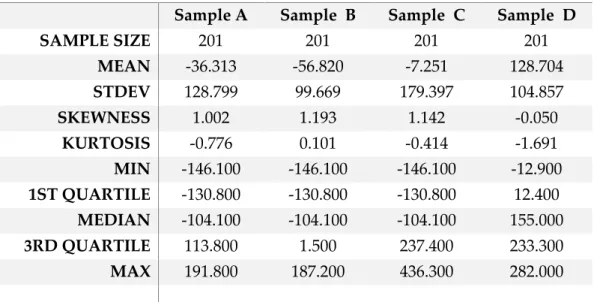
Table 2 – Standard Statistics for the 4 populations in study.
SUMMARY STATISTICS
Sample A Sample B Sample C Sample D SAMPLE SIZE 201 201 201 201 MEAN -36.313 -56.820 -7.251 128.704 STDEV 128.799 99.669 179.397 104.857 SKEWNESS 1.002 1.193 1.142 -0.050 KURTOSIS -0.776 0.101 -0.414 -1.691 MIN -146.100 -146.100 -146.100 -12.900 1ST QUARTILE -130.800 -130.800 -130.800 12.400 MEDIAN -104.100 -104.100 -104.100 155.000 3RD QUARTILE 113.800 1.500 237.400 233.300 MAX 191.800 187.200 436.300 282.000
21
Table 3 - Welch ANOVA results. WELCH ANOVA HO : means are equal Sum of Squares Degrees of Free-dom Mean
Squares F ratio P value
Among Groups 1142637.447 3 380879,1491 224.9 7.85E-44
Within Groups 398253.1918 98.19 4055.944513
Total 1540890.639 203
H0 rejected, Group Means are different
Overall statistics Test of equal Variance
Grand Mean 204.5926471 Levene's test W critic P value
Average
Sam-ple Size 51 statistic W 40.13649422 2.649751643 2.39E-20 Number of
Groups 4 Variances are unequal
The red curve represents the estimated population distribution assuming normalilty
The green lines represent the 95% Individual Confidence Intervals for Means
Through ANOVA we can say with 95% confidence that there is an heterogeneity between the means and the variances of these 4 groups or at least one of them, since when the null hypothesis is rejected from different independent groups, ANOVA only provides information that the means of the four groups may differ and at least one group may show a difference (Kim, 2017). At the histograms presented in Table 2 we can have an indication that the data of our four samples possibly doesn’t tend to a normal distri-bution therefore this test will not give us a conclusion free of errors concerning S.
mar-cescens. Since the data is not normal instead of looking for the means or the variance it
would be better to check the medians of the groups, for that we will perform a Kruskal-Wallis test. The Kruskal-Kruskal-Wallis test is a non-parametric test, which means that it does
22
not assume that the data came from a distribution that can be completely described by two parameters, mean and standard deviation (the way a normal distribution can), it is less sensitive to outliers, and the efficiency loss compared to ANOVA decreases for large samples. Since our results are not normal then this test can be done.The null hypothesis for Kruskal-Wallis test is H0: “The medians are equal”
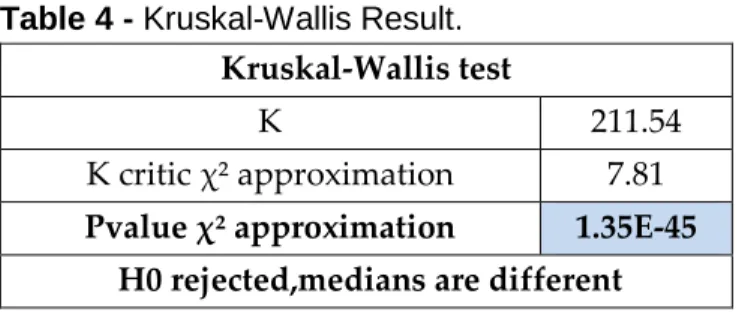
Table 4 - Kruskal-Wallis Result. Kruskal-Wallis test
K 211.54
K critic χ² approximation 7.81
Pvalue χ² approximation 1.35E-45 H0 rejected,medians are different
The Kruskal-Wallis test states that the medians are different comparing all four populations, which means that we can say with 95% confidence that the trials performed with the presence of bacteria are not the same that the ones with baseline 3 which means that the MFC is functioning the same way with Serratia marcescens.
To better understand the negative impact that is seen in the MFC efficiency after
S.marcescens some additional tests should’ve been made with brand new fabric to see
the impact of the reutilization of it in this study, even though every material was sterilized the UV light can only reach the surface of each part, so the internal fibers of this electrode can only be cleaned with the ethanol bath and this can be one of the causes for our results. After concluding the additional tests it’s important to retain the best method from that and make new trials with different glucose concentrations and possibly at different stages of the bacteria growth. This path with help us to reach the best conditions for these MFC using a textile electrode. Unfortunately, these tests were not conducted due to stock rupture in the supplier for this conductive fabric.
Microbial Fuel Cell with 3 Sub cells in series
The three sub cells of the Microbial Fuel Cell were filled with the respective anode and cathode composition and connected in series to a circuit with 1MΩ resistor.
The expected results would’ve been to have approximately three times more power coming out from the system, however the actual data is presented in figure 11, and the energy being collected from the system dropped from the initial tests with the bacteria.
23
Figure 12 - MFC test in series with all three compartments connected to the
cir-cuit.
It’s possible to see a peak of around 100 nA at the first half an hour and after that the current from the system drops to negative values a close indicative that there’s no more substrate available in the anode or that our microorganisms are not feeding as it is supposed to.
In these later batches of Serratia marcescens the culture took at least 5 to 6 hour more to reach the absorption value at 600 nm than usual, the color was also a little lighter, this probably is one of the main reasons to a low energy production for the trial in series.
The conductive fabric had been reutilized since the introduction of bacterial cul-ture, due to out of stock from the supplier and at these stages the electrode were too castoff due to all the process of sterilization, some of the fibers were already peeling out and the porosity was starting to be seen. The Microbial fuel cell was tightened even more too avoid any leakage of contaminating material though the use of the same cell also provoked the shatter of the Polycarbonate parts. I believe all that together led to the results presented in figure 9 and 10, because even though the fabric as an electrode isn’t the most optimized choice, it proved to work and ended up to get 436nA as its maximum current without microbial influence and 191 nA with it.
The electrons released from microbes have to travel along an external circuit after passing through the anode, thus the conductivity of these materials is a determinant aspect for a study like this. The high electrical conductivity of the electrode material makes the electron flow with less resistance. At the same time, the interfacial impedance should be low to facilitate the electron transfer. At the cathode, the ionic conductivity is also required to facilitate triple phase boundary reaction. Therefore, the material for elec-trodes should be durable as well as stable in an acidic and a basic environment. (Mustakeem, 2015) And the conductive fabric in study presented to be durable for at
-150 -100 -50 0 50 100 150 0 5 10 15 20 V O LT A G E [ mV ] TIME [HOUR] Series 1 Series 2
24
least 3 to 4 sterilization process and from then on each time it went through that process and through another microbial trial the fibers would wear out more and more.Third phase – Graphene
The introduction of graphene as a new electrode, the procedure to be done would be similar, the structure used is presented in figure 13, and the concentrations for the anode and cathode components would be the ones stated in table 5, 6 and 7. Initially the purpose of this phase would be to combine the graphene with the [Cu+Ni+Au] conductive fabric and also use the reference (figure 3) construction adding graphene to the electrode Cr/Au, but the main supplier for [Cu+Ni+Au] conductive fabric stopped supplying to us.
First, we need to find new optimal conditions so, new concentrations were recal-culated in order to improve the previous steps and to try and find the optimum condition for this specific design with these particular materials, and at the same time try to under-stand the balance and the exact contribution of the main solutions to the energetic ca-pability of the microbial fuel cell.
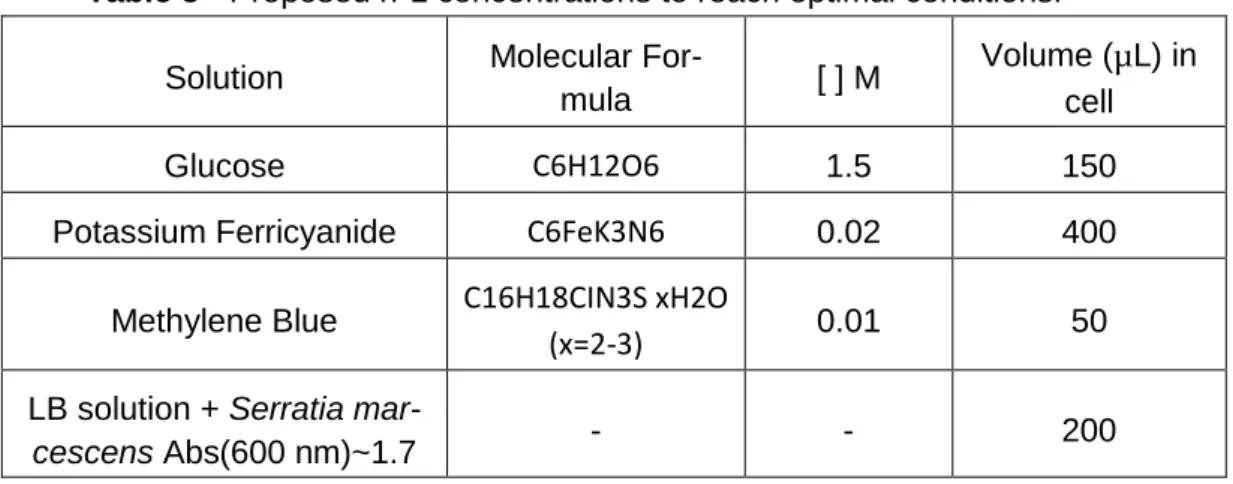
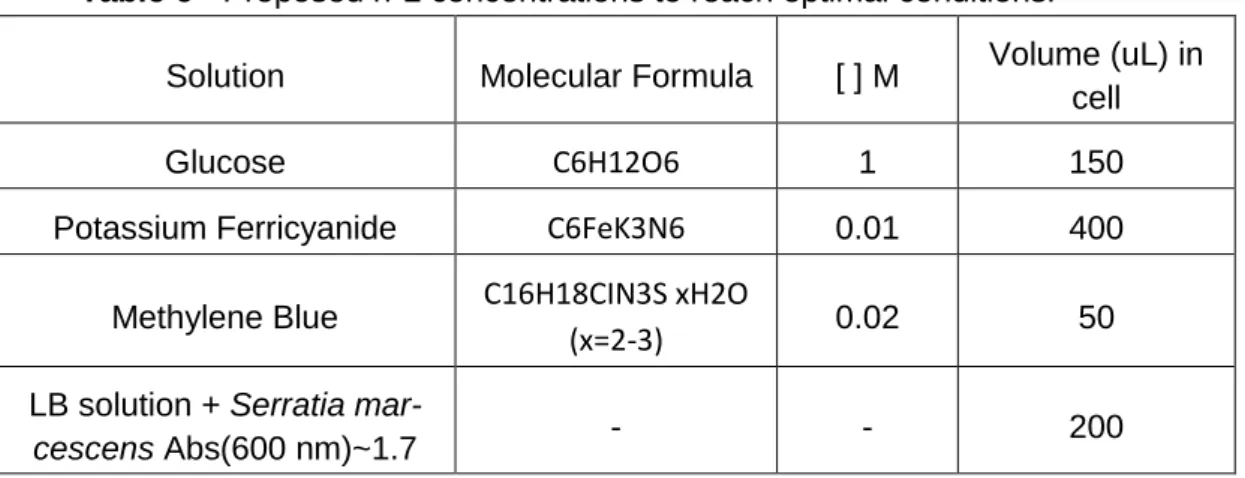
In table 5 we keep the same conditions apart from the glucose volume to be used that is now 150 μL; in table 6 we decrease the glucose concentration, keep the volume as 150 μL, double the concentration for Methylene Blue to 0.02 M and get half the con-centration for Potassium Ferricyanide (0.01 M); in table 7 the glucose concon-centration goes back to 1.5 M and it’s maintained the same conditions in table 6.
Table 5 - Proposed nº1 concentrations to reach optimal conditions.
Solution Molecular
For-mula [ ] M
Volume (μL) in cell
Glucose C6H12O6 1.5 150
Potassium Ferricyanide C6FeK3N6 0.02 400
Methylene Blue C16H18CIN3S xH2O
(x=2-3) 0.01 50
LB solution + Serratia
25
Table 6 - Proposed nº2 concentrations to reach optimal conditions.
Solution Molecular Formula [ ] M Volume (uL) in cell
Glucose C6H12O6 1 150
Potassium Ferricyanide C6FeK3N6 0.01 400
Methylene Blue C16H18CIN3S xH2O
(x=2-3) 0.02 50
LB solution + Serratia
mar-cescens Abs(600 nm)~1.7 - - 200
Table 7 - Proposed nº3 concentrations to reach optimal conditions.
Solution Molecular Formula [ ] M Volume (uL) in
cell
Glucose C6H12O6 1.5 150
Potassium Ferricyanide C6FeK3N6 0.01 400
Methylene Blue C16H18CIN3S xH2O
(x=2-3) 0.02 50
LB solution + Serratia
marcescens Abs(600
nm)~1.7
- - 200
With this new set of experiments we have a new baseline for this new MFC using graphene and we can from these results set the best concentrations and volumes. It would also be interesting to test different concentrations S. marcescens between 1.4 Abs (600 nm) and 1.9 Abs (600 nm) just to see if there is actually a better range at this microorganism state to increase their proliferation inside the MFC and therefore contrib-ute to more free electrons being released.
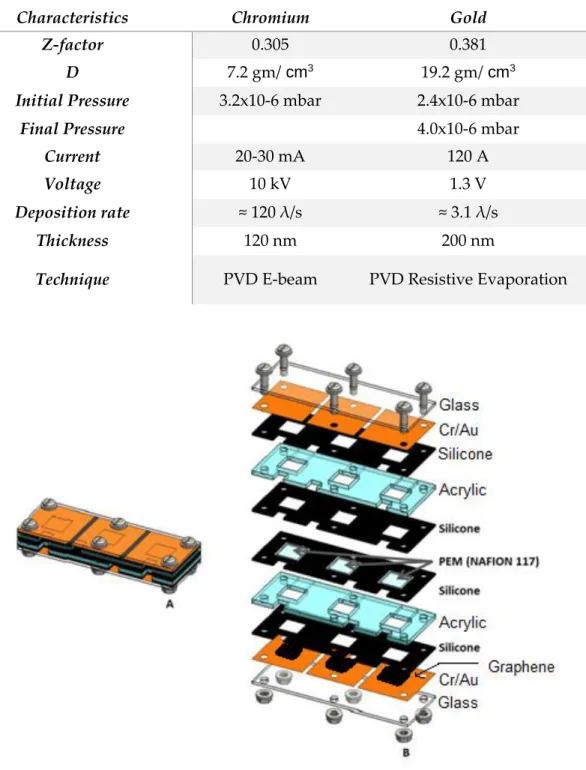
In this stage, to avoid more variables the structure that is going to be used just like the referenced cell (figure 3) but instead of the carbon nanotubes we’ll have a graphene film deposited on the same electrical conductive material (Chromium and Gold). For the Cr/Au deposition the procedure used was the Physical vapor deposition also known as PVD on a thinner glass (this glass was previously machined with a diamond tip drill in order to perform the screws holes without breaking the entire glass).
26
Table 8 - Reference characteristics used for the Cr/Au film deposition in this study.
(Fernandes, Rocha, & Carneiro, 2014)
Characteristics Chromium Gold
Z-factor 0.305 0.381
D 7.2 gm/ cm3 19.2 gm/ cm3
Initial Pressure 3.2x10⁻⁶ mbar 2.4x10⁻⁶ mbar
Final Pressure 4.0x10⁻⁶ mbar
Current 20-30 mA 120 A
Voltage 10 kV 1.3 V
Deposition rate ≈ 120 λ/s ≈ 3.1 λ/s
Thickness 120 nm 200 nm
Technique PVD E-beam PVD Resistive Evaporation
Figure 13 - MFC structure with graphene as an electrode. Adapted (Fernandes,
Rocha, & Carneiro, 2014).
Graphene has been attracting strong scientific and technological interest with great application potentials in various fields, such as lithium ion batteries, solar cells and elec-trochemical super-capacitors, for its unique nanostructure and extraordinary properties
27
such as high surface area that allows the capture of electrons that come from all direction in comparison with NTC, excellent conductivity, outstanding mechanical strength and extraordinary electro catalytic activities. (Zhang., 2011)Using graphene in the MFC and the best conditions in the anodic chamber we not only are optimizing the electrical source but also the collection of the energy that is being produced on the cell, because the graphene film on top of the Cr/Au will increase the electron acceptance area and condition, hence a higher energy gain for our microbial fuel cell.
Unfortunately, of graphene was not possible to proceed due to a not yet optimized procedure for the graphene deposition in our facilities. But the studies stay open for when the chance to proceed with it appears.
29
Conclusion
The outcomes of this thesis were not what we initially expected for this research, though we were trying to test a new set of materials and in science we cannot always expect to have positive results, but we are always learning something new and look for-ward to try new methods, techniques and materials.Despite the unavailability of some of the materials that didn’t allow the research to continue, that are some positive conclusions to attain from this study:
- The presence of Polylactic Acid (PLA) doesn’t not affect the normal growth rate of Serratia marcescens and that this strain is actually pretty resistant; - Biodegradable materials such as PLA are a possible material to be use in
future studies involving pathological strain of bacteria;
- The [Cu+Ni+Au] conductive fabric can be used as a capable electrode for MFC studies, though the architecture implemented in this study isn’t the best for this type of electrode;
- This research show that [Cu+Ni+Au] conductive fabric does have its limita-tions should not be used too many consecutive times but, it still allowed to recollect some of the energy being produced in the MFC.
- Compared to our referenced study the bacteria didn’t always had a stable growth state and the stationary stage oscillated depending on external factors, so a better knowledge of Serratia m. growth should’ve been done in order to find the external factor and exactly at what time (after inoculation) should the bacteria reached its stationary state. In the reference study we had a mark of aprox. 14h to reach the optimum stage and in this study we needed aprox. 23h in some cases and more than 30h on other cases.
- In this study the peak of current that was able to get with a full MFC working structures was aprox. 200 nA for about 5 consecutive hours, was lower than previous reference study where was possible to generate 616 nA. Though is important to enhance that in this study was not used car-bon nanotubes vertically aligned as it was used on the reference study and that contributed to a better capture of the electrons within the cell.
30
In the future, probably the reutilization of the material would be something to lose and try and use always brand-new fabric to not attack the fibers with the aggressive process of sterilization nor the possible contamination of the bacterial culture. Probably a new cell design would be beneficial in future studies using conductive fabric, this one had the contact area to the circuit on the bottom and to avoid possible leaks through the fibers a MFC with the electrodes coming from above would be the best choice.31
Future Perspectives
I believe that Microbial Fuel Cells studies will be an advantage to science and the world. With too much fossil fuel consumption and the limitations of renewable energy, is imperative that an alternative may be found.Combining the waste waters around the globe, or starting to power up small elec-tronics with these type of alternative energy using glucose or sucrose substrate, will have a gigantic impact in a good way, decreasing the human footprint and will help long term to safe some of the precious land resources.
A fusion with a new and sprouting technology that we are creating on the daily basis, 3D printing, conductive materials made of textiles, photolithography, paper en-gineering are some of the examples.
In (Fraiwan, Mukherjee, Sundermier, Lee, Choi, 2013) work, a paper-based MFC was
created featuring a paper-based PEM and chambers for the anode and cathode. Flexible carbon clothes were employed as the electrodes and hydrophobic barriers in paper sand carbon clothes were patterned with photoresist. This MFC was able to generate a current of 74 μA and an operating voltage of 74mV. This paper-based MFC has the advantages of being easy to use, are disposable and cost-effective, and a good solution for a power source for disposable diagnostic devices.
A new mini-MFC array was designed and microfabricated, and its electricity gen-eration performance was evaluated. Compared to the previous mini-MFCs reported in the literature, the mini-MFC fabricated in this work has the highest maximum power den-sity of the reported micro-liter scale MFCs and maximum current denden-sity of 29mW/m2 and 2148mA/m2, respectively. The microfabrication process, configuration design and utilization of air cathode are likely to have contribution to the great performance of the mini-MFC.
Another example is towards fabrication of small-sized MFCs for their potential ap-plication as miniature devices. A miniature volume and a low substrate consumption, makes a mini-MFC especially useful in medical, communication and other areas, and is also suitable for evaluating the electricity generation characteristics of microorganisms, such as electrochemical activity, maximal potential, and power density.
In (Chen, Zhao, Qiu, Chu, …, (2010) work, a new single-chamber mini-MFC was fabricated using a micro fabrication technique by applying sputtering deposition, photo-lithography and ion-beam etching. A mini-MFC array was designed and micro fabricated,
32
and its electricity generation performance was evaluated. The mini-MFC fabricated in this work reported a very high power and current density of 29mW/m2 and 2148mA/m2, respectively.There are also some frontline researches in the mutagenesis and even recombi-nant DNA technology that can possibly be used in the future to obtain some super mi-croorganisms for MFCs. Microbes may be used as a pure culture or a mixed culture forming a synergistic microbial consortium to offer better performance.
One type of bacterium in a consortium may provide electron mediators that are used by another type of bacterium to transport electrons more efficiently to an anode (Rabaey & Verstraete, 2005), but it is possible that an optimized microbial consortium can be obtained to operate an MFC without extraneous mediators or biofilms while
achieving superior mass transfer and electron transfer rates and this is also an innovating technique to be explored in the future (Du, Li, & Gu, 2007).
33
References
Du, Z., Li, H., & Gu, T. (2007). A state of the art review on microbial fuel cells: A promisingtechnology for wastewater treatment and bioenergy. Biotechnology Advances, 25(5), 464–482. https://doi.org/10.1016/j.biotechadv.2007.05.004
Fernandes, M., Rocha, L., & Carneiro, C. (2014). Development of a Micro-Microbial Fuel Cell with Nanoimproved Electrodes.
Ghanapriya, K., Rana, S., & Kalaichelvan, P. T. (2010). Electricity Generation from Serratia marcescens Isolated from Aerobic Sludge using Microbial \r\nFuel Cell Technology and its Optimization. Electricity Generation from Serratia Marcescens Isolated from Aerobic Sludge Using Microbial Fuel Cell Technology and Its
Optimization, 09(10), 32–38. Retrieved from
http://www.advancedbiotech.in/archives_apr 10 _Electricity.html
Hejazi, A., & Falkiner, F. R. (1997). Serratia marcescens. J. Med. Microbiol, 46(1997), 903–912. https://doi.org/10.1099/00222615-46-11-903
Kalathil, S., Patil, S. A., & Pant, D. (2017). Microbial Fuel Cells: Electrode Materials. Reference Module in Chemistry, Molecular Sciences and Chemical Engineering. Elsevier Inc. https://doi.org/10.1016/B978-0-12-409547-2.13459-6
Kim, T. K. (2017). Understanding one-way anova using conceptual figures. Korean Journal of Anesthesiology, 70(1), 22–26. https://doi.org/10.4097/kjae.2017.70.1.22 Liu, H. (2015). Comparing Welch ’ s ANOVA , a Kruskal-Wallis test and traditional
ANOVA in case of Heterogeneity of Variance.
Logan, B. E., Hamelers, B., Rozendal, R., Schröder, U., Keller, J., Freguia, S., … Rabaey, K. (2006). Microbial fuel cells: Methodology and technology. Environmental Science and Technology, 40(17), 5181–5192. https://doi.org/10.1021/es0605016
Lovley, D. R. (2006). Microbial fuel cells: novel microbial physiologies and engineering approaches. Current Opinion in Biotechnology, 17(3), 327–332. https://doi.org/10.1016/j.copbio.2006.04.006
Mustakeem. (2015). Electrode materials for microbial fuel cells: Nanomaterial approach. Materials for Renewable and Sustainable Energy, 4(4), 1–11. https://doi.org/10.1007/s40243-015-0063-8
Pant, D., Van Bogaert, G., Diels, L., & Vanbroekhoven, K. (2010). A review of the substrates used in microbial fuel cells (MFCs) for sustainable energy production.
Bioresource Technology, 101(6), 1533–1543.
https://doi.org/10.1016/j.biortech.2009.10.017
Qian, F., Baum, M., Gu, Q., & Morse, D. E. (2009). A 1.5 microL microbial fuel cell for on-chip bioelectricity generation. Lab on a Chip, 9(21), 3076–3081. https://doi.org/10.1039/b910586g
Tokiwa, Y., Calabia, B. P., Ugwu, C. U., & Aiba, S. (2009). Biodegradability of Plastics Bio-plastics, 3722–3742. https://doi.org/10.3390/ijms10093722
Zhang, Y., Mo, G., Li, X., Zhang, W., Zhang, J., Ye, J., … Yu, C. (2011). A graphene modified anode to improve the performance of microbial fuel cells. Journal of Power Sources, 196(13), 5402–5407. https://doi.org/10.1016/j.jpowsour.2011.02.067 LIU, W., CHENG, S. (2014). Review: Microbial fuel cells for energy production from
wastewaters: the way toward practical application. Journal of Zhejiang University-SCIENCE A (Applied Physics & Engineering), 841-861.
Kim, B., Chang, I., Gil, G., Park, H., & Kim, H. (2003). Novel BOD (biological oxygen demand) sensor using mediator-less microbial fuel cell. Biotechnology letters, 25(7):541–545, ISSN 0141-5492. PMID: 12882142.
34
Chang, I., Jang, J., Gil, G., Kim, M., Kim, H. (2004) Continuous determination of biochemical oxygen demand using microbial fuel cell type biosensor. Biosensorsand Bioelectronics, 19(6):607–613. ISSN 09565663.
http://linkinghub.elsevier.com/retrieve/pii/S0956566303002720.
Rittmann, B.E., (2008). Opportunities for renewable bioenergy using microorganisms. Biotechnology and Bioengineering, 100(2):203-212. [doi:10.1002/bit.21875]
Liu, H., Grot, S., Logan, B.E. (2005). Electrochemically Assisted Microbial Production of Hydrogen from Acetate. Environmental Science & Technology, 39(11):4317–4320, ISSN 0013-936X, 1520-5851. http://pubs.acs.org/doi/abs/10.1021/es050244p. Fraiwan, A., Mukherjee, S., Sundermier, S., Lee, H.S., Choi, S. (2013) A paper-based
microbial fuel cell: Instant battery for disposable diagnostic devices. Biosensors and Bioelectronics, 49: 410 - 414. https://doi.org/10.1016/j.bios.2013.06.001.
Chen, Y.P., Zhao, Y., Qiu, K.Q., Chu, J., Lu, R., Sun, M., Liu, X.W., Sheng, G.P., Yu, H.Q., Chen, J., Li, W.J., Liu, G., Tian, Y.C., Xiong, Y. (2010). An innovative miniature microbial fuel cell fabricated using photolithography. Biosensors and Bioelectronics, 26: 2841-2846. https://doi.org/10.1016/j.bios.2010.11.016.
Rabaey, K., Clauwaert, P., Aelterman, P., Verstraete, W. Tubular microbial fuel cells for efficient electricity generation. Environmental Science and Technology 2005, 39: 8077–82.
35
Appendix 1
Preparation of LB solution For V= 250 mL of LB solution: Reagents: Peptone – 2. 5 g Yeast Extract – 1. 25 g NaCl – 1. 25 gDistilled H2O – till 250 ml
Preparation: Balanced every single reagent mixed all together and start dissolving with a little distilled water when all the solution is dissolved and presents no solids, fill the rest of the Shott flask till 250 mL total. Seal it and proceed to sterilization of the mean (auto-clave).
Biocompatibility - test method
Figure 14 - Sketch of the PLA/S.m. biocompatibility test (Erlen Mayer with S.
marcescens).
The unprocessed and processed PLA parts (previously sterilized) would be put inside the Serratia marcescens culture each material had its own cultures and it would be introduced 3 – 4 pieces of about 2-3 cm for the unprocessed material and 5 – 6 parts of 1 cm x 1 cm squares for the processed material
36
Sterilization process:
20-30 min – Bath of 80% concentrated Ethanol solution. 30 min – Exposed to UV light to surface sterilization.
Involved the parts with the silver paper also UV sterilized and keep the parts there till it’s time do use.
Microbial Fuel Cell Setup:
Figure 15 - Standard setup used for all the MFC tests using a resistor of 1 MΩ.